7.0 Organizational Performance Results 7.1a Student Learning Results
Action plan steps for the focus on curriculum goal of the district (i.e., ensuring JPS students meet or exceed world class standards) show very positive trends.
The District is well on its way to being the first school district in Oklahoma to achieve the maximum API score of 1500, the target for excellence set by the state to meet accountability requirements of NCLB. The District has led the state for K-12 schools of comparable size, with API scores of 1292 and 1334. (Figure 7.1-1) API Scores 0 300 600 900 1200 1500 2001 2002 2003 2004 Jenks State API Comparable District within County Comparable District, Central Oklahoma Figure 7.1-1 API scores remain high/show growth toward 2010 target of 1500 ( ).
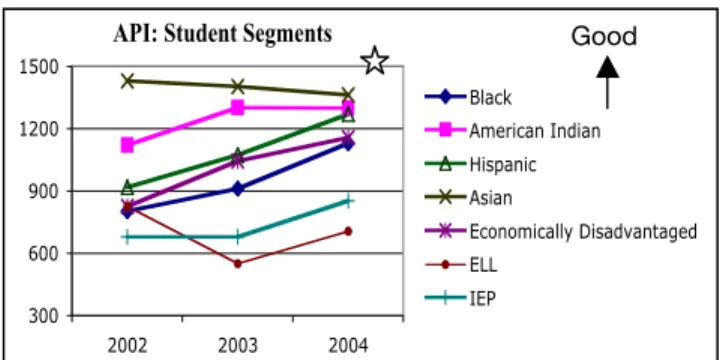
API scores for most student segments showed improvement in 2004. Increased attention to the learning needs of the ELL student segment in 2003 led to an improved API score in 2004, although it has not yet surpassed the 2002 score. The downward trend for the Asian student segment can be attributed to changing demographics within this segment; each year a higher portion of these students are English Language Learners. (Figure 7.1-2)
API: Student Segments
300 600 900 1200 1500 2002 2003 2004 Black American Indian Hispanic Asian Economically Disadvantaged ELL IEP
Figure 7.1-2 Most student segments reflect API growth toward the 2010 target of 1500 ( ).
Attendance and graduation rates became part of the API formula in 2003. In comparison with a Baldrige recipient, attendance rates are within a percentage point and JPS graduation rates surpass a Baldrige recipient. (Figure 7.1-3)
Attendance/Graduation Rates 86.00% 88.00% 90.00% 92.00% 94.00% 96.00% 98.00% Jenks Baldrige
Recipient Jenks RecipientBaldrige
Attendance Graduation Rate
2003 2004
Figure 7.1-3 Attendance rates remain steady/graduation rates improve. (Target: 100% by 2010 )
Third grade students show progress in reaching reading and math goals i.e., all 3rd grade students performing on or above grade level by 2014. (Figure 7.1-4)
Progress in Reading and Mathematics Proficiency 3rd Grade Students 0% 20% 40% 60% 80% 100% 2000 2001 2002 2003 2004 Reading Mathematics
Figure 7.1-4 3rd grade students grow in reading and mathematics proficiency. (Target: 100% by 2010 ) When comparing 5th and 8th grade reading and mathematics scores for the past two years with a Baldrige recipient, JPS students surpass their counterparts. However, changing demographics have led to a slight decrease in reading proficiency at 5th grade. Intervention strategies developed by the teachers and administrators targeted specific subgroups to improve reading proficiency scores in 2005. (Figures 7.1-5 and 7.1-6)
Progress in Reading and Mathematics Proficiency 5th Grade Students 40% 50% 60% 70% 80% 90% 100% Jenks Baldrige Recipients Jenks Baldrige Recipients Reading Mathematics 2004 2003 2002 2001 2000
Figure 7.1-5 5th grade students grow in mathematics /changing demographics cause slight decline in reading. (Target: 100% by 2010 ) Good Good Good Good Good
Progress in Reading and Mathematics Proficiency 8th Grade Students 40% 50% 60% 70% 80% 90% 100% Jenks Baldrige Recipient Jenks Baldrige Recipient Reading Mathematics 2004 2003 2002 2001 2000
Figure 7.1-6 8th grade students grow in reading and mathematics proficiency. (Target: 100% by 2010 ) End of Instruction proficiency scores in English II and Algebra I also show that JPS secondary students rank favorably with Regents exam mastery scores in the Pearl River School District. More deliberate analysis of Algebra I scores led to the strong growth in proficiency. Improved analysis of 2004 English II scores targeted specific areas for increased focus by teachers with the goal of improved 2005 English II scores. (Figure 7.1-7)
End of Instruction Proficiency Growth: English II and Algebra I
(Students Scoring Advanced and Satisfactory)
30% 40% 50% 60% 70% 80% 90% 100% 2001 2002 2003 2004 JPS English II Baldrige Recipient JPS Algebra I Baldrige Recipient
Figure 7.1-7 Growing in English and Algebra Proficiency (Target: 100% by 2010 )
The District has shown exemplary progress in growing the AP program at the secondary level through its expanding equity (bringing the rigor of AP coursework to all students) while maintaining excellence (percentage of students scoring 2 or better on AP exams) goals. Three measures that chart progress in the equity goal are the growth in student enrollment in AP courses, the increase in the number of AP course
opportunities, and the results of the process of removing barriers to enrollment (student segment percentages). In ten years (1995-2005) of tracking AP enrollment data, the District has grown from 12.5% of the student body taking AP coursework to 49.8% of the student body. Nationally in 2004, 31% of students enrolled in an AP course. (Figure 7.1-8)
Since 1995, the District has also grown in the number of AP courses offered to the current 33 of 38 possible courses. Continued growth is expected with the addition of AP Chinese Language and Culture in 2007 (fueled by our partnership with Chengdu #7, Chengdu, China) and AP German Language in 2008. Pearl River, a Baldrige recipient, offers 15 of 38 possible courses.
AP Enrollment Growth:
% of the Student Body Enrolling in at Least 1 AP Course
0.00% 10.00% 20.00% 30.00% 40.00% 50.00% 60.00% 70.00% 80.00% 90.00% 100.00% 1999-00 2000-01 2001-02 2002-03 2003-04 2004-05 Jenks Nationally
Figure 7.1-8 Charting Growth in JPS AP Enrollment (Target: 100% by 2014 )
The systematic Removing Barriers to AP Enrollment Process was initiated in 1998-1999; it has invigorated the continuing pattern of enrollment growth. Cycle refinements in the Removing Barriers Process are described in Figure 7.1-9.
1998 1999
Social Studies Vertical Team established AP training opportunities expanded to 7th-9th grade teachers
AP Literature prerequisite eliminated
2000 2001
Mathematics and Science Vertical Teams established
Open enrollment established for language arts and social studies courses
Advanced history/world history courses eliminated
2002 2003
World Language Vertical Team established Teacher signatures reduced/ eliminated for math and science courses
Basic courses eliminated in mathematics 2003
2004
Math assemblies begun
Handout about the value of AP coursework distributed to families during CAPS conferences.
2004 2005
A focus on defining rigor/adding rigor to the standards and objectives begun
Nonfiction writing opportunities workshop established
2006 2007
AP training opportunities will be expanded to 5th-6th grade teachers
CAPS process will be refined/extended to middle school/intermediate schools Figure 7.1-9 Cycle refinements continue to remove barriers to AP enrollment.
Tracking AP enrollment data by student segments began in 2003-2004; the data provide indicators for further cycle refinements in the removing barriers process. (Figure 7.1-10)
Good
Good
Increased AP enrollment has not diminished excellence as seen in the exam results in Figure 7.1-11. The percentage of exams scored at three or better remains consistent i.e., between 62% and 67% of the number of exams taken. The class of 2004 surpassed national levels and the highest state rankings. Thirty-seven percent of the class demonstrated a mastery level of three or better compared to a national percentage of 13% and the highest state percentage of 21.2%.
AP Exam Results:
The Power of the 2 Level and Mastery Levels 3-5
0 100 200 300 400 500 600 700 800 900 1000 1100 2000 2001 2002 2003 2004 # of Exams Taken
Mastery Level Scores 3+ The Power of 2 Score Scores < 2
Figure 7.1-11 Charting Excellence in AP Exam Results: the Power of 2 and Mastery Levels 3-5
National Merit Recognitions: Semi Finalists to Finalists
6 8 10 12 14 16 18 20 2000-2001 2001-2002 2002-2003 2003-2004 2004-2005 National Merit Semi-finalists
National Merit Finalists
Figure 7.1-12 Charting Excellence: Semi-Finalists Become National Merit Finalists
Another measure of the excellence of a JPS education can be seen in the consistent academic honors garnered by JPS students. Regularly, National Merit Semi-Finalists become
Finalists. (Figure 7.1-12) Since 2001-2002 two JPS students have been recognized as Presidential Scholars and six have been recognized as semi-finalists honoring their outstanding scholarship, leadership, service, and creativity. Each year JPS students are chosen for the Academic All-State award given to seniors who are in the top 1% academically of all Oklahoma high school seniors. This year six students were selected, the highest number in the state for any school district.
Students in JPS are college bound as evidenced by high scores on both the ACT and the SAT, a steadily rising college attendance rate, and increases in scholarship awards. Seventy-nine percent of JPS secondary students take the ACT; a smaller number take the SAT; high scores on both exams give them a competitive edge in the college acceptance process. (Figures 7.1-13 and 7.1-14) Eighty-five percent of the 2004 graduating class enrolled in colleges and universities, an increase of one percent over 2003. Seniors were offered over $10,000,000 in scholarship monies in 2004, an increase from the $8,000,000 offered the 2003 graduating class.
ACT Scores 18 19 20 21 22 23 24 2000-2001 2001-2002 2002-2003 2003-2004 Jenks State National
Figure 7.1-13 Charting Excellence: Close to 50% of JPS students taking the ACT scored in the top national quartile.
SAT Scores 0 200 400 600 800 1000 1200 1400 2000-2001 2001-2002 2002-2003 2003-2004 Jenks State National
Figure 7.1-14 Charting Excellence: SAT Score Comparisons
JPS is addressing the strategic challenge posed by population and diversity shifts. The District has continued to expand staff to meet the needs of the ELL student segment which is 19.69 times larger than it was in 1997. (Figure 7.1-15) The District also implemented a kindergarten DLP (English/Spanish) in 2004-2005 and is on track for expanding the program to include first grade for the 2005-2006 school year (an action plan step resulting from the Goal: Focus on Students).
2003-2004 2004-2005
Segment Enrollment% of Total Enrollment% of AP Enrollment% of Total Enrollment% of AP
African American 4.8% 1.5% 4.8% 1.3% Native American 6.0% 8.5% 7.9% 7.2% Hispanic 1.9% 3.2% 5.3% 3.6% Asian 2.4% 7.4% 2.4% 4.8% White 79% 79% 78.8% 81% Other 0.8% 1.0% 0.8% 2.1%
Figure 7.1-10 Building Equity by Tracking AP Enrollment: %s for student segments
Good Goo d o oood Goo d o d Good
2001-2002 3. 5 Certified Teachers 2.5 Instructional Assistants .5 District Coordinator 2002-2003 5 Certified Teachers 3.5 Instructional Assistants .5 District Coordinator 2003-2004 5 Certified Teachers 3.5 Instructional Assistants .5 District Coordinator 2004-2005 6.5 Certified Teachers 4.5 Instructional Assistants 1 District Coordinator
Figure 7.1-15 Expanding Staffing to Meet the Needs of the Growing ELL Student Segment
7.2 Student- and Stakeholder-Focused Results
7.2a (1) Student enthusiasm for learning and strong parent and community support are hallmarks of a JPS education. Several measures in this section also show success in addressing the strategic challenge of ensuring safety. Students participating in the 2004 Saturday Remediation Program for pre-algebra and Algebra I concepts and skills show renewed enthusiasm for mathematics with their strong pre- and post-score improvements. (Figure 7.2-1)
Algebra I Pre-Test Score 53.6 % Algebra I Post-Test Score 76.3%
Percent Improvement 42.37%
Figure 7.2-1 Improved learning in mathematics increases success rates.
Improved attention to punctuation and capitalization in writing was the outcome of a 3rd grade project at one of the elementary schools i.e., an average increase of 29 points in the experimental group. As a result of the project students write with more confidence and clarity. (Figure 7.2-2)
Third Grade Pre/Post Results
50 55 60 65 70 75 80 85 90 Pre-Test Post-Test
Average Percent Correct
All 3rd Grade Experimental Group Control Group
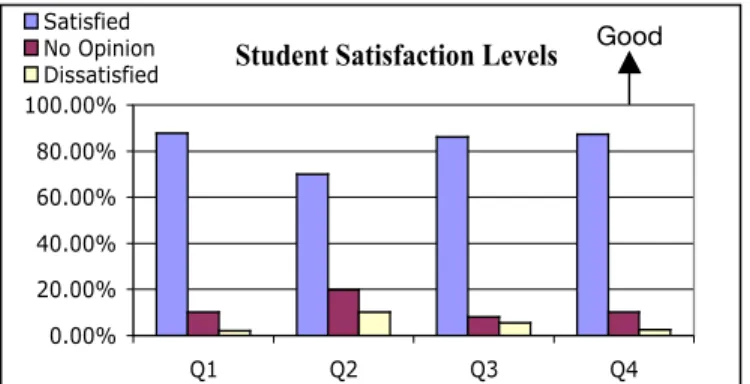
Figure 7.2-2 Increase in writing skills (capitalization and punctuation) leads to more confidence in writing. A 2005 student satisfaction survey of elementary and
secondary students demonstrated high satisfaction levels in all four domains: I learn a lot at school (Q1); I enjoy the time I spend at school (Q2); I feel safe at school (Q3); I practice good character habits at school (Q4). (Figure 7.2-3)
Student Satisfaction Levels
0.00% 20.00% 40.00% 60.00% 80.00% 100.00% Q1 Q2 Q3 Q4 Satisfied No Opinion Dissatisfied
Figure 7.2-3 Student satisfaction levels are high.
Another measure of student satisfaction is the drop-out rate; it has shown a steady decline from a high of 6.3% in 1999 to the 1.2% rate at the close of the 2004 school year (less than the 1.6% rate of a Baldrige recipient). (Figure 7.2-4)
Drop-Out Rate 0.00% 1.00% 2.00% 3.00% 4.00% 5.00% 6.00% 7.00% 1999 2000 2001 2002 2003 2004 School Year
Figure 7.2-4 Drop-out rate shows dramatic decrease. SHOCK (Seniors Helping Our Community and Kids) Day service project participants have increased in the three years of the program to the current high of 535 seniors representing 81% of the senior class. (Figure 7.2-5)
SHOCK Day Participants
300 400 500 600 2003 2004 2005 School Year
Figure 7.2-5 Seniors give back to the district.
Calls to the Safe-Call Hotline to share incidents of bullying or harassment and concerns for safety have declined; the rise for 2001-2002 is attributed to post-9/11 concerns for safety. (Figure 7.2-6) Good Goo d oooo d Goo d od Good Goo d oooo d Goo d od Good Goo d oooo d Goo d od Good
During the 2004-2005 school year, the middle school implemented a school climate survey to measure students’ levels of safety, comfort, and acceptance. Results from October and November surveys show increased feelings of safety and acceptance. (Figure 7.2-7)
Student Climate Survey
0 200 400 600 800 1000 1200 1400 October November # of Responses Safe, comfortable, accepted responses Unsafe, uncomfortable, unaccepted responses
Figure 7.2-7 Middle school student climate survey shows increased feelings of safety & acceptance.
One measure of stakeholder satisfaction is shown in the passage of bond issues (with a consistent approval rate of 60% or more) in 40 of 41 elections. (Figure 7.3-7)
Another measure of stakeholder satisfaction is evidenced from the Budget Reduction Process implemented during the 2002-2003 school year. In addition to the accumulation of regular volunteer hours, more than 125 patrons gave extra time as substitutes in the classroom (a savings of $297,355 in substitute costs to the District budget) and a group of patrons initiated Project Trojan Pride an effort resulting in donations to the school in a total amount of more than $162,000.
Stakeholder satisfaction can also be seen in the high rate of participation in the annual Bond Task Force Process. One-third of the committee’s members are patrons and many are returning participants each year.
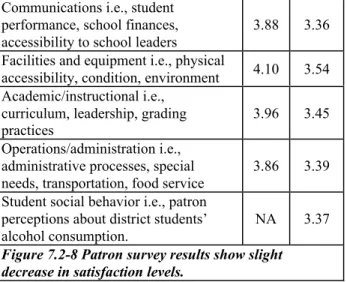
Patron survey results show a slight decline from the 1998 to 2001 levels (rating scale of 1-5 with 3.5+ considered a positive or favorable rating). The aftermath of 9/11 and tensions around the world may have been factors in the slight decline.
Because of the slight decline, specific cycle refinements were initiated to address areas within each domain. (Figure 7.2-9)
Communication
JPS Annual Report to the community established
District goals, core values, character habits posters deployed
Edline implemented
Annual budget posted on the JPS Web page.
Administrators and teacher
representatives attend PTAG monthly meetings.
Facilities and Equipment
SERT and Safe School Committees established
Academics and Instruction
Core values and character habits defined
Patrons included on the Curriculum Development Committee
Professional development training aligned more systematically with the curriculum
Elementary report card in-services scheduled for families
Operations and Administration
Menu changes initiated by the Child Nutrition Department
CAPS spring enrollment conferences established
Patrons included on School Calendar committee
Social Behavior Student Assistant Programimplemented.
Figure 7.2-9 Cycle refinements address patron satisfaction levels.
7.2a (2) Jenks is where you want to be with a nationally recognized school system, quiet neighborhoods, quality housing, and a small town atmosphere with big city convenience minutes away. It is no wonder that Jenks is the second fastest growing city in the state. (Figures 7.2-10, 7.2-11 and 7.2-12)
Number of Safe-Call Hotline Calls
2000 4 2001 5 2002 7 2003 2 2004 3 2005 YTD: 0
Figure 7.2-6 Satisfaction Indicator: Declining Calls to the Hotline
Dimension 1998 2001
Communications i.e., student performance, school finances, accessibility to school leaders
3.88 3.36 Facilities and equipment i.e., physical
accessibility, condition, environment 4.10 3.54 Academic/instructional i.e.,
curriculum, leadership, grading practices
3.96 3.45 Operations/administration i.e.,
administrative processes, special needs, transportation, food service
3.86 3.39 Student social behavior i.e., patron
perceptions about district students’ alcohol consumption.
NA 3.37
Figure 7.2-8 Patron survey results show slight decrease in satisfaction levels.
Good
Population Statistics: Jenks 0 2,000 4,000 6,000 8,000 10,000 12,000 14,000 1970 1990 2000 2004 Estimate
Figure 7.2-10 Population soars in the town of Jenks.
Year Housing Starts Average Cost
1996 108 $110,000 1997 118 $118,400 1998 145 $122,700 1999 209 $116,100 2000 252 $116,200 2001 267 $117,200 2002 300 $101,600 2003 327 $130,600 2004 380 $131,500
Figure 7.2-11 Housing starts continue to grow. JPS Student Population 0 2,000 4,000 6,000 8,000 10,000 1960 1970 1980 1990 2000 2004
Figure 7.2-12 JPS student population soars.
Even with the ups and downs in the economy and changing demographics, the JPS Volunteer Program is in its 17th year of adding value to the learning environment. Calculating this added value (volunteer hours times the average hourly rate of pay for a teacher assistant), shows that 2004 volunteer hours represent a $450,000 contribution of services to JPS. (Figure 7.2-13)
Number of Hours
Number of Volunteers Contributing the Hours
2000-2001 61,712 1,238
2001-2002 64,159 1,246
2002-2003 58,186 1,085
2003-2004 54,650 1,058
2004-2005 YTD: 42,513 YTD: 1,000
Figure 7.2-13 A Tradition of Excellence: Volunteers make a difference.
Many volunteers (over 20% of the volunteer pool each year) donate more than 100 hours of service per year. Their services are recognized through membership in the Century Club. (Figure 7.2-14)
Century Club Members
2000-2001 264
2001-2002 260
2002-2003 214
2003-2004 240
Figure 7.2-14 A Tradition of Excellence: Reaching the 100 Hour Volunteer Mark
7.3 Budgetary, Financial, and Market Results 7.3a(1) Excellence in academic performance could not happen without excellence in managing financial resources and the budgetary process. The District is meeting the strategic challenge of maintaining fiscal stability and integrity and showing progress and/or accomplishment in many of its action plan steps in the Goal: Focus on Finances. The yearly auditor’s report consistently finds JPS in compliance with the accounting practices prescribed by the ODE and budget laws of the state of Oklahoma (Title 709-22-109). The integrity of fiscal stability is also maintained through an in-depth
Budgetary Planning Process and an ongoing Internal Reviews Process that measures current revenues, interest rates, expenditures, and needs. Formal monthly reports to the BOE assure that any budgetary amendments are addressed in a timely and effective manner. Through these processes, the District is on track for meeting and maintaining its 6% fund balance goal. (Figures 7.3-1 and 7.3-2)
Fund Balances 0% 2% 4% 6% 8% 2001 2002 2003 2004 2005
Figure 7.3-1 On Track for Achieving the 6% Fund Balance (Target: Maintain 6% fund balance )
Revenue/Expenditures 34,000,000 36,000,000 38,000,000 40,000,000 42,000,000 44,000,000 46,000,000 48,000,000 2000 2001 2002 2003 2004 Revenue Expenditures
Figure 7.3-2 Revenues keep ahead of expenditures.
Good
Through the in-depth Budgetary Planning Process the District has been able to maintain a high level in per pupil
expenditures in comparison with two other districts in the area (Figure 7.3-3) and consistently designate 82-83% of its operating budget for instruction and instructional support. (Figure 7.3-4) This compares to the 79% spent on instruction and instructional support by a Baldrige recipient.
Per Pupil Expenditure
$4,000 $4,200 $4,400 $4,600 $4,800 $5,000 $5,200 2001 2002 2003 2004 2005 Jenks District 1 District 2
Figure 7.3-3 The Focus on Instruction: Per pupil expenditures continue to grow.
Percentage of Operating Budget
78% 77% 77% 5% 5% 6% 0% 20% 40% 60% 80% 100% 2002-2003 2003-2004 2004-2005 Instructional Instructional Support
Figure 7.3-4 % of the Operating Budget Designated for Instruction and Instructional Support
Fiscal stability has also been maintained because of a steady growth in local ad valorem assessed valuation due to strong residential and commercial development within the District. This growth continues to offset the decline in funding from the state. (Figures 7.3-5 and 7.3-6)
Property Valuation $340.00 $360.00 $380.00 $400.00 $420.00 $440.00 $460.00 $480.00 2000-2001 2001-2002 2002-2003 2003-2004 2004-2005
Assessed Valuation, Millions of Dollars
Figure 7.3-5 Ad valorem assessed valuation continues to grow. Funding Sources 0% 10% 20% 30% 40% 50% 60% 2000-2001 2001-2002 2002-2003 2003-2004 % of the Total Budget State Local Federal
Figure 7.3-6 Local funding increases to maintain financial stability.
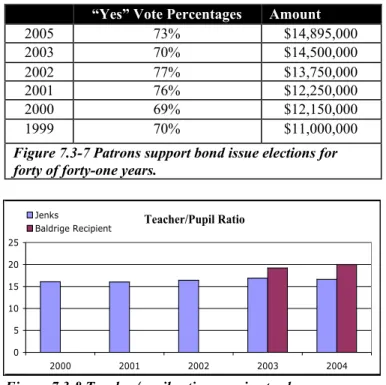
Forty years of successful bond issue elections are part of the JPS tradition of excellence. Bond monies have supported the District in building and maintaining “state of the art” facilities and resources. (Figure 7.3-7) Bond monies have also enabled the District to contain costs in the general fund. One cost containment in the general fund was established during the 1999-2000 school year with the movement of the $500,000 textbook allotment from the general fund to the bond fund. This enabled the district to use general fund monies to add 14 teachers to reduce class size figures. (Figure 7.3-8) In subsequent years that cost removal has allowed the District to retain those classroom positions. Because of a formal 5-year cycle for adding and retiring debt incurred through bond elections the District is able to maintain a stable tax rate for its patrons.
“Yes” Vote Percentages Amount
2005 73% $14,895,000 2003 70% $14,500,000 2002 77% $13,750,000 2001 76% $12,250,000 2000 69% $12,150,000 1999 70% $11,000,000
Figure 7.3-7 Patrons support bond issue elections for forty of forty-one years.
Teacher/Pupil Ratio 0 5 10 15 20 25 2000 2001 2002 2003 2004 Jenks Baldrige Recipient
Figure 7.3-8 Teacher/pupil ratios remain steady.
Good
Another cost containment has been realized through the movement of the district’s utilities costs from the general fund to the building fund, an annual savings of approximately $1.3 million in the general fund over the past six years that can be designated for instruction. In 1997 the district established a goal of decreasing sewer discharges, and water, electricity, and natural gas consumption, freeing money ($2,770,926) in the building fund for adding/ maintaining “state of the art” resources to support high academic achievement.
(Figure 7.3-9)
2001 $726,679 2002 $521,915 2003 $744,385 2004 $777,947
Figure 7.3-9 Energy cost avoidance increases funds for instructional support.
Lobbying practices focus on key legislative goals and they are ongoing. The Superintendent lobbies legislators each month during the area superintendents’ meetings and each
Wednesday from February to June during the legislative session. The District sponsors twice yearly legislative lobbying events, a breakfast and a luncheon. Over 70 stakeholders participate in the luncheon meeting, and BOE members and administrators attend the breakfast.
7.3a(2) There are 35 private/nonprofit schools in the Tulsa area, and three of the private schools are within the JPS attendance area. The District’s market share is approximately 80% of the students living in the district.
7.4 Faculty and Staff Results
7.4a(1) Teamwork is the key to effective work system performance in the District. Teamwork builds a systems focus (increasing collaboration and communication within and across work groups), develops strong quality leaders, and promotes data-based decision making and use of the PDSA continuous improvement process. Examples of teamwork can be found throughout the school District at all levels. (Figure 5.1-1)
Workplace health is monitored through workers’ compensation claims. (Figure 7.4-1) The experience modification factor for schools in Oklahoma is 1.00. When compared to this factor, the Jenks experience factor is .89 demonstrating that our systematic training and supervision programs have been successful.
Since 1990 the District has focused on ergonomics through the work of the purchasing warehouse manager. She evaluates classroom and office set-up arrangements to address
ergonomic needs for all new construction and renovation projects in the District. Each year she provides additional consultation to 15-20 individual staff members to address equipment and building design modifications that improve health and safety.
All staff are trained in Universal Precautions and staff segments (paraprofessionals, playground assistants, health services professionals, special education teachers, custodians, bus drivers transporting special education students, athletic trainers) receive training in handling blood-born pathogens. Key personnel at each school site and within the District are also certified in cardiovascular pulmonary resuscitation (CPR).
Indoor air quality is monitored by school site staff trained in using the EPA’s air quality tools. For the past five years, air and water quality levels have been in the acceptable range. The Asbestos Management Plan is current with a three-year re-inspection completed in 2004. No injuries due to hazardous waste and chemical mismanagement have occurred as a result of school/work procedures in place for the past seven years. To support workplace safety (addressing the strategic challenge of ensuring safety), video camera systems are installed and operational at all school sites (an action plan accomplishment in the Goal: Focus on Safety). The Campus Police have also increased their visibility and customer focus since the change in supervision and the hiring of the new police chief. In a 2004-2005 survey of school site principals, respondents indicated that they have noticed a significant increase in Campus Police visibility and accessibility. Key staff are trained in OSHA regulations. Twice yearly school site drills (fire, tornado, hazardous materials evacuation) and annual SERT training experiences increase emergency preparedness. Because of this training district personnel have resolved recent safety incidents with no loss of life. Key personnel at each school site have two-way radios to improve communication and coordination in the case of an emergency. All classrooms and offices have telephone and email/Internet access and all JPS personnel wear identity badges. All visitors to a school site register in the office and wear visitors’ badges.
Number/ Percentage 2002-03 2003-04 2004-05 YTD Number of Staff 1,178 1,167 1,183 Percentage of Staff
Who Had Accidents 4.24% 4.02% 1.52%
Total # of claims 50 47 18
Claims with Lost
Time 9 13 1
Figure 7.4-1 Training and supervision results in lowered worker compensation claims.
7.4a(2) The District has a highly qualified workforce, a principal factor of success in the tradition of excellence. Over 98% of certified staff have been designated as “highly qualified” according to the mandates of NCLB. Forty-two percent of the certified employees hold master’s degrees and two percent have graduated with doctoral degrees. Twelve teachers are certified via National Board Certification. Most recently, a JPS teacher was honored with the Milken Educator Award and a $25,000 stipend in recognition of her
During the past ten years, two JPS teachers were selected as state Teachers of the Year and achieved the final four level for National Teacher of the Year. Both of these same teachers received the Presidential Award for Excellence in Mathematics and Science Teaching. Four JPS coaches have been selected as the National Coach of the Year by their respective associations.
Two plans of improvement were issued in the past two years. One resulted in the resignation of the employee, and in the other the teacher demonstrated professional growth and completed the plan of improvement.
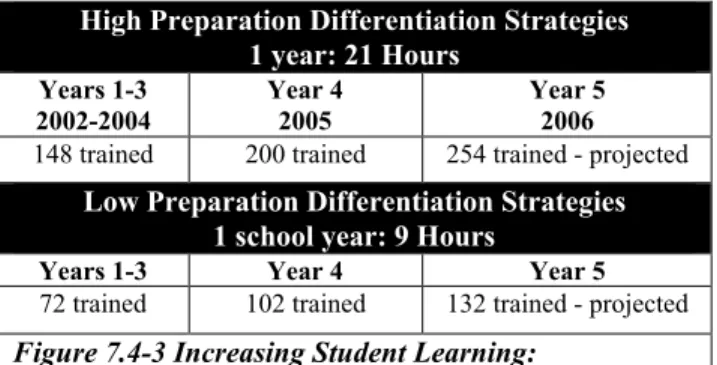
Per state mandates, certified personnel are required to earn 75 continuing education points during a 5-year certification cycle with a minimum recommendation of 15 points per year. District staff are committed to learning and growth and earn many more points than the minimum recommendation. (Figure 7.4-3)
School Year
Average Number of Professional Development Points Earned by
Certified Personnel 1999-2000 42.6 2000-2001 44.2 2001-2002 42.7 2002-2003 40.8 2003-2004 43.5
Figure 7.4-2 Certified personnel show a commitment to professional growth.
Sustained, intensive, classroom focused professional
development training is an action plan step in the Goal: Focus on the Curriculum. The District is a leader in providing training that builds the capacity for supporting academic excellence for all students. Examples include the following:
The Differentiated Classroom based on the work of Dr. Carol Ann Tomlinson. (Figure 7.4-3)
High Preparation Differentiation Strategies 1 year: 21 Hours Years 1-3 2002-2004 Year 4 2005 Year 5 2006
148 trained 200 trained 254 trained - projected
Low Preparation Differentiation Strategies 1 school year: 9 Hours
Years 1-3 Year 4 Year 5
72 trained 102 trained 132 trained - projected
Figure 7.4-3 Increasing Student Learning:
Administrators/Teachers Trained in Differentiation Strategies
The JPS Writing Project: Writing Takes Flight, an annual 18 hour summer workshop: Eighty-seven teachers have participated in the workshop over the past four summers. Mathematics Problem Solving annual workshops: (Figure 7.4-4)
L to J Essential Elements annual workshops presented by Dr. Lee Jenkins: Almost 100% of certified staff trained.
Technology Integration annual workshops: JPS educators have used 388 Eighth Floor coupon hours so far in 2004-2005, an increase from the 2003-2004 school year. Additionally, the District offered a January Technology Day in 2004; 25 classes were offered and approximately 200 educators participated in the training opportunities. School site CLEP goals also target technology integration training.
Family Outreach, Multicultural Awareness, and AIDS Training: 100% of staff are trained within each 4-year school improvement cycle per state mandates.
TRIBES Program: 95% of elementary, middle school and alternative school teachers have been trained.
New Teacher Orientation, annual six-hour workshop: All new teachers participate and give the introduction to district services and policies high marks. Each year presenters analyze the feedback ratings and comments to refine presentation content and methods for the subsequent year. (Scale, 5 = very effective) (Figure 7.4-5)
2001 2002 2003 2004 Curriculum 4.4 4.0 3.6 3.9 Special Education Services 3.9 3.9 3.6 3.6 Professional Development 4.4 4.1 4.5 4.1 Finance 3.9 4.0 3.6 3.9
Print Shop Services 4.1 3.6 3.9 4.0
Continuous
Improvement Model 4.6 4.3 4.5 4.4
Figure 7.4-5 New teacher training survey results.
Annual Substitute Teacher Training: 100% of applicants for substitute teaching assignments participate in a formal training process developed by the Human Resources Department. This process ensures that substitutes are knowledgeable about responsibilities, emergency procedures, legal information regarding confidentiality, religion in schools, sexual harassment and bullying, and classroom management and discipline.
Year Mathematics Consultant/Trainer Hours of Training Teachers Trained
1997-1999 Dr. Grayson Wheatley 6 hours each year 216
1999-2000 Brian Tash 9 hours 285
2001 District MathematicsLeaders 6 hours 12
2002-2003 Dr. Susan DeMoss 9 hours each year 76 2004 EverydayMathematics 12 hours 175
Figure 7.4-4 Increasing Student Learning: Teachers Trained in Mathematics Skills and Concepts.
7.4a(3) The District has an excellent reputation; therefore, faculty turnover is low. (Figure 7.4-6) Turnover rates for classified staff have experienced an upturn for the past two years caused by a reduction in work-week hours and elimination of over-time (cost containment strategies during 2002-2003 and 2003-2004). (Figure 7.4-7)
2000 2001 2002 2003 2004
JPS 15% 5% 5% 11% 6%
Baldrige Recipient 13% 11% 13.6%
National 20% 20% 20% 20% 20%
Figure 7.4-6 Certified staff turnover rates are low.
2000 91%
2001 84%
2002 93%
2003 82%
2004 85%
Figure 7.4-7 Classified Staff Retention Percentages An Exit Questionnaire Process was implemented in 2003; the questionnaire is given to all staff leaving the district i.e., retirement, mobility, other jobs. Analysis of the results confirms that JPS is a great place to work. (Figure 7.4-8)
Certified Staff Classified Staff
+ - +
-2003 21 1 19 1
2004 22 0 5 2
Figure 7.4-8 Exit questionnaires show employee satisfaction (+).
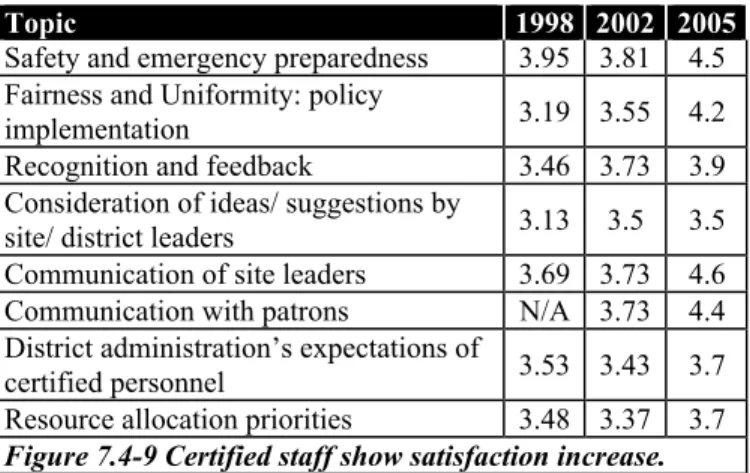
Certified staff and classified survey results show positive levels of satisfaction (rating scale of 1-5 with 3.5+ considered a positive or favorable rating). (Figures 7.4-9 and 7.4-10)
Dimension 1998 2002 2005
Recognition 3.25 3.65 3.88
Enthusiasm for work 3.64 3.86 4.62
Consideration of ideas/contributions 3.32 3.57 3.75
Leadership 3.37 3.83 4.08
Figure 7.4-10 Classified staff show satisfaction increase.
Cycle refinements were initiated to address specific areas within each domain on the certified staff survey.
(Figure 7.4-11) The PDSA Process has been used to address specific needs on the classified staff survey.
Safety SERT establishedSafe School committees established at each school site
Policy
Implementation
Board Policy Review Process established Teacher/student Handbooks Review Process established
Recognition and Feedback
Performance Appraisal Review Process refined through PDSA cycle
Vision of Excellence awards program begun
Consideration of ideas
Teacher representation on committees, during facility design/ remodeling, leadership teams enhanced
Communication
with patrons District Web page updated and enhancedInstallation of Edline
Resource
Allocation Select Committee for the Study of SchoolFinance implemented
Figure 7.4-11 1998-2004 cycle refinements increase employee satisfaction.
Staff and student recognition is the first agenda item at all BOE meetings throughout the year with a time to honor staff and students for their leadership in achieving academic, community service, and athletic excellence. The VOE award program (funded by the JPSF) also recognizes outstanding JPS educators and classified employees each year. (Figure 7.4-12)
The annual negotiations process results in a negotiated contract mutually beneficial to certified personnel and to the district. The JCTA and a team of administrators meet each summer to develop the contract agreement. Association issues are developed from surveys of certified personnel. Teachers have consistently ratified the negotiated contract. Throughout the year monthly meetings of JCTA representatives and district administrators provide formal opportunities for ongoing communication before issues rise to the grievance level. Because of this systematic communications process, only one grievance has been filed in the past five years. This grievance was resolved using the District’s Grievance Procedures and a compromise was reached with the teacher. 7.5 Organizational Effectiveness Results
7.5a(1) As does the curriculum mapping completed by the Pearl River District, the JPS Curricula Continua defines the standards and objectives for the district. The Continua has been 100% deployed at the elementary/intermediate schools since 1998; by 2005 it will be deployed to all secondary
Topic 1998 2002 2005
Safety and emergency preparedness 3.95 3.81 4.5 Fairness and Uniformity: policy
implementation 3.19 3.55 4.2
Recognition and feedback 3.46 3.73 3.9
Consideration of ideas/ suggestions by
site/ district leaders 3.13 3.5 3.5
Communication of site leaders 3.69 3.73 4.6 Communication with patrons N/A 3.73 4.4 District administration’s expectations of
certified personnel 3.53 3.43 3.7
Resource allocation priorities 3.48 3.37 3.7 Figure 7.4-9 Certified staff show satisfaction increase.
Certified Classified 2000-2001 10 4 2001-2002 10 6 2002-2003 11 5 2003-2004 12 4 2004-2005 10 6
administrators and mathematics and language arts teachers. The District uses it to define a rigorous curriculum and assure equal access to knowledge and skills for all students;
principals use it in the Performance Appraisal Review Process; teachers use it to design and implement units of study; the JPSF uses it to judge how well mini-grant resource requests support the standards and objectives.
The Curriculum Development Process adheres to a formal six-year review cycle (action plan step in the Goal: Focus on the Curriculum) which ensures the standards, objectives, primary program resources, and teaching and assessment practices are current with research and educational needs. (Figure 7.5-1)
2003-2004 Mathematics 2004-2005 Language Arts 2005-2006 Science
2006-2007 Social Studies, Art, Music 2007-2008 Reading
2008-2009 World Languages, Health, Safety, PhysicalEducation Figure 7.5-1 Curriculum development review cycle demonstrates a systematic process for keeping current with research and national standards.
The focus on implementation training levels for instruction have proven results in academic performance for students because they build teacher effectiveness in using the resources of the primary tools, integrating researched-based
instructional practices, and differentiating instruction to meet the needs of diverse learners. (Figure 7.5-2)
Level 4 Training:
Deepening Differentiation Skills
Level 3 Training:
Developing Assessment Strategies
Level 2 Training:
Deepening Research-Based Practices
Level 1 Training:
Introduction to New Resources
Adopt Programs
Figure 7.5-2 The focus on instruction implementation time-line demonstrates a systematic process for building excellence in meeting diverse learner needs.
The focus on instruction has made the JPS special education program a role model in delivering services to children with special needs. Currently, 15.5% of students in JPS (compared to 14% statewide and 12% nationally) receive special education services an increase of almost 6 points since 1995. (Figure 7.5-3) Over the past five years, many of these students have come from other districts; there were 26 transfers into the District for special education services in 2004-2005.
% of Student Enrollment Serving Children with Special Needs 0% 5% 10% 15% 20% 1995 2000 2001 2002 2003 2004 Figure 7.5-3 The District continues to be a role model in serving children with special needs.
Each year over 300 special education students are directly served through the assistive technology office via assistive/ adaptive computer setups enabling them to succeed in least restrictive environments. An additional 1,000 students are served via instructional equipment i.e., other adaptive devices, instructional software.
The Special Education Department also tracks phone call inquiries about the program; to date (2004-2005), 27 calls have been charted. A similar number were tracked during 2003-2004.
The award winning Community Education Program also contributes to the District’s tradition of excellence in the many services and programs it sponsors. (Figure 7.5-4)
Although many school districts in Oklahoma have eliminated their Parents as Teachers Programs because of recent budget cuts (155 programs throughout the state to just 55), the JPS Parents as Teachers program is another example of the District’s commitment to academic excellence focusing on families in the community who have children under the age of three. Home visits are the primary activity of the program, building the capacity for parents to nurture and prepare children for educational success. (Figure 7.5-5) The “Stay and Play” experiences (offered daily throughout the school year and periodically in the evenings and on Saturdays) are another component of the program receiving a positive response from families. Participation rates average 10 families per session.
Families/Children Served Program
2003 2004 2005
Parent Care Center 81 127 68
Early Learning Center 55 50 50
3-year old Program 85 85 105
7th-12th Summer School 352 415 June
K-6th Summer School 145 138 June
Before & After Care 469 438 492
Adventure Club 131 125 125
After School Tutoring 142 154 89 (YTD)
Reading Academy 12 26 June
Early Back Academy 366 375 June
Figure 7.5-4 Community Education programs meet stakeholder needs.
Parents as Teachers Program: # of Children Served 175 180 185 190 195 200 205 2001 2002 2003 2004
Figure 7.5-5 Parents As Teachers Home Visits: A Proven Success
Innovations in the learning-centered process of assessment include The Essential Elements Process, pre-kindergarten and kindergarten data folders, and the Retention Review Process. The Essential Elements Process addresses the strategic challenge of striving for world class learning and an action plan step in the Goal: Focus on Curriculum. This process is deployed throughout the system in mathematics and gives teachers and administrators weekly assessment data on students’ mathematics proficiency levels. After two months, it has become a vital component in assessing students’ readiness for standardized testing success. Algebra I essential elements data show growing levels of achievement with review test items. Lower totals are a reflection of more preview than review items on a particular quiz. (Figures 7.5-6 and 7.5-7)
Algebra I Essential Elements Quiz Results Aggregated Data: 30 classrooms
0 1000 2000 3000 4000 5000 6000 7000
Quiz 1 Quiz 2 Quiz 3 Quiz 4 Quiz 5 Quiz 6
Number Correct
Figure 7.5-6 Tracking Growth: Algebra I Essential Elements
3rd Grade Mathematics Essential Elements Quiz Results: Aggregated Data 30 Classrooms
0 400 800 1200 1600 2000 2400 2800 3200 3600 4000 4400 4800
Quiz 1 Quiz 2 Quiz 3 Quiz 4 Quiz 5 Quiz 6
Number Correct
Figure 7.5-7 Tracking Growth: Third Grade Mathematics Essential Element
Since the 2002-2003 school year, all pre-kindergarten and kindergarten teachers have maintained data folders for each child, giving them and families a comprehensive assessment record of growth in all curriculum areas and in the
development of social skills. Each year pre-kindergarten and kindergarten teachers participate in a cycle refinement process to continually make improvements in the data folders and assessment gathering processes. A cycle refinement for 2005-2006 will be that kindergarten data folders follow the students to first grade for the first quarter.
After an extensive review of research on student retention showed that retaining students actually contributes to greater academic failure, higher levels of dropping out, and greater behavioral difficulties, the District developed a Retention Review Process and set a retention reduction goal during the 1999-2000 school year. The District is making progress toward that goal at some grade levels. (Figure 7.5-8)
Retention Data 0.00% 1.00% 2.00% 3.00% 4.00% 5.00% 6.00% 7.00% 2000 2001 2002 2003 2004
Percentage of the Students at a
Grade Level Kindergarten 1st 2nd 3rd 4th 5th 6th
Figure 7.5-8 Reducing retentions builds success for staying in school.
School Climate results continue to sustain the JPS tradition of excellence.
Educational opportunities for JPS students extend beyond school walls. A class Eagle Project was selected for display in the National Archives Building in Washington, D. C. An elementary student became a Crayola Dream-Maker National Art Exhibition winner and the Middle School Mathcounts Team won the state championship for the sixth consecutive year. Five high school students received awards from the National Scholastics Award Committee in New York City (selected from more than 200,000 entries). The Future Farmers of America Club was ranked in the top 1% in the nation and the JPS Key Club was ranked second of more than 300 chapters in Texas and Oklahoma. The High School Odyssey of the Mind team won world in 2003-2004 and the Yearbook was selected as a “Gold Medalist” by Columbia Press Association from Columbia University.
Teacher support has expanded through the work of the JPSF. Since 1987, the JPSF has provided over $1,100,000 for the direct benefit of Jenks educators and their students. (Figure 7.5-9) The largest use of funds has been grants to teachers for classroom projects. Over the past 18 years, the Foundation has built an endowment fund of almost $860,000 tapping into a broad base of support of parents, businesses, educators, and friends of the JPS school system.
JPSF Grants to the District $20,000 $30,000 $40,000 $50,000 $60,000 $70,000 $80,000 1999-2000 2000-2001 2001-2002 2002-2003 2003-2004 Figure 7.5-9 JPSF supports the district.
A unique project led by a JPS partnership between the East Elementary Dynamic Dads volunteer group and school administrators is the revitalization of Rentie Grove, a section of wooded land between two JPS school sites. Countless hours of volunteerism and contributions from community organizations and businesses have transformed the property into an accessible outdoor museum and a walking trail for families. Twenty markers provide information about the trees and plants on the more than 2,850 feet of asphalt trail. The area offers something for everyone with students discovering leaves, high school students studying the environment, and families enjoying the fresh air and foliage on walks in the evenings and on weekends.
To enhance communications with families, over 90% of elementary teachers prepare monthly newsletters, and over 40% have Web pages, while middle school and secondary teachers complete ongoing updates of the information available to families via Edline. In 2002-2003 the District Web page was honored with a Golden Web Award from the International Association of Web Masters and Designers. The award is based on content, interest, structure, ease of navigation, and interactivity.
A sampling of performance results in CLEP school climate goals are listed in Figure 7.5-10.
Elementary/ Intermediate
95% of teachers are trained in TRIBES Great Books program expands to serve 162 students (up from 150 in 2002-2003).
90% of teachers send home monthly newsletters
Ten @ Ten expanded to include more invitations
100% of students maintain daily agendas
Additional character lessons on “anti-bullying” integrated into 1998 Character Habits Program Secondary (Middle School, Freshman Academy, High School, Alternative Center)
Camera security systems installed and operational
100% of families notified of weekly updates on Edline
100% student participation in AIDS awareness, Crash Court, Making High School Count programs
Figure 7.5-10 School sites meet CLEP school climate goals.
7.5a(2) Effectiveness and efficiency of key support processes is also evident when examining several measures.
Examples of cycle time reductions can be found throughout the departments. (Figure 7.5-11)
With the PDSA Process productivity improvements are constant.
The Maintenance Department uses TMA to track purchasing, job costs, labor, preventive maintenance requests, and personnel performance. Productivity has been improved, enabling the department to prioritize the requests and assign personnel more efficiently. Customers can monitor the status of a work order at anytime by accessing the online system. The TMA system also brings more accountability and improvement to personnel performance.
Energy conservation (water, electricity, natural gas consumption, sewer discharges) and paper recycling have been priorities of the district since 1997. In reviewing 2000-2004 data, JPS has reduced water consumption by 10, 163,000 gallons, electricity consumption by 984,852 kilowatt hours, natural gas use by 99,648 decatherms, and sewer discharges by 6,319 kilograms, resulting in a $2,770,926 cost avoidance. In 2003-2004 over 90 tons of paper were recycled, a 1,038.9% increase since 1999-2000. (Figure 7.5-12)
Process From To
Purchase Order Processing 3-4 days 1 day (2004) Remote Desktop Assistance 1-3 days Online
(2000) Financial Applications Upgrade to Microsoft.Net (Information Access) 1-2 days 5 seconds (2005) Warehouse Ordering 5-7 days Online(2003) Turnaround on Print Shop
Orders 5-7 days
3-4 days (2002) Scanning Student IDs in the
Lunch Line
20-25 seconds
1-3 seconds (2004) Campus Police Response
Time
10-20 minutes
1-5 minutes (2004) Teacher Candidate Resumes 1-3 days Online (2004) JPSF Mini-grant Applications 1-3 days Online (2002) Professional Development
Transcripts for Each Teacher Once a year
Online (2004) Figure 7.5-11 Departments show cycle time reductions for increased efficiency.
Recycled Paper Tonnage 0 20 40 60 80 100 2000 2001 2002 2003 2004 Tonnage
Figure 7.5-12 JPS Conserves Resources: Growth in Tonnage of Recycled Paper
The E-APECS inventory process provides ongoing and more accurate data on capital assets and rates of depreciation. A contract with an outside agency established the baseline data and JPS employees are able to complete annual updates of equipment, furniture and fixtures in a timely manner. For the year ending June 30, 2004, capital assets were $74,262,635. The E-APECS software also tracks receipts, inventory and issues of about 1500 different teaching/classroom/office supplies, print shop forms, and ink/toner cartridges used throughout the District. The data assist the Print Shop/ Warehouse Services Department in determining how much of any one product has been used during the month and annually and how much is currently on hand.
During 2004-2005 the IT Department greatly improved network speed and reliability. (Figure 7.5-13)
Site to Site Access (Internal) Internet Access (External) Prior to 2004 T-1 Access (1.4 MB) 3 DSL Lines (1MB, 300k Upload) 2005 Fiber (100 MB) DS3 Line (10 MB, 2-way traffic) Figure 7.5-13 Network speed and reliability soars. The District maintains a ratio of at least one computer for every three students in the district. Continuing cycle refinements are listed in Figure 7.5-14.
2005 Community Education Store online Online Gradebook for 9th-12th grades 2006 Online Gradebook for 7th-8th grades 2007 Palm Pilots for all teachers
Figure 7.5-14 The Information Technology Department continues to set improvement targets. The Job Log Process in the IT Department has increased communication within the department and with stakeholders and helps in setting priorities, thus improving service turnaround time. Cross training has produced technical assistants who are knowledgeable about and able to troubleshoot each school site’s network and computer systems. Cost containment is a priority of the department when considering upgrades. The decision to move financial
applications to Microsoft.Net rather than upgrade the mainframe computer saved the district approximately
$475,000. Other productivity highlights for the IT Department include the following: never missed a payroll or been late; never lost data; experienced only one day of downtime with the mainframe computer since 1980.
E-APECS inventory control and computerized tracking of turnaround time in the lunch line have produced
improvements in Child Nutrition Department services. Inventory control based on consumption patterns reported in E-APECS is more accurate (Figure 7.5-15), and turnaround time in lunch lines (# of students per minute getting through the line) has improved.
Before E-APECS With E-APECS
Chicken Tenders 50-100 cases overage a month ($1750-$3000) 1-2 cases overage a month ($35-$70) Peaches 25-50 cases overage a month ($500-1000) 1-2 cases overage a month ($20-$40) Figure 7.5-15 E-APECS inventory control makes a difference in the Child Nutrition Department costs. Since 1999-2000, the Transportation Department has made significant progress in reaching its goal to reduce bus accidents to zero per year. (Figure 7.5-16) This is being accomplished through in-service training, heightened awareness of safety prevention, and recording of data. The District operates 59 buses daily and transports approximately 51% of the total student enrollment to and from school.
Year JPS Number of Accidents Baldrige Recipient Comparison 1999-2000 10 30 2000-2001 9 26 2001-2002 7 26 2002-2003 4 14 2003-2004 8 N/A 2004-2005 YTD: 1 N/A
Figure 7.5-16 Transportation Department reduces bus accidents through training and increased awareness. For many years, the Transportation Department has been able to follow a yearly cycle for retiring old buses and purchasing new buses because of the systematic review of bus
maintenance and repair needs, completion of daily pre-trip inspection forms by each bus driver, and continuing high support of bond issue referendums by patrons, The average age of the buses in the department is 6.25 years.
In the early 90s the Warehouse Department began pursuing competitive bidding and pricing, resulting in a continued focus on high quality but at 20%-50% cost reductions. The Warehouse Department has also benefited from the
continuing high support of bond issue referendums by patrons and has established a regular cycle for replacing copiers in the District. The current model reflects the newest technology,
enabling employees to copy, print from a computer, fax, and scan documents. By the 2007 school year, all copiers in the district will be replaced with this model.
In 2002, the District went online with paperwork associated with the monthly BOE meetings. This has reduced paper costs (a minimum of 18 reams of paper per year) and countless hours of copy time as well as smoothed the development of the monthly BOE packets. Accessibility to the BOE agenda and the minutes of the meetings have been enhanced. 7.6 Leadership and Social Responsibility Results 7.6a(1) Organizational Strategy and Action Plans Results are as follows. (Figure 7.6-1)
School Funding
2004-2005 Bond issue passed by 73% majority
Ad valorem assessed valuation continues to grow (Figure 7. 3-5) Energy conservation shows strong increase
JPS demonstrates compliance in the auditor’s report
Class Sizes District continuing to focus on decreasing class sizes (Figure 7.3-8) Demographics
Shift
DLP is fully implemented in kindergarten
DLP is on track for implementation in 1st grade
Safety
Bus accidents are at an all time low (Figure 7.5-15)
Video security systems are installed and operational at all school sites
Academic Performance
API score is at the top of K-12 schools in Oklahoma
Thirty-three of 38 AP courses are offered in JPS
AP enrollment shows a steady rise 90% Reading and math goals show growth
Drop-out rate remains low
CAPS conference participations has remained steady at 95% of families Year 4 differentiation training continues to expand # trained (Figure 7.4-3) Over 98% of teachers are rated highly qualified
Curriculum Development Process on target for science for 2005-2006 Figure 7.6-1 Action plan accomplishments result in increased stability and improved student learning. 7.6a (2) Ethical Behavior and Stakeholder Trust Senior leaders foster an environment that requires legal and ethical behavior. All teachers receive The Standards of Performance and Conduct for Teachers on an annual basis. Additionally, all staff (certified and classified) complete the
annual criminal record questionnaire. All new staff receive a copy of the Expected Attributes for JPS employees.
Fortunately, there are few incidents of illegal and/or unethical activity in the district.
Teacher and student handbooks are deployed across the District. All certified staff and all families sign handbook agreements, acknowledging that they have read the handbooks and agree to abide by their rules and guidelines. Additionally, all JPS students agree to and sign acceptable use agreements relating to Internet/computer usage. A cutting-edge firewall protects students and employees from inappropriate Web sites and E-mail communications. Behavior infraction incidents (damage to school, incidents of bullying and fighting) and bus conduct incidents reflect a small portion of the student population. Incidents of fighting and damage to school property are declining. Bullying incidents have not declined and bus incidents have risen slightly due to increased reporting and no-tolerance expectations. (Figures 7.6-2 and 7.6-3)
Behavior Infractions 0.00% 0.01% 0.01% 0.02% 0.02% 0.03% 0.03% 0.04% 0.04% 0.05% 2001 2002 2003 2004 % of Student Enrollment Fighting Incidents Bullying Incidents Damage to School Incidents
Figure 7.6-2 Character education training helps keep behavior infractions at a low rate.
Bus Incidents 0.00% 0.02% 0.04% 0.06% 0.08% 0.10% 2001 2002 2003 2004 % of Bus Riders
Figure 7.6-3 Bus conduct incidents increased due to increased reporting and no-tolerance expectations.
Test security protocols for state tests have been established by the Student Assessment Department and are reviewed yearly for continuous improvement. Training is also provided annually for administrators and school site test coordinators. Two adults (the classroom teacher and another JPS employee or parent volunteer) monitor classroom protocols during testing weeks. There have been no test protocol violations in the District.
Stakeholders demonstrate trust in the five-member BOE. The average time spent as an elected BOE member for JPS over the past 20 years is 7.8 years with most members consistently reelected.
7.6a(3) Fiscal Accountability
The District uses an external, independent auditing firm to ensure fiscal accountability. The auditor’s report consistently finds JPS in compliance with the accounting practices prescribed by the Oklahoma SDE and budget laws of the State of Oklahoma (Title 709-22-109).
The Finance Department completes an annual in-depth budgetary plan for approval by the BOE by July 1 each year. This projected revenue and expenditure budget is published in the local newspaper and on the District Web page. (Figures 7.3-2, 7.3-3 and 7.3-4)
The executive director of finance and director of accounting conduct monthly internal reviews and reports to the BOE; budget adjustments are made depending on the state of the economy. Periodic compliance reviews of internal controls and adherence to policies and procedures catch irregularities and breaches in BOE policies; procedures are in place to correct the irregularities to prevent future such occurrences. The district is on-target for reaching its 6% fund goal for 2004-2005 and maintaining the percentage in 2005-2006. Capital assets for the year ending June 30, 2004 are $74,262,635. (Figure 7.3-1)
7.6a(4) Regulatory Compliance
The IT Department demonstrates a consistent record of compliance with state requirements. As of Summer 2005, the department will be SIF compliant.
The Asbestos Management Plan is current with a three-year re-inspection completed in 2004.
Air and water quality levels fell within the acceptable range five years in a row in school buildings.
The Tulsa City/County Health Department inspects school cafeterias four times a year, and ratings are consistently good to excellent. The inspection report rates food handling procedures and identifies items that are in need of
improvement, rating the needs as critical or non-critical. The Child Nutrition Department consistently scores well in this area also.
JPS school buses meet federal and state school bus
compliance regulations. Bus safety inspections are completed annually or every 12,000 miles.
The Transportation Department also meets all federal and state mandates regarding employee drug testing, licensing, and physical examinations. A driver’s handbook contains all employee behavior expectations and requirements. Safety
meetings are held monthly. On an annual basis, families and students are provided safety information through the student handbooks at each school site.
Emergency plans are audited by the local police department and rated in full compliance. Fire safety inspections by fire department inspectors demonstrate compliance.
A tradition of excellence is demonstrated in the annual comprehensive accreditation review of the district. The District received no deficiencies during the past eight out of nine years.
The District demonstrates excellence in the
comprehensiveness of its CLEP plan and compliance in meeting the report deadlines to the state each year. One hundred percent of certified staff have the required certifications for teaching/working in the district.
To keep abreast of changes in the law affecting education, Cabinet members and directors attend the annual legislative update in Oklahoma City.
7.6a(5) Organizational Citizenship
Nine of fourteen school sites/departments have consistently demonstrated 100% participation in the annual United Way drive. The goal is 100% participation from all sites and departments.
The nationally acclaimed intergenerational program (Education Week, CNN news, People) is a partnership between Grace Living Center and JPS. Over 25 “Grandma and Grandpa” residents interact daily with the pre-kindergarten and pre-kindergarten students. Since the program began in August 1999, it has hosted over 50 groups of visitors wanting to learn more about this unique partnership.
The Oklahoma Aquarium (opening its doors in May 2003) is a recent partnership with the school District. Over 30 JPS life/environmental science teachers participated in training workshops during 2003-04 and have integrated the resources of the Aquarium into their classrooms.
Another successful partnership has taken place between JPS and Union Public Schools, a neighboring school district. The two districts have worked together since 1997 to host conference experiences for young students and their families i.e., Writer’s Conference, Science Conference, Math Conference. Each year over five hundred students and their families attend the Saturday morning conference.
Service learning by students is a key part of preparing all learners for productive, responsible citizenship in an ever-changing world. Each year students are involved in many projects to help the community. A sampling of projects from the 2004-05 school year can be seen in Figure 7.6-4.
Key Club volunteers continue to contribute countless hours of service to the District in a wide variety of ways i.e., student mentoring and tutoring, providing support during special projects (Jenks/Union conferences), sponsorship of Relay for Life. (Figure 7.6-5) The JPS chapter has consistently ranked as the top chapter in the Oklahoma/ Texas district and garnered many awards: outstanding newsletter, outstanding Web page, volunteer of the year, early bird recognition (dues).
Year # of Active Members # of Volunteer Hours 2002 150 6,314 2003 200 7,548 2004 250 9,730 2005 246 4,182 YTD
Figure 7.6-5 Key Club continues its tradition of excellence in volunteer hours.
The District’s buildings are available to the community for after school, evening, and weekend use, and BOE Policy 1.13 outlines comprehensive procedures for facility rental and usage. During 2003-2004, 664 organizations and/or groups completed facility rental forms. This includes approximately 395 courses, classes or programs offered by Community Education. Other activities include Boy/Girl Scout
organizations, college classes, youth and adult sports groups, PTAG, musical groups, church and religious groups, pageants, civic groups, and other governmental agencies. The JPS tradition of excellence results in a world where high achievement, an outstanding athletics program, and
multitudinous opportunities for involvement in extracurricular activities abound! It is a world in which high test scores and national awards are the norm rather than the exception, and yet never taken for granted.
High School
Community Food Bank fund raising Trojans for Troops
Families in Need Toys for Tots
Relay for Life (raising over $30,000) Project Angel Tree support
Middle School
Jenks Community Food Bank (over 2000 cans of food collected
Supporting Our Troops (over 75 boxes of supplies sent overseas)
Elementary/ Intermediate Schools
Jenks Community Food Bank (over 5,295 cans collected and a matching donation from a local grocer) Game of Giving: Holiday Needs Dynamic Dads Winter Coats Project La-La Lemonade & Sucker Sales Recycling Jeans
Socks for Soldiers (15 boxes were sent to Iraq)
Figure 7.6-4 Students show citizenship and make a difference in the community.