Performance and Ergonomics of Touch Surfaces:
A Comparative Study Using Biomechanical Simulation
Myroslav Bachynskyi
∗†, Gregorio Palmas
∗, Antti Oulasvirta
‡, J ¨urgen Steimle
∗†, Tino Weinkauf
∗ ∗Max Planck Institute for Informatics
†Saarland University
‡Aalto University
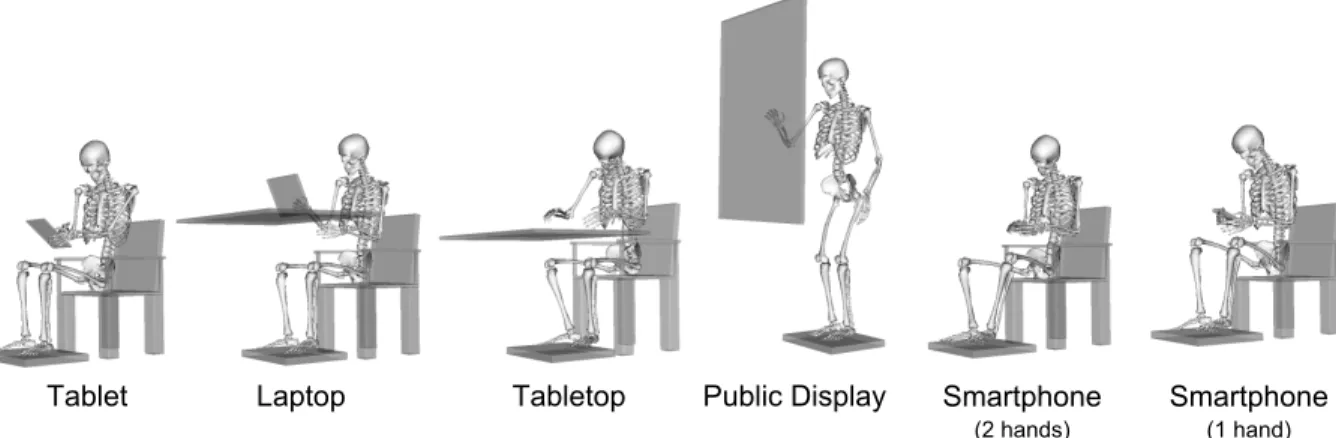
Figure 1. This paper presents performance and ergonomics indices for six typical touchscreen surfaces. Motion capture-based biomechanical simulation was used to understand differences in speed, accuracy, posture, energy expenditure, and muscle group differences. This figure shows the median postures recorded in the study.
ABSTRACT
Although different types of touch surfaces have gained exten-sive attention in HCI, this is the first work to directly compare them for two critical factors: performance and ergonomics. Our data come from a pointing task (N=40) carried out on five common touch surface types: public display (large, ver-tical, standing), tabletop (large, horizontal, seated), laptop (medium, adjustably tilted, seated), tablet (seated, in hand), and smartphone (single- and two-handed input). Ergonomics indices were calculated from biomechanical simulations of motion capture data combined with recordings of external forces. We provide an extensive dataset for researchers and report the first analyses of similarities and differences that are attributable to the different postures and movement ranges. Author Keywords
Touchscreen surfaces; Biomechanical simulation; Fitts’ law; Comparative study; Touch input; Pointing study.
ACM Classification Keywords
H.5.2. Information Interfaces and Presentation (e.g. HCI): User Interfaces
Permission to make digital or hard copies of all or part of this work for personal or classroom use is granted without fee provided that copies are not made or distributed for profit or commercial advantage and that copies bear this notice and the full cita-tion on the first page. Copyrights for components of this work owned by others than ACM must be honored. Abstracting with credit is permitted. To copy otherwise, or re-publish, to post on servers or to redistribute to lists, requires prior specific permission and/or a fee. Request permissions from [email protected].
CHI 2015, April 18–23 2015, Seoul, Republic of Korea. Copyright © 2015 ACM 978-1-4503-3145-6/15/04...$15.00. http://dx.doi.org/10.1145/2702123.2702607
INTRODUCTION
This paper addresses the fact that we are using a growing va-riety of touch devices in daily life. Smartphones and tablets have reached the status of a standard input device, and table-tops and public displays are receiving increasing attention. We investigate the performance and ergonomics factors of common touch surfaces. While these have been studied in the past (e.g., [3, 20, 21, 9]), the studies have considered a
singlesurface type at a time, such as tabletops [14], vertical displays [24], tilted displays [13], or handheld devices [20]. It has been impossible to form an overview of how the sur-face types differ in interaction. First, earlier studies did not compare surface types. Second, previous work has typically studied performance or ergonomics in isolation. Third, there are critical differences in experimental tasks, metrics, partic-ipants, devices, and so on, that prevent a direct comparison across studies.
This paper is the first in HCI to present results from a di-rect experimental comparison of common touch surface types in a target selection task. The within-subjects design sheds light on important differences and similarities among the sur-faces. We see two benefits. First, the results illuminate the strengths and weaknesses of each surface as well as trade-offs among them. Our study permits looking at trade-trade-offs in throughput, postures, and the expected fatigue in sustained interaction. Moreover, recommendations can be derived for better ergonomics and performance. In the past, poor er-gonomics has often been identified anecdotally as a limiting factor for the prolonged use of surfaces. This is exemplified
by the “touch thumb” and the “gorilla arm”—now popular metaphors of fatigue caused by touch interactions. The re-sults of our study allow comparing such effects across sur-faces.
Our point of departure is the assumption that differences among touch surfaces in performance and ergonomics can be attributed to biomechanical causes. Even though the in-put device is seemingly the same, touch surfaces can involve very different postures and movements. On the one hand, this increases tremendously the possibilities for using touch surfaces for input. On the other hand, different positions re-quire different body postures, and the consequences of vary-ing body posture on input are less well known. The implica-tions of postural flexibility deserve attention, as it is a distin-guishing feature of touch surfaces versus desktop interaction. Our study addresses natural postures for five surface types commonly used and researched in HCI:
1. public display: large area, vertically positioned, used
while standing
2. tabletop: large area, horizontally positioned, used when
seated
3. laptop: medium area, adjustable tilted position, used when
seated
4. tablet: medium area, handheld
5. smartphone: small area, used with one or two hands
These align with the prototypical postures in previous HCI studies.
Our methodology builds on recent advances in unobtrusive data-driven ergonomics analysis. We use optical motion cap-ture and biomechanical simulation to compute several in-dices of ergonomics. Biomechanical simulation describes motion capture data as velocities and angles of limbs, forces and moments at joints, and muscle activations. The use of biomechanical simulation not only provides a very rich de-scription of biomechanical events in the body, it also over-comes challenges that the traditional ergonomics instruments have, such as goniometers and surface-EMG. Recently, the predictions of mocap-based biomechanical simulation were validated against EMG data [1]. The results were positive for all participants, highlighting that the correlation is higher for aimed motions involving larger muscles on male subjects closer to the population average in anatomical dimensions. We take this into account in study design and data analysis. Unique to our study is that we allow users to freely choose their posture within each condition. We cluster these pos-tures based on the recorded data to identify commonalities, e.g., leaning forward or backward. This allows us to analyze the amount of posture variation, and how different each pos-ture type is in terms of performance and ergonomics. Full-body biomechanical simulation was not previously applied for analyses of interaction while sitting due to difficulties in measuring external forces. To allow users to change their pos-ture while seated and record the main external forces acting on the human body, we constructed a chair instrumented with force sensors. The recorded forces are fed into our biome-chanical analysis.
Our experimental task centers on the multidirectional version of Fitts’ pointing task. This task allows the measurement of throughput (bits/s) by considering the accuracy and speed of aimed movements [25]. Moreover, it allows us to cover all movement directions on each surface. We selected pointing gestures as the subject of our study, because discrete aimed movements are the most widespread input across all surfaces, and encompass both capacitive and resistive techniques. Fu-ture work can extend this work to multitouch gesFu-tures follow-ing our methodology.
The secondary contribution of this paper is the dataset, TOUCHCORPUS, which we release for the research commu-nity. The dataset includes the raw data captured with the op-tical motion capture system as well as processed data, the latter on both a frame level (1.3 million observations) and aggregated per trial and movement direction (4280 observa-tions). For each observation the dataset includes more than 1,000 variables describing performance and ergonomics as-pects. The dataset captures fundamental aspects of touch in-put that may support many investigations. The corpus can speed up future research on touch input, avoiding repeated data collection. Moreover, it is our hope that a shared cor-pus will contribute to the replicability of studies and make it possible to compare findings from different publications. RELATED WORK
We review previous work from two areas: physical er-gonomics and performance, two areas which have rarely in-tersected in previous work.
Physical Ergonomics
Studies of physical ergonomics in touchscreen interaction have looked at comfort, user preferences, joint angles, pos-tures and muscle use. Each study has focused on a particular type of surface.
M¨uller-Tomfelde et al. [16] collected user preferences for touch display workspace design. They found that the majority of participants preferred a tilted display at 45° or 30° angles to horizontal or vertical configurations. They explained this preference by better visibility and reachability of the display, improved comfort for the visual system and body posture. Barb´e et al. [2] simulated postures for interaction with dif-ferent touch displays in airplane cockpit. They validated the models using motion capture data and a simple biomechani-cal simulation CATIA/HUMAN. The location and orientation of the display had a strong influence on physical effort. In par-ticular, it needs to be taken into account for prolonged tasks longer than 60 s. Davis et al. [5] analyzed data entry com-paring touchscreens to physical keyboards. They found that a touchscreen is equal to or better than a keyboard in terms of kinematics, discomfort, usability, and error rates. A tilted ori-entation was preferable to a horizontal or vertical oriori-entation, an effect that was influenced by both physical and visual er-gonomics [23]. The authors conclude that the biomechanical analysis was limited, as a deeper analysis of physical loads
insidethe body could not be performed. Young et al. [31] as-sessed postures and muscle activity in shoulder and forearm during tablet interaction. They made several findings: the
wrist is often operating in close-to-extreme angles, the fore-arm extensor muscles are highly activated in text entry, the trapezius muscles have higher activation when the tablet is on the table, and that the anterior deltoid has high variance when the tablet is heavier. Kim et al. [12] analyzed smartphone in-teraction and found that the body posture (sitting, standing, sitting at desk) affects the range of motion and the muscle ac-tivity of the thumb. They concluded that deeper analyses of ergonomics are necessary in future work.
Performance
Touch input has been found to be advantageous but also challenging when compared to mouse and keyboard [29, 3]. Touch lacks the haptic feedback of a physical button, and it suffers from occlusion and the fat finger problem. How-ever, it performs relatively well in pointing tasks that involve medium-sized and big targets. Due to its directness it has ad-ditional advantages for novice users [29, 24].
Multiple studies have analyzed input performance with touch surfaces. However, as noted, most exclusively focused on a particular device [14, 24, 13, 20]. We are aware of only a sin-gle publication comparing different types of surfaces. How-ever, it analyzes only reading comfort and performance [15]. Many previous studies look at accuracy. Beringer et al. [4] analyzed response times and accuracy on vertical touch dis-plays, finding them to be non-uniform with respect to the tar-get location and to the angle between line-of-sight and the screen. They also modeled input offsets between touch points and targets, which improved the accuracy of touch for a par-ticular participant. Park et al. [20], similarly to Beringer et al., assessed the accuracy of single-thumb interaction with a smartphone. They found that distributions of touch points are Gaussian and distinct for each participant, button location, and size. Similarly, Parhi et al. [19] reported touch accuracy limits for PDAs, recommending minimum target sizes of at least 9.2 mm for single target tasks and 9.6 mm for multi-target tasks. Wang et al. [27] analyzed the touch area for all fingers on a tabletop and extracted touch area properties as shape, size, and orientation. Holz et al. [9] analyzed hu-man errors while using touch and concluded that the origin of errors is not the fat finger problem, but the perceived in-put point, which they model based on roll, pitch and yaw. Their projected center model [10] performs significantly bet-ter than the standard method, decreasing input offsets to as low as 1.6 mm.
A large number of other studies investigate input performance in general, taking speed into account. Most of the analyses have used Fitts’ law modeling [25]. Sears et al. [24] found that direct touch outperforms mouse input on vertical touch-screen when pointing to targets larger than single pixel. With additional stabilization the performance was the same and the error rate for 4 pixel and 1 pixel targets significantly de-creased. Micire et al. [14] confirmed the suitability of Fitts’ law models for horizontal tabletops. The study found that touch performes better than mouse input for all but 10mm targets; however, for 10mm and 20mm targets, the error rate was higher for touch input. Kin et al. [13] found that any
Cameras
Force plates
Surface with
targets
Markers
Figure 2. The experiment was carried out in a motion capture labora-tory equipped with a special chair instrumented with force plates. Sur-faces were emulated with cardboard. The targets were registered in 3D space and tracked during performance. Here a user is performing the task in the Tablet condition (seated). The inset shows an example of the multi-directional target setups used in the experiment.
touch-based method outperforms mouse input in a multitar-get selection task, while the difference between multitouch and touch is very small. Sasangohar et al. [22] found that direct touch input on a tabletop provides significantly better performance for most targets in a tapping task, although it has the worst error rate for the smallest targets. Po et al. [21] compared pointing performance of mouse and direct touch input in the upper and lower visual field of a large vertical display. Oehl et al. [17] compared pointing with a stylus to the same target setup on touch displays of different screen sizes. Their surprising finding was that for difficult targets (small, distant) the participants performed better on bigger rather than smaller displays.
To sum up, previous work has mostly analyzed only a single surface type at a time, and focused either on ergonomics or performance. All surface types were treated the same way. In contrast, we consider the two factors together.
EXPERIMENTAL METHOD
This experiment compares six surface conditions in a multidi-mensional target selection task. All movements are recorded with a motion capture system. We built a chair with sensor plates to record external forces while seated. Figure 2 pro-vides an overview of the setup.
Participants
40 participants (26 males and 14 females) were recruited at the local university campus. The age range is 19 to 39 years, with a mean of 24.9. The range of heights is 156-190 cm (mean 171.4 cm). The range of weights is 47-95 kg (mean 67.4 kg). The right hand was the dominant hand for 38 of the subjects. No participant had a known musculoskeletal
or neural disorder. We also collected their reports of previ-ous experience with touch screens. Most participants used a smartphone on a daily basis. They were compensated for participation at a rate of 10 Euro/hour.
Experimental Design
We follow a 6 x 12 within-subject design with 6 surface type conditions and 12 target selection conditions (see below). The order of surfaces was randomized for each subject, and within each surface condition the target selection conditions were randomized, too. The surface types are: public display, table-top, laptable-top, tablet, smartphone two hands, and single hand. We have selected the most widely used condition for each surface type: standing for the public display, and seated in other cases. The 12 target selection conditions consist of:
• index of difficulty (3):2, 3.5 and 5 for small and medium
surfaces; 2, 4 and 6 for large surfaces;
• approach angle (4):0°, 45°, 90°, 135°
Target sizes on each surface were proportional to the screen size. They were 60, 28 and 10 mm for the public display; 50, 22 and 8 mm for the tabletop; 20, 14 and 7 mm for the lap-top; 18, 10 and 7 mm for the tablet; and 7.5, 5 and 3.6 mm for the smartphone. Movement amplitudes on all surfaces matched screen size. In smartphone conditions amplitudes were shorter than marker error limits, limiting the applicabil-ity of the full-body simulation. Because biomechanical sim-ulation has limited validity for small-scale movements [1], only 10 users participated in the two smartphone conditions in addition to the other ones. The remaining 30 participated in all other conditions except the smartphone conditions. Task and Materials
We used a multidirectional Fitts pointing task [25] with circu-lar targets, 3 index of difficulty (ID) and 4 directionality con-ditions: in total, 12 conditions for each type of surface (the target setup is visualized in Figure 2). In contrast to a typical multidirectional pointing task in which users perform point-ing movements, changpoint-ing the target direction after each one, in our experiment the participant performed around 50 repet-itive aimed movements for each condition, without changing direction on the fly. The participant had to select the given target and then auditory feedback was given. Next he needed to select the opposite target.
To minimize the effect of surface friction, we used target se-tups printed on paper. They were printed on surface-size pa-per and affixed to a stand, a tabletop, and a tablet-shaped piece of plywood. The “tablet” is also tracked by the mo-tion capture system through three rigidly attached markers. For the “smartphone” conditions we used a real device, as we needed higher tracking accuracy than our motion capture system could provide. We selected the Galaxy S3 for this condition as a representative device, because its screen size is close to the market average, and it offers a screen with high performance and resolution. The target setup on the device was represented statically, similarly to the printed setups.
Procedure
Each study began with the subject wearing the motion cap-ture suit and standing in an upright static pose. This is nec-essary for musculoskeletal model scaling. Then the subject sought a comfortable posture for the surface we had selected randomly. The experimental task was then introduced and practiced. Next, the experimenter selected a random task condition and administered it with a custom-written software. The participant first performed a calibration for two given tar-gets by touching their centers, and the system stored the end-effector positions. We used this to provide auditory feedback while the task was performed.
Next, the participant could practice the task before the experi-menter started the recording. The participants were instructed to perform repetitive aimed movements between a given pair of targets “as fast as possible while keeping the accuracy at a specified level”. The system counted 50 aimed movements and then gave the signal to stop the selections.
After the participant completed the task in all conditions of a surface type, a break was provided and the next device brought. Each session was split into 6 blocks correspond-ing to surface type, lastcorrespond-ing approximately 15 minutes. The participants were allowed to take breaks when they wanted to rest. After the trials, we conducted an informal interview. We asked about participants’ experience with touchscreens and their preferred experimental condition, and we measured the weight of the participants.
Apparatus
Motion capture system: The experiment was performed in a motion capture laboratory with no vocal or visual distractors during the tasks. Motions were tracked with a PhaseSpace Impulse optical motion capture system featuring 12 cameras. The system tracked 38 active markers attached to a skin-tight motion capture suit at defined anatomical points. We added extra markers to the end-effectors (relevant fingertips). The motion was tracked with a frame rate of 480 Hz and an accu-racy of 1/2 mm.
Chair: External forces were recorded with a custom-built low-cost force chair and platform with two integrated Phid-gets bridges and 8 load cells (2000N, 2x1000N, 5x500N; max error = 0.2%) (Figure 2). The chair sensed the most signif-icant forces on the platform under the feet, under the seat, on the backrest and both arm rests and at two movable force platforms of 30cm x 40cm. The height of the seat was 50cm, width 45cm and depth 40cm; the height of the armrest was 70cm and width 8cm; and the backrest height was 95cm. The chair provided the force data at 125 frames per second. Figure 2 shows a user sitting on the chair in the Tablet condition.
Synchronization: Motion capture and force data were syn-chronized in real time using a custom-developed application on a high-end machine (Dell Precision M4800) to minimize latency (<5ms). For the smartphone conditions, we created an Android application for tracking touchscreen events. The touch screen tracking had non-uniform sampling with an av-erage framerate close to 60Hz.
ANALYSES
We here describe the preprocessing and analysis of data for performance and ergonomics indices.
Preprocessing
Our preprocessing follows practices in motion capture based biomechanical simulation (see e.g. [1]). We clean marker data from occlusions, reflections, and other artifacts with a heuristic approach and Kalman smoothing. We then align mocap data with force data and touchscreen recordings, and segment trial-level data into individual aimed movements. Performance modeling with Fitts’ law
We follow recommendations from previous research [25] and use the Shannon formulation of the index of difficulty (ID):
ID= log2 D
W + 1
whereD is the amplitude and W is the target width. The unit of ID is bits. We compute the effective target width We = 4.133σand amplitudeDe =PNi=1Di/N instead of
DandW, whereσis the standard deviation of endpoint posi-tions,Diis the distance between start point and end point of a
single movement andNis the number of aimed movements. We compute the coefficientsaandbof Fitts’ law using least squares fitting for a linear model:
M T =a+b×IDe
whereM T is the average movement time. We assess good-ness of the fit by computingR2for each model. Furthermore, we calculate throughputT P for each condition as:
T P = 1 y y X i=1 1 x x X j=1 IDeij M Tij
whereyis the number of subjects andxis the number of trials performed in a particular condition.
Biomechanical Simulation
Although biomechanical computations have been known for decades [30], tools for motion capture based biomechani-cal simulation [6] and high-fidelity muskuloskeletal models1
have reached maturity only recently. In HCI, the tools ap-peared in publications last year [1]. The simulation provides a great opportunity to “look inside the body” of users as they interact with computers, with no obtrusive instruments. It es-sentially reverse engineers observed motion to infer the rel-evant anatomical events. The variable transformations per-formed during biomechanical simulation are described below. Motion of markers in 3D space is first explained as rotations of joints given skeletal structure. Then, given the mass distri-bution of the body, required moments and forces at joints are estimated. Finally, given muscle anatomy, plausible muscle activations are estimated.
In our work we use the state-of-the-art, open-source biome-chanical simulator OpenSim [6] and a high-fidelity mus-culoskeletal model from MusculoGraphics. The model is 1
http://www.musculographics.com/html/publications/ publications.html
anatomically correct with respect to previous work.1 It
rep-resents the full body of an average adult male with 63 bones (rigid segments), connected through 63 movable joints with a total of 109 degrees of freedom, and actuated by 236 Hill-type muscles which can exert active force along the muscle action path between the attachment points [11]. The simula-tor and the full-body model were recently validated against EMG data in full-arm movements in an HCI task [1]. The simulation consists of multiple steps, the latter of them yielding variables relevant for ergonomics assessment:
1. Scalingadjusts the generalized model size and weight to
match the anthropometry of the participant based on the motion capture data recorded in the static pose and the par-ticipant’s weight. Each bone is scaled according to the ratio between corresponding marker pairs in motion capture data and virtual markers attached to the model. The model’s weight is scaled proportionally to the participant’s weight, and then its distribution is adjusted according to segment scaling ratios.
2. Inverse Kinematics computes angles at all jointsof the
model which correspond to the cloud of points in 3D space recorded by the motion capture system. Intuitively, it trans-forms motions of points in 3D space to relative motions of skeletal segments. The angles are estimated for each frame by global minimization of the sum of squared er-rors between the markers recorded in the experiment and corresponding virtual markers attached to the bones of the model, while keeping the movement constraints of the joints.
3. Inverse Dynamicscomputesmoments at jointsandforces
inside the jointsoccurring between the bones and joint cap-sule. They are calculated by directly applying Newton’s motion laws to the kinematics data obtained in the previ-ous step and the inertial and mass properties of the model assigned at the Scaling step.
4. Static Optimization resolves the moments at joints to
forces exerted by the muscles acting at that joint and cor-responding muscle activations. Muscle forces and activa-tions are estimated by minimization of the sum of squared muscle activations for each frame, with each muscle rep-resented by Hill’s model. The static optimization assumes that humans recruit their muscles in an optimal way with respect to the sum of squared activations. This sum repre-sents muscle stress and performs better than other criteria in load sharing problems [7]. In some situations this as-sumption can be false and human muscle usage can be non-optimal, for example when co-contracting opposite mus-cles; however, it has been shown to correlate well with EMG recordings for the aimed movements we analyze [1]. The simulation is resource-intensive: the average time to run Inverse Kinematics for a single trial is 4 hours. However, to make proper posture assessment and accommodate posture changes during a trial, we calculated Inverse Kinematics for the whole dataset. On the other hand, the subsequent steps of Inverse Dynamics and Static Optimization are computed only for “representative” movements. Even then, Static Optimiza-tion takes an average of 1.2 hours per movement.
Follow-ing prior work [1] we select onerepresentativemovement for every trial in each direction. We use the closest-to-average performance for this selection.
Posture Clustering
During the trials, users were free to take any posture they wanted. To make sense of this data, we use hierarchical clus-tering on the Inverse Kinematics data to identify the main types of postures for each surface type.
The Inverse Kinematics outputs serve as input for this step: the angles at joints calculated by Inverse Kinematics are ap-plied to the musculoskeletal model of an average adult male, putting the model into the corresponding posture. In this pos-ture we extract 3D locations of 22 keypoints at all joints of the human body and use them as input for the clustering al-gorithm. We have selected hierarchical clustering [8] because it is flexible and does not make assumptions about the data. We use Euclidean distance measure to treat all keypoints and dimensions equally. To acquire compact clusters with mini-mized variance we use Ward’s linkage criteria.
To select the correct number of clusters we examine com-puted dendrograms and use multiple goodness-of-clustering indices: Pearson gamma, Dunn index, average silhouette width, and within-to-between ratio. The computations are performed in R withhclustfrom thestatspackage and clus-ter.statsfrom thefpcpackage. Following this approach, we obtained 7 clusters for the tablet, 3 for the laptop, 2 for the tabletop, 2 for the large display, 3 for the 2-handed smart-phone, and 4 for the 1-handed smartphone. We introduce these postures later on in the paper.
THETOUCHCORPUSDATASET
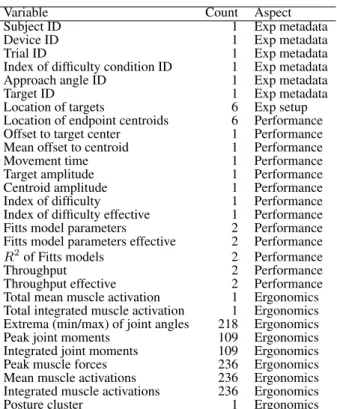
The outcome of these analyses is a dataset that integrates all variables extracted at different processing steps in a synchro-nized way. As can be seen in Table 1, the dataset includes 1181 variables describing different aspects of performance, ergonomics and experiment metadata. While the performance variables have been studied for years in HCI, the ergonomics variables from biomechanical simulation are more recent and therefore described here in more detail:
• Joint angles are related to the discomfort during the in-teraction. Operation of a joint at close-to-extreme angles causes postural discomfort and poses high risk for future musculoskeletal disorder, for example repetitive strain in-jury or carpal tunnel syndrome. In the dataset we consider extreme values at all joints.
• Excessivejoint momentscause high load on the joint tis-sues and can cause damage to the joint, in particular when high moments are sustained for a prolonged period of time. We consider peak moments as well as the values integrated over the whole movement.
• Largemuscle forcesstress the muscle and tendon and can cause damage to their tissue.
• Muscle activationstake into account the muscle forces, but normalized by the muscle size. The activation value of each muscle ranges from 0 when muscle is at rest to 1 when
Variable Count Aspect
Subject ID 1 Exp metadata
Device ID 1 Exp metadata
Trial ID 1 Exp metadata
Index of difficulty condition ID 1 Exp metadata Approach angle ID 1 Exp metadata
Target ID 1 Exp metadata
Location of targets 6 Exp setup Location of endpoint centroids 6 Performance Offset to target center 1 Performance Mean offset to centroid 1 Performance Movement time 1 Performance Target amplitude 1 Performance Centroid amplitude 1 Performance Index of difficulty 1 Performance Index of difficulty effective 1 Performance Fitts model parameters 2 Performance Fitts model parameters effective 2 Performance
R2of Fitts models 2 Performance
Throughput 2 Performance
Throughput effective 2 Performance Total mean muscle activation 1 Ergonomics Total integrated muscle activation 1 Ergonomics Extrema (min/max) of joint angles 218 Ergonomics Peak joint moments 109 Ergonomics Integrated joint moments 109 Ergonomics Peak muscle forces 236 Ergonomics Mean muscle activations 236 Ergonomics Integrated muscle activations 236 Ergonomics Posture cluster 1 Ergonomics Table 1. Dataset variables extracted by the different types of analyses.
Condition Size Support Orientation Color
Tablet 19 x 24.3 cm Handheld —
Laptop 31 x 23 cm Supported Tilted Tabletop 110 x 70 cm Supported Horizontal Public display 85 x 120 cm Supported Vertical Smartphone 2-hands 6 x 10.6 cm Handheld —
Smartphone 1-hand 6 x 10.6 cm Handheld —
Table 2. The surface types studied in this paper. We introduce a color convention for the remaining analyses.
the muscle is maximally recruited. We use the muscle ac-tivations integrated over a whole movement as an index of muscular energy expenditure and fatigue.
RESULTS
We used MATLAB, R and MovExp [18] for exploring the dataset. This section presents the main findings. We focus on basic indicators of performance (throughput) and ergonomics (muscle activation, muscle groups), and postures. For sta-tistical testing, we use repeated measures ANOVA with an alpha-value of .05.
Performance
We here focus on throughput as an aggregate metric of per-formance. Full data on speed and accuracy is provided in TOUCHCORPUS.
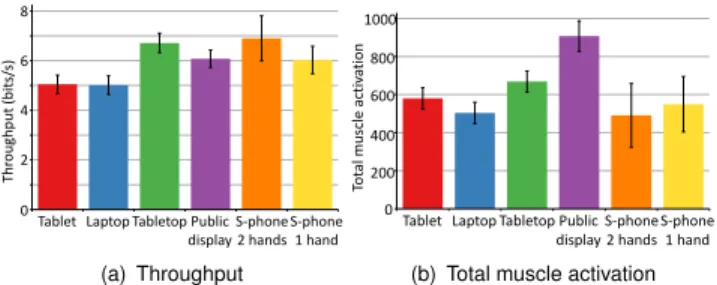
Figure 3(a) provides an overview of throughput versus sur-face type. The effect of sursur-face type on throughput was statis-tically significant (F5,8= 9.24,p <.0001). It can be clearly
seen in the figure that the tabletop has the highest throughput and 2-hand smartphone follows in second place. The public display showed a slightly lower performance, while the lap-top and tablet conditions saw the worst user performance.
0 1 2 3 4 5 6 7 8 9 0 2 4 6 8 Thr oug hp ut (b its /s)
Tablet Laptop Tabletop Public display S-phone 2 hands S-phone 1 hand (a) Throughput 0 200 400 600 800 1000 1200 0 200 400 600 800 1000 Tot al m uscle activ ation
Tablet Laptop Tabletop Public display
S-phone 2 hands
S-phone 1 hand (b) Total muscle activation
Figure 3. Throughput and total muscle activation per surface type. Ver-tical bars denote confidence intervals.
2 3 4 5 6 𝑀𝑇 𝑀𝑇 = −0.091 + 0.284 × 𝐼𝐷 𝑅2= 0.954 0.4 0.8 1.2 MT ID 2 3 4 5 6 𝑀𝑇 𝑀𝑇 = −0.437 + 0.3 × 𝐼𝐷 𝑅2= 0.961 0.4 0.8 1.2 MT ID 2 3 4 5 6 𝑀𝑇 𝑀𝑇 = −0.159 + 0.279 × 𝐼𝐷 𝑅2= 0.968 0.4 0.8 1.2 MT ID 2 3 4 5 6 𝑀𝑇 𝑀𝑇 = −0.509 + 0.311 × 𝐼𝐷 𝑅2= 0.982 0.4 0.8 1.2 MT ID 2 3 4 5 6 𝑀𝑇 𝑀𝑇 = −0.46 + 0.298 × 𝐼𝐷 𝑅2= 0.949 0.4 0.8 1.2 MT ID 2 3 4 5 6 𝑀𝑇 𝑀𝑇 = −0.733 + 0.411 × 𝐼𝐷 𝑅2= 0.947 0.4 0.8 1.2 MT ID Tablet Laptop
Tabletop Public display
S-phone 2 hands S-phone 1 hand
Figure 4. Fitts’ law models for each surface type.
Average throughput was 6.55 bits/s. In the tabletop con-dition it was 20.5% higher than average. With the 2-hand smartphone it was 5.3% higher than average, and in the pub-lic display condition 5.2% higher. By contrast, with the 1-hand smartphone it was 8% lower than average, with the tablet 10.9% lower than average, and in the “laptop” condi-tion 12.1% lower. Fitts’ law models elaborate this view. Figure 4 shows Fitts’ law models for the six surface types. The plots show Movement Time (M T) against Index of Dif-ficulty (ID). All Fitts’ law models had high fit, withR2 >
0.95in most cases. However, there are some non-linear com-ponents visible for tablet, laptop, tabletop, and public display. Still, fitting a nonlinear model increased the fit by only 1-1.5%, and we therefore continued to use the linear model. The Fitts’ law models elaborate the overview by crossovers. For example, there is a crossover for the 2-hand smartphone condition versus the tabletop condition. The tabletop is worse in lowIDconditions. The plots also show that the 1-hand smartphone is different from other surface types, because it provides high performance that is pronounced in the lowID conditions. However, performance degrades much faster than in other conditions whenIDincreases.
0 500 1000 1500 2000 2500 3000 3500 4000 4500 5000 0 5 10 15 20 25 30
Total muscle activation
Effective throughput
Figure 5. Total integrated muscle activation vs. effective throughput.
Total Muscle Activation
The effect of surface type on total muscle activation was sta-tistically significant (F5,8 = 10.59,p <.0001). Figure 3(b)
provides an overview.
We report standardized effect sizes for Total Muscle Activa-tion, as its units are coupled with our musculoskeletal model. We learn that total muscle activation was lowest in the laptop and 2-hand smartphone conditions. In the tablet condition, it was slightly lower than average (“touchscreen in general”). It was the highest for the public display. The mean of total mus-cle activation was 608.1. For 2-hand smartphone use it was 19.2% better than average, for the laptop 18.6% better, for the 1-hand smartphone 9.6% better, and for the tablet 6.9% better than average. By contrast, the tabletop was 9.3% worse and the public display 45% worse than average.
Trade-offs: Muscle Activation vs. Performance
We found a non-trivial relationship between (effective) throughput and total muscle activation, as illustrated in Fig-ure 5. The figFig-ure shows second order polynomials fitted to the original data. The most surprising pattern in the plot is thatlowthroughput movements are associated with high muscle activations. The reason is that the lowest throughputs come from conditions with difficult-to-reach targets that re-quire more careful control of muscles.
We also found that the approach angle influences through-put. However, it has no effect on total muscle activation. As stated before, average throughput is 8.5 bits/s. When consid-ering the different movement directions, the highest through-put was found for horizontal movements (+9%) and the low-est for movements on a diagonal with 45° negative slope (-6%) and vertical movements (-5%). Movements on the di-agonal with 45° positive slope have throughput close to the average.
Muscle Groups
Although input with all surfaces is carried out with the same arm, biomechanical simulation exposes large differences in which muscle groups are involved.
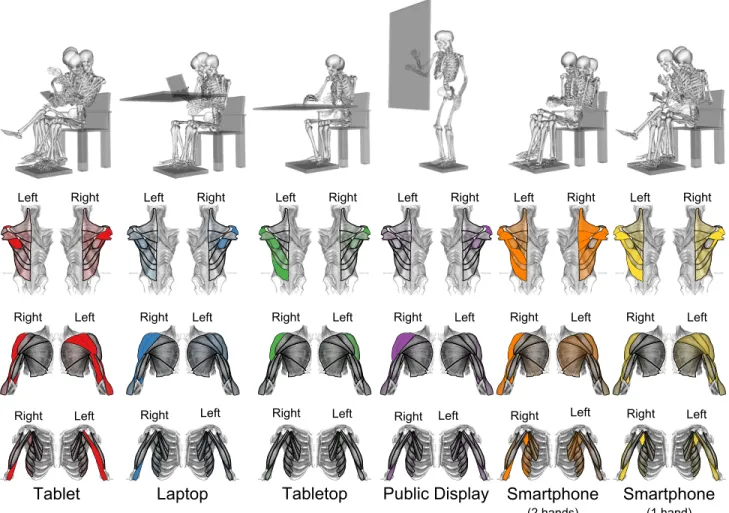
Interaction with tablet is characterized by high activations of side and back deltoids for interacting arm. For the arm that holds the surface, we see higher activation in frontal deltoid, triceps, and infraspinatus. Laptop use is characterized by high activations of the front and medial deltoids and infraspinatus.
Figure 6. Posture clusters (top) per surface. Total activations of major muscles are shown below per surface type.
The tabletop recruits muscles of the lower back and the me-dial deltoid of the input arm. The public display, similarly to the laptop, recruits frontal and medial deltoid muscles of the input arm. Additionally, due to the standing posture, it shows higher total activation in all postural muscles. When interacting with the smartphone with two hands, the lower back muscles of the holding arm, as well as upper back, me-dial, and back deltoid muscles, are strongly activated. When interacting with one hand, upper back muscles are not that activated, but the medial and back deltoids of the interacting arm are more strongly activated.
Posture Analysis
Our posture clustering permits insight into differences within surfaces. Recall that users were allowed to take whatever pos-tures they liked. We first report on the pospos-tures used by our participants. The clusters are visualized in Figure 6.
The following observations can be made.
• Tablet: These postures were grouped into six clusters. In
the first five, the subjects hold the tablet in their hands in a low position close to their stomach. In the sixth cluster, they hold the surface closer to their face in a higher posi-tion. None of the subjects rest their back on the backrest of the chair, while four sit with his/her legs crossed.
• Laptop: These postures were grouped into three clusters.
In all three, the subjects keep their left arms under the table and none of them rest their back on the backrest of the chair.
• Tabletop: Two clusters were found. In the first, the
sub-jects mainly rest their left arm on the armrest while they perform their task. In the second, they have both arms on the table. Again, none of the subjects rest on the backrest of the chair.
• Public display: Two clusters were found. In both, subjects
keep their left arm along their body. The main difference is that in the first cluster, the subjects have their trunk closer to the surface.
• Smartphone, 2-handed: Three clusters were found. In the
first, the subjects rest on the backrest of the chair and place their elbows on the armrests, so that the trunk is oblique with respect to the seat. They keep the phone very close to their face. In the second, they sit instead in a straight po-sition keeping the phone close to their knees. In the third, they sit back on the chair, resting their back. They keep the phone close to their face and their legs are outstretched.
• Smartphone, 1-handed: Four clusters were found. In the
and they have their torso bent toward the front. In the other clusters, the subjects sit in an upright position. In the third, the subjects keep their legs crossed, and in the fourth they keep the phone close to their face.
Note that by using the clusters, we can improve the fit of Fitts’ law models by 10%. The new goodness scores are shown in Table 3. This is in line with the idea that muscle groups affect Fitts’ law model parameters. By decreasing heterogeneity in postures we can therefore also improve model fit. This ef-fect is not achieved by arbitrary reclusterings, for example per user only.
DISCUSSION
The study was successful in exposing several novel findings about touch surfaces. The main thrust of the results is that even if surface interactions superficially appear similar, there are considerable differences in performance and fatiguabil-ity. In performance, we find large but not extreme differences among the surfaces. Performance-wise, even selection tasks with a high ID can be deployed on all surface types. By con-trast, the differences we found in muscle activation and mus-cle groups are more pronounced. We summarize the observa-tions as follows:
• The tablet has poor performance and is suitable for long-term use only after adjustment of the pose to avoid neck problems.
• The laptop has mediocre, almost poor performance, but it is suitable for long-term use.
• The tabletop has high performance but it is not suitable for long-term use, unless proper posture support is provided.
• The public display has high performance but it is not suit-able for long-term use.
• The smartphone used with two hands has high performance but it is unsuitable for long-term use.
• The smartphone used with one hand has medium perfor-mance and is also unsuitable for long-term use.
While anyone can inspect the data for further comparisons, we highlight two surface types here: laptop vs. public dis-play. They differ in interesting respects although both are used via movements of the arm. Laptop users’ postures vary only slightly, with most users keeping neutral posture and avoiding excessive stresses. These postures activate mainly shoulder and arm muscles and are associated with low to-tal muscle activation, which suggests that the surface is suit-able for longer-term use. Contrary to expectations, the lap-top provided the best physical ergonomics of interaction with the most neutral posture and low muscle activations, while providing acceptable throughput. While public display users’ postures also vary very little, these postures are associated with high total muscle activation in the shoulder. The sur-face is not suitable for longer-term use although users’ per-formance with this surface was very good. As expected, in-teraction with public displays is very demanding in terms of total muscle activation, not only because of the standing pose, but also due to longer movements in the vertical plane, in par-ticular when reaching targets that are located higher on the display.
To contextualize our findings, we qualitatively compared them with previous studies. Similarly to Barbe et al. [2], our results confirmed significant differences among different pos-tures. Although the conditions cannot be directly compared, the laptop in front of the user in our study demonstrated the lowest fatigue index among conditions, agreeing with Barbe et al.’s “tilted display.” The recruitment of shoulder muscles in the tablet condition varied with respect to posture and the presence of support, and the upper trapezius on the dominant side was more activated than on the non-dominant side, as in the study of Young et al. [31]. Similarly to Oehl et al. [17], we observed an effect of display size on throughput for tilted and horizontal displays, but not for handheld and vertical display conditions. As in the study of Wagner et al. [26], we observed different grips during the experiment, including both novice and expert grips. However, in our case users were seated, and they often adjusted their posture and supported the tablet with their knee or leg.
In addition to decisions on which surfaces to use and how, these results could also be used to inform the design of
multi-surface setups. These are becoming common in control rooms, aircraft, and currently also in desktop settings (e.g., [28]). The design problem here is how to allocate parts of the interface across many surfaces.
Finally, we note that the present paper has provided only the very first overview of this dataset. The TOUCHCORPUS al-lows researchers to continue empirically-founded analyses of touch input. By releasing it to the community, we wish to support further studies of this kind.
ACKNOWLEDGMENTS
We thank Mirella Scholtes for her help with the user study. This research was funded by the Cluster of Excellence for Multimodal Computing and Interaction at Saarland Univer-sity, the Max Planck Centre for Visual Computing and Com-munication, the Academy of Finland and the ERC Starting Grant project COMPUTED (637991).
The dataset can be accessed under the following link:
http://resources.mpi-inf.mpg.de/touchbiomechanics.
REFERENCES
1. Bachynskyi, M., Oulasvirta, A., Palmas, G., and Weinkauf, T. Is motion capture-based biomechanical simulation valid for HCI studies?: Study and
implications. InProc. CHI, ACM (2014), 3215–3224. 2. Barb´e, J., Chatrenet, N., Mollard, R., Wolff, M., and
B´erard, P. Physical ergonomics approach for touch screen interaction in an aircraft cockpit. InProc. IHM, ACM (2012), 9.
3. Benko, H., and Wigdor, D. Imprecision, inaccuracy, and frustration: The tale of touch input. In
Tabletops-Horizontal Interactive Displays. Springer, 2010, 249–275.
4. Beringer, D. B., and Peterson, J. G. Underlying behavioral parameters of the operation of touch-input devices: Biases, models, and feedback.Human Factors 27, 4 (1985), 445–458.
P P P P P PP Variable
Cluster Tablet Laptop Tabletop Pub disp S-phone 2 hands S-phone 1 hand
1 2 3 4 5 6 7 1 2 3 1 2 1 2 1 2 3 1 2 3 4 Fitts’acoefficient -0.34 -0.15 -0.14 -0.15 -0.16 -0.37 -0.27 -0.15 -0.18 0.04 -0.52 -0.48 -0.47 -0.41 -0.57 -0.46 -0.42 -1.20 -0.58 -0.67 -0.45 Fitts’bcoefficient 0.44 0.28 0.30 0.27 0.29 0.46 0.37 0.29 0.28 0.21 0.30 0.30 0.31 0.29 0.34 0.29 0.24 0.56 0.36 0.42 0.29 Fitts’R2 0.85 0.97 0.95 0.78 0.84 0.62 0.54 0.97 0.97 0.82 0.97 0.94 0.96 0.94 0.96 0.89 0.98 0.91 0.96 0.93 0.95 Throughput(bits/s) 4.39 5.79 5.20 5.40 4.99 4.67 4.45 5.08 5.39 4.67 7.41 6.84 6.24 6.27 6.42 7.42 8.54 5.72 6.09 4.92 6.83 Muscle activation 608 569 619 602 627 1561 522 597 549 600 710 686 1025 849 672 616 357 632 578 755 236 Table 3. Performance and ergonomics indices for posture clusters.
5. Davis, K., Hammer, M., Kotowski, S., and Bhattacharya, A. An ergonomic comparison of data entry work using a keyboard vs. touch screen input device while standing and sitting.J Ergonomics S 4(2014), 2.
6. Delp, S. L., Anderson, F. C., Arnold, A. S., Loan, P., Habib, A., et al. OpenSim: Open-source software to create and analyze dynamic simulations of movement.
IEEE Trans. Biomedical Engineering 54, 11 (2007), 1940–1950.
7. Glitsch, U., and Baumann, W. The three-dimensional determination of internal loads in the lower extremity.
Journal of Biomechanics 30, 1112 (1997), 1123 – 1131. 8. Hastie, T., Tibshirani, R., Friedman, J., Hastie, T.,
Friedman, J., and Tibshirani, R.The elements of statistical learning, vol. 2. Springer, 2009.
9. Holz, C., and Baudisch, P. The generalized perceived input point model and how to double touch accuracy by extracting fingerprints. InProc. CHI, ACM (2010), 581–590.
10. Holz, C., and Baudisch, P. Understanding touch. In
Proc. CHI, ACM (2011), 2501–2510.
11. Holzbaur, K. R. S., Murray, W. M., and Delp, S. L. A model of the upper extremity for simulating
musculoskeletal surgery and analyzing neuromuscular control.Ann. of Biomed. Eng. 33(2005), 829–840. 12. Kim, D.-S., and Chae, W.-S. Biomechanical analysis of
a smartphone task with different postures.Korean Journal of Sport Biomechanics 22, 2 (2012), 253–259. 13. Kin, K., Agrawala, M., and DeRose, T. Determining the
benefits of direct-touch, bimanual, and multifinger input on a multitouch workstation. InProc. GI, Canadian Information Processing Society (2009), 119–124. 14. Micire, M., Schedlbauer, M., and Yanco, H. Horizontal
selection: An evaluation of a digital tabletop input device.Proc. AMCIS(2007), 164.
15. Morris, M. R., Brush, A. B., and Meyers, B. R. Reading revisited: Evaluating the usability of digital display surfaces for active reading tasks. InProc. Tabletop, IEEE (2007), 79–86.
16. Muller-Tomfelde, C., Wessels, A., and Schremmer, C. Tilted tabletops: In between horizontal and vertical workspaces. InProc. Tabletop, IEEE (2008), 49–56. 17. Oehl, M., Sutter, C., and Ziefle, M. Considerations on
efficient touch interfaces–how display size influences the performance in an applied pointing task. InHuman interface and the management of information. Methods, techniques and tools in information design. Springer, 2007, 136–143.
18. Palmas, G., Bachynskyi, M., Oulasvirta, A., Seidel, H.-P., and Weinkauf, T. MovExp: A versatile visualization tool for human-computer interaction studies with 3D performance and biomechanical data.
IEEE Trans. Vis. Comput. Graphics 20, 12 (Dec 2014), 2359–2368.
19. Parhi, P., Karlson, A. K., and Bederson, B. B. Target size study for one-handed thumb use on small touchscreen devices. InProc. MobileHCI, ACM (2006), 203–210. 20. Park, Y. S., and Han, S. H. One-handed thumb
interaction of mobile devices from the input accuracy perspective.IJIE 40, 6 (2010), 746–756.
21. Po, B. A., Fisher, B. D., and Booth, K. S. Mouse and touchscreen selection in the upper and lower visual fields. InProc. CHI, ACM (2004), 359–366. 22. Sasangohar, F., MacKenzie, I. S., and Scott, S. D.
Evaluation of mouse and touch input for a tabletop display using Fitts’ reciprocal tapping task. InProc. HFES, vol. 53, SAGE Publications (2009), 839–843. 23. Schultz, K. L., Batten, D. M., and Sluchak, T. J. Optimal
viewing angle for touch-screen displays: Is there such a thing?IJIE 22, 4 (1998), 343–350.
24. Sears, A., and Shneiderman, B. High precision
touchscreens: Design strategies and comparisons with a mouse.IJMMS 34, 4 (1991), 593–613.
25. Soukoreff, R., and MacKenzie, I. Towards a standard for pointing device evaluation, perspectives on 27 years of Fitts’ law research in HCI.IJHCS 61, 6 (2004), 751–789.
26. Wagner, J., Huot, S., and Mackay, W. BiTouch and BiPad: Designing bimanual interaction for hand-held tablets. InProc. CHI, ACM (2012), 2317–2326. 27. Wang, F., and Ren, X. Empirical evaluation for finger
input properties in multi-touch interaction. InProc. CHI, ACM (2009), 1063–1072.
28. Weiss, M., Voelker, S., Sutter, C., and Borchers, J. BendDesk: Dragging across the curve. InProc. ITS, ACM (2010), 1–10.
29. Whitefield, A. Human factors aspects of pointing as an input technique in interactive computer systems.Applied Ergonomics 17, 2 (1986), 97–104.
30. Winter, D. A.Biomechanics and motor control of human movement. Wiley, 2009.
31. Young, J. G., Trudeau, M. B., Odell, D., Marinelli, K., and Dennerlein, J. T. Wrist and shoulder posture and muscle activity during touch-screen tablet use: Effects of usage configuration, tablet type, and interacting hand.
Work: A Journal of Prevention, Assessment and Rehabilitation 45, 1 (2013), 59–71.