GHENT UNIVERSITY
FACULTY OF ECONOMICS AND BUSINESS
ADMINISTRATION
ACADEMIC YEAR 2013 – 2014
The use of Performance Measurement
systems to realize strategic alignment
within the business architecture
.
Thesis presented to obtain the degree of Master of Science in Business Economics
Carl Vansteenbrugge under the supervision of
PERMISSION
The undersigned declares that the content of this master thesis may be consulted and/or reproduced, provided that the source is cited.
Abstract
Gedurende de voorbije twee decennia is er een stijgende interesse opgetreden in de onderzoekswereld voor het meten en analyseren van de prestaties van bedrijven. Voorgaand onderzoek heeft immers uitgewezen dat er een positieve relatie is tussen het gebruik van een prestatiemeetsysteem en de prestaties van een onderneming. Het doel van prestatiemanagement is om een systeem te ontwikkelen dat in staat is om de vooropgestelde strategie en doelstellingen te vertalen naar operationele meetindicatoren voor alle processen, taken, personeel,… De prestaties op al deze meetindicatoren kunnen vervolgens als feedback dienen bij het nemen van beslissingen door het management van het bedrijf.
Het onderzoeksveld van prestatiemanagement is een heel breed domein, waarin tal van verschillende disciplines samen komen. Verschillende auteurs hebben de voorbije jaren bijgedragen tot dit onderzoeksveld, maar weinigen hebben echt een impact nagelaten. Een overzicht van de gepubliceerde literatuur gedurende de voorbije jaren in dit domein dringt zich op. Hoewel er een wijd aanbod is aan prestatiemeetsystemen, geniet vooral de Balanced Scorecard het meest aandacht in de literatuur en in de praktijk.
Deze thesis is uitgewerkt rond drie onderzoeksvragen. Eerst wordt een systematic literature review uitgevoerd rond het thema prestatiemeting in bedrijven. Vervolgens worden de meest onderzochte en gebruikte prestatiemeetsystemen besproken. De laatste onderzoeksvraag richt zich op de link tussen prestatiemeting en bedrijfsarchitectuur. Er wordt nagegaan (i) op welk(e) niveau(s) van de bedrijfsarchitectuur de verschillende prestatiemeetsystemen actief zijn en (ii) in welke mate de prestatiemeetsystemen kunnen bijdragen tot strategic alignment
tussen de verschillende lagen van de bedrijfsarchitectuur binnen een onderneming. Deze laatste onderzoeksvraag zal uitgevoerd worden door middel van een case study.
Uit dit onderzoek blijkt dat vier van de negen onderzochte prestatiemeetsystemen voldoen aan alle criteria voor het versterken van strategic alignment binnen een onderneming. Het gaat om de SMART Performance Pyramid, BSC, IDPMS en Performance Prism. Wanneer we deze frameworks linken aan de bedrijfsarchitectuur zien we dat vijf ervan (RDF, SMART, BSC, IDPMS, Performance Prism) op alle drie de lagen (strategische laag, waardelaag en operationele laag) focussen. De BSC focust wel iets meer op de strategisch laag. De overige vier frameworks kunnen niet op alle drie de lagen gesitueerd worden en focussen specifiek op één of twee lagen. Veel hangt uiteraard af van de context waarin of het doel waarmee de modellen werden gecreëerd.
Preface
Before I started my study of Master of Science in Business Economics at the Ghent University, I completed a four-year study of Master of Science in Physical Education and Movement Sciences. Needless to say, there is a big gap between these two studies. Not only the campus and professors differed, even the way of teaching and the interaction between the students felt totally different. However, the biggest difference obviously, was the content of the curriculum. For someone with very little economic or management knowledge at the start of this academic year, I knew it was not going to be evident to write a master thesis right away.
Luckily, I could count on the excellent support of my thesis mentor Ben Roelens. Throughout the entire year, he assisted me with great guidance and feedback. Without his help and expertise, the completion of this master thesis would not have been possible. I would also like to thank my promotor Prof. Dr. Geert Poels, for his feedback during this year.
Table of Contents
1. Introduction ... 12 2. Methodology ... 13 3. Literature Review ... 15 3.1 Introduction ... 15 3.2 Definition ... 163.3 History of Performance Measurement ... 17
3.4 Key characteristics ... 18
3.4.1 The features ... 19
3.4.2 The roles ... 21
3.4.3 The processes ... 22
3.5 Implementation of a Performance Measurement System... 22
3.6 Dynamic Performance Measurement ... 24
4. Review of Performance Measurement Frameworks ... 26
4.1 The Performance Measurement Questionnaire ... 26
4.2 The Performance Measurement Matrix and the Results-Determinants Framework ... 27
4.3 The SMART Performance Pyramid ... 29
4.4 The Balanced Scorecard ... 30
4.5 The EFQM Excellence Model ... 33
4.6 The Integrated Dynamic Performance Measurement System ... 36
4.7 The Integrated Performance Measurement Framework ... 38
4.8 The Performance Prism ... 40
5. Case Study ... 44
5.1 The case: Rolls-Royce ... 44
5.3 Applying the case to the different PMSs ... 46
5.2.2 The Results-Determinants Framework (RDF) ... 51
5.2.3 The SMART Performance Pyramid ... 53
5.2.4 The Balanced Scorecard (BSC) ... 54
5.2.5 The EFQM Excellence Model ... 56
5.2.6 The Integrated Dynamic Performance Measurement System (IDPMS) ... 58
5.2.7 The Integrated Performance Measurement Framework (IPMF) ... 60
5.2.8 The Performance Prism ... 62
5.2.9 The Dynamic Multi-dimensional Performance Framework (DMPF) ... 64
6. Conclusion ... 67
Table of Abbreviations
Definition
PM Performance Measurement PMP Performance Management Process PMS Performance Measurement System PMQ Performance Measurement Questionnaire PMM Performance Measurement Matrix
RDF Results-Determinants Framework
SMART Strategic Measurement Analysis and Reporting Technique BSC Balanced Scorecard
EFQM European Foundation for Quality Management
IDPMS Integrated Dynamic Performance Measurement System PIT Process Improvement Team
IPMF Integrated Performance Measurement Framework PMG Performance Measurement Grid
DMPF Dynamic Multi-dimensional Performance Framework SAIC Science Applications International Corporation EHM Engine Health Management
List of Tables
Table 1 - Factors that influence the management through PM (Franco-Santos & Bourne, 2005)……….23
Table 2 - The Performance Measurement Questionnaire part 1 (Dixon et al., 1990)………….………26
Table 3 - The Performance Measurement Questionnaire part 2 (Dixon et al., 1990)……….27
Table 4 - The Results-Determinants Framework (Fitzgerald et al., 1991)………...………...28
Table 5 - The selection of performance measures in the IPMF (Medori, 1998)……….39
Table 6 - The twelve potential baseline measures of the DMPF (Maltz et al., 2003)……….…………43
Table 7 - The PMQ put to practice part 1……….……….………….……….………49
Table 8 - The PMQ put to practice part 2………50
Table 9 - The RDF put to practice……….……….……….………52
Table 10 - The SMART Performance Pyramid put to practice………..……….53
Table 11 - The BSC put to practice……….55
Table 12 - The EFQM Excellence Model put to practice……….……….……….57
Table 13 - The IDPMS put to practice………59
Table 14 - The IPMF put to practice………..……….61
Table 15 - The Performance Prism put to practice……….……….63
Table 16 - The DMPF put to practice………..65
List of Figures
Figure 1 - The closed loop deployment and feedback system for the PMP (Bititci et al., 1997)……….15
Figure 2 - The performance pyramid (Cross & Lynch, 1991)………29
Figure 3 - The four perspectives of the balanced scorecard (Kaplan & Norton, 2007)………31
Figure 4 - The four processes of the balanced scorecard (Kaplan & Norton, 2007)………32
Figure 5 - The Model criteria (EFQM, 2012)………35
Figure 6 - The RADAR Logic (EFQM, 2012)………36
Figure 7 - Integrated dynamic performance measurement system (Ghalayini et al., 1997)………38
Figure 8 - The Performance Prism (Neely et al., 2001)………..40
1. Introduction
During the past two decades, there has been a growing interest in the domain of performance measurement and management within organizations. Before the 1990’s, management used to rely solely on financial measures. Luckily however, people involved in the domain of performance measurement started to understand that these figures did not give a reliable view of the current performance of the organization and were unable to predict future performance. The field of performance measurement is very broad and authors of diverse disciplines contribute to it. However, according to Marr & Schiuma (2003), only a few authors and papers have heavily influenced this research domain. They state that “many make contribution, but with little impact to the field as a whole” (Marr & Schiuma, 2003, p. 683). This also means that lots of research questions still remain unanswered in this domain and that further cumulative efforts are recommended. This master thesis contributes to the field of performance measurement by identifying and evaluating the main research efforts that have been made. This enables researchers to get a structured overview of this field, which can guide the identification of future research opportunities.
The goal of this thesis is threefold:
1. Firstly, a literature review on the subject of performance measurement within an organization will be performed.
2. Secondly, an overview of the most commonly used and discussed performance measurement systems will be given. These frameworks were obtained through the same literature review. Only the frameworks that met the three specified criteria were selected.
3. Finally, an evaluation will be made of (i) what level(s) of business architecture (strategic, value and operational) these different frameworks are focusing on and (ii) how they can serve as a tool for enhancing strategic alignment between these three levels of business architecture within an organization. This will be done by applying them to a case, selected from the literature.
This master thesis starts with the description of the methodology. In chapter three, a review on the current literature concerning performance measurement is performed. In chapter four, the selected frameworks are reviewed and in the following chapter, they are applied to the selected case. This master thesis ends with a brief conclusion, mainly focusing on the third research question.
2. Methodology
To gather the existing relevant literature for the first and second research question, a systematic literature review was performed. The aim of the systematic literature review was to find as many primary studies relating to the research question as possible using an unbiased search strategy (Kitchenham, 2004).
To answer the first research question, the process of performance measurement (PM) was researched. The goal was to give an overview of how PM can be defined, how it has evolved over the years, what its key characteristics are, etc. The primary studies for this research question were obtained by using the digital library ‘Web of Science’. This database was searched using the keywords “performance measurement”, “performance measurement systems” and “performance measures”. The list of articles found using this searching strategy was over-abundant. Firstly, the relevance of the articles was evaluated solely on the title of the article. When there was still doubt about the relevance of an article for this research question, the abstract was analyzed. The following articles were considered relevant for this research question:
Articles on the definition of PM
Articles on the process of PM
Articles on the history of PM
Articles on the link between PM and strategy formulation
Articles on the dynamics of PM
Articles on the implementation of PM
Any other articles on PM
The following articles were excluded for this research question:
Articles on PM in a specific business sector (e.g. IT)
Articles on PM of one specific aspect of a company (e.g. customer satisfaction)
Articles on the affect PM can have on one specific aspect of the company (e.g. leadership)
After this selection was made, 19 primary studies(3,4,5,6,7,9,10,17,20,22,23,29,30,47,51,57,61,62,78) that provide direct evidence about the research question were selected for the first research question. During the actual writing of this first part of this thesis, relevant articles from the reference lists of these primary studies were added.
Articles that specifically reviewed one or more PMS, were not used as primary studies. These articles were used for the second research question, which focused on the description and
reviewing of the most commonly used and discussed PM frameworks. All the different PM frameworks that were encountered during the literature review were evaluated on three characteristics:
1. Is the framework applicable for the entire organization?
2. Does the framework offer a holistic, multi-dimensional approach? 3. Was the framework designed during or after 1990?
In other words, frameworks that were designed to evaluate the performance of a specific part of an organization were not selected. Also, frameworks that focus solely on financial measures were excluded. After this evaluation, nine frameworks were retained. The following frameworks were reviewed:
1. The Performance Measurement Questionnaire (Dixon et al., 1990)
2. The Performance Measurement Matrix and the Results-Determinants Framework (Fitzgerald et al., 1991)
3. The SMART Performance Pyramid (Cross & Lynch, 1991) 4. The Balanced Scorecard (Kaplan & Norton, 1992)
5. The EFQM Excellence Model (EFQM, 1992)
6. The Integrated Dynamic Performance Measurement System (Ghalayini et al., 1997) 7. The Integrated Performance Measurement Framework (Medori, 1998)
8. The Performance Prism (Neely & Adams, 2001)
9. The Dynamic Multi-dimensional Performance Framework (Maltz et al., 2003)
The last research question is aimed at evaluating how these systems contribute to the strategic alignment within the business architecture of an organization. Here, a case study was performed. A case was selected from the literature and adapted to this specific subject. The different PMSs were applied on the organization of this case, which should led to an evaluation from a more practical point of view. Four criteria were used to determine whether a framework can enhance strategic alignment within an organization.
3. Literature Review
3.1 IntroductionThe Performance Management Process (PMP) is the process by which a company manages its performance in line with its corporate and functional strategies and objectives. The objective of this process is “to provide a proactive, closed loop control system, where the corporate and functional strategies are deployed to all business processes, activities, tasks and personnel. Feedback is obtained through the performance measurement system to enable appropriate management decisions” (Bititci et al., 1997, p.524). In other words, a performance measurement system should enable a company to deploy the strategic and tactical objectives of the business and provide a structured framework to allow feedback of relevant information. Doing so, the processes of decision making and controlling the organization can be facilitated (Bititci et al., 1997).
Figure 1 - The closed loop deployment and feedback system for the PMP (Bititci et al., 1997)
The figure above clearly shows the two main pathways of performance management. The deployment arrow starts at the top of the organization, where the vision is defined. This is a statement of what the company wants to be in the long-term future. The board then outlines the business objectives that should help to realize this vision statement in the long term. These business objectives are then narrowed down to the strategic goals. These are more concrete than the business objectives and more useful on an operational level. Subsequently, critical success factors are selected for every strategic goal. They give an indication of how a company wants to achieve its objectives, whereas the strategic goals indicate what it wants to achieve. Finally, action plans are designed to reach the different critical success factors.
To evaluate whether a company is able to achieve its goals, performance measures will have to be selected for every action plan. This is also the start of the second arrow, the feedback system. These performance measures form the fundamental elements of any performance measurement system.
According to Atkinson (1998), the process of PM consists of 4 steps:
1. Identifying the primary objectives (as established by the owners or principals).
2. Analyzing the roles that different stakeholders play as the organization pursues its primary objectives
3. Identifying what each stakeholder requires in exchange for supporting the organization’s strategy
4. Determining how to measure the objectives and the stakeholder roles.
The PMP can only occur, when a company has selected and implemented a Performance Measurement System (PMS). PMSs are “concise sets of metrics […] that support the decision-making processes of an organization by gathering, processing and analyzing quantified information about its performance, and presenting it in the form of a succinct overview” (Bisbe & Malagueno, 2012, p.297). By acquiring and analyzing relevant information, a company can gain better insight in its current performance. Therefore, the implementation of a PMS can stimulate managerial changes and promote organizational learning (Garengo et al., 2007). In other words, the ultimate goal is not quantification but stimulating change (Neely et al., 2005).
A PMS generally speaking consists of two features: the measures and the supporting infrastructure (Franco-Santos et al., 2007). The challenge is to select the measures and parts of the supporting infrastructure that are worth their costs (Grosswiele et al., 2013). Numerous practitioners of a PMS indicate that they sometimes experience an overload of information. The cause of this problem is the fact that many systems contain irrelevant information for an organization. The consequences are excessive operating costs and unnecessary complexity of the processes (Grosswiele et al., 2013). Especially in small and medium-sized organizations, the cost of measurement is a big concern (Neely et al., 2005).
3.2 Definition
Management researchers in areas as diverse as strategy management, operations management, human resources, information systems, marketing, management accounting and
organizational behavior are contributing to the field of PM (Marr & Schiuma, 2003). As a result, the use of a PMS is a multi-disciplinary concept, including many different approaches (Franco-Santos et al., 2007).
Within this broad research field, Franco-Santos et al. (2007) state that 3 different perspectives could be used to define PMSs:
1. From an operations perspective, PMSs could be seen as a set of metrics used to quantify both the efficiency and effectiveness of actions (Neely et al., 1995) or as the reporting process that gives feedback to employees on the outcome of actions (Bititci et al., 1997).
2. From a strategic control perspective, 2 different aspects are highlighted. Firstly, a PMS allows an organization to cascade down those performance metrics used to implement the strategy within the organization (Gates, 1999). It also provides the organization with the information necessary to challenge the content and validity of the strategy (Ittner et al., 2003).
3. From a management accounting perspective, a PMS is considered to be synonymous with management planning and budgeting (Otley, 1999).
In this thesis, these first two perspectives will be the most important ones, since the processes and strategy play a dominant role when we will discuss the architecture of a firm. As will be explained below, the relation between management accounting and performance measurement has decreased during the past decades.
3.3 History of Performance Measurement
According to Johnson (1972), current management accounting developed in the USA between the 1850’s and 1920’s. After the First World War, some major organizations started using sophisticated budgeting and management accounting techniques, such as standard costing, variance analysis, flexible budgets, return on investment and other key management ratios (Chandler, 1962). However, between 1925 and the 1980’s, there were no significant developments in management accounting and by the 1980’s, traditional accounting measures were being criticized for encouraging short-term decision making (Johnson & Kaplan, 1987). Bourne & Neely (2003) state, based on previous research, that the traditional accounting-based performance measures have been characterized as being too much internally focused, backward looking and more concerned with local departmental performance than with the overall health or performance of the business. Measuring performance by solely relying on
financial measures led to destruction of Western manufacturing business (Hayes & Abernathy, 1980; Johnson & Kaplan, 1987).
Consequently, in the late 1980’s the desire to develop more balanced PMSs started growing (Bourne & Neely, 2003; Bourne, 1999). This lead to the creation of many new frameworks, which overcome many of the shortcomings of traditional financially-based accounting systems.
These PM frameworks can be classified into models of the first and the second generation (Yadav et al., 2013). Roughly, frameworks of the first generation were developed between 1990 and 2000, while frameworks of the second generation were developed after 2000.
As stated above, non-financial measures became important in the 1990s. The dimensions of performance measures covered by PM frameworks focused on quality, people-related issues, customer satisfaction, competitiveness, etc. (Yadav et al., 2013). Also, the quality of the financial measures was examined (Ittner & Lancker, 1998). These frameworks of the first generation were mainly used in the manufacturing organizations.
Frameworks of the second generation were more focused on the need for a holistic and integrated model for enterprise performance. More emphasis was placed on (i) the alignment of current performance with future performance, (ii) aligning individual performance with enterprise performance, and (iii) integrating operational, functional and strategic aspects of enterprise performance. Also, implementation of PM frameworks started becoming more and more popular in the service sector.
In conclusion, it could be stated that in the past two decades PM evolved from (i) operations to strategy, (ii) measurement to management, (iii) static to dynamic and (iv) economic-profit to stakeholder focus (Srimai et al., 2011).
3.4 Key characteristics
Franco-Santos et al. (2007) tried identifying the key characteristics of a PMS, by reviewing and synthesizing the different definitions that exist in the literature. This research only focused on “Business” PMSs, as opposed to “Organizational” PMSs. This meant that the public and non-profit sectors were excluded from their research.
The different definitions of PMSs were compared with each other on 3 levels: 1) The features: the different properties or elements which make up the PMS.
2) The roles: purposes or functions that are performed by the PMS.
3) The processes: the series of actions that combine together to constitute the PMS.
The definitions they encountered, demonstrated a great diversity and a lack of consensus. Each definition provided a different perspective on the concept, no two definitions agreed on the precise characteristics. However, some characteristics were more frequent than others.
3.4.1 The features
Franco-Santos et al. argue that there are 3 elements that seem necessary in a PMS. These are (i) ‘performance measures’, (ii) ‘objectives/goals’ and (iii) ‘supporting infrastructure’.
The goals that are selected by an organization can be either strategic goals, operational goals or even critical success factors. The supporting infrastructure exists of methods for recording data, supporting procedures (Neely, 1998) and human resources required to support the systems (Kerssens-Van Drongelen & Fisscher, 2003).
Which measures a company will adopt in its PMS, greatly depends on the importance of the different stakeholders. Different stakeholders have different expectations. Sometimes, this can produce conflicts. Therefore, “high performance is not about exceptional achievements on one or two measures but gaining satisfactory results along a broad set of criteria, each of which partly competes with others over time” (Doyle, 1994, p.131). Developing a hierarchy of measurements for each group of stakeholders and interlinking them to form one comprehensive PMS, is therefore needed to reflect the whole value system of an organization (Feurer & Chaharbaghi, 1995).
Neely et al. (1997), based on prior research, state that measures of performance should:
Be simple to understand and clearly defined
Be visible to all
Be derived from strategy and relate to specific, achievable goals
Provide timely and accurate feedback
Be quantitative (and the organization should be able to influence these numbers) According to Bourne & Neely (2003) PMSs should include (i) both financial and non-financial measures, (ii) both internal and external measures and (iii) both measures which quantify what has been achieved as well as measures which are used to help predict the future.
Financial & non-financial
In the past, there has been a tendency to focus too much on financial measures, as already stated above. Especially Western companies seemed to rely on financial measures (Doyle, 1994). Sometimes organizations use an absolute measure of profits, but more often it is a ratio such as ‘earnings per share’, ‘return on investment’ or ‘return on shareholder funds’. These indices easily allow benchmarking against competitors over time.
However, picking just one financial measure to evaluate success or failure is a dangerous thought, since this leads to a biased and misleading picture of overall performance of the company.
First of all performance is only viewed from the perspective of the shareholders and only their interests are being satisfied (Doyle, 1994). In other words, the main goal of the organization is to maximize the value for these shareholders. However, maximizing shareholder value can cause conflicts of interest with other stakeholders.
Secondly, when an organization strives to maximize on a financial measure, this implies that other measures are being neglected (Doyle, 1994). In other words, when an organization pursues excellence in one domain, trade-off effects will occur, which can damage the organization quite severely.
Many companies that consider non-financial measures as important are not capturing data on these measures (Stivers, 1998). A possible reason could be that companies perceive these measures to be immeasurable and therefore useless. Another reason could be the lack of the information systems’ capability to collect the correct data (Manoochehri, 1999). Nevertheless, since non-financial measures have proved their value, there is a need for investing some effort in developing information systems that can actually measure these intangibles (Franco-Santos & Bourne, 2005).
Internal & external
A study of Kagono (1985) showed that at the time, ‘growth of market share’ rather than ‘profitability’ was the dominant objective in most Japanese companies. Apparently, there was a difference in focus between these and Western organizations. Market share objectives received less priority in Western companies because, at least in the short term, they conflict with the profitability goal (Doyle, 1994). However, when companies focus too much on their
internal efficiencies rather than on what is happening in the market, they may lack the knowledge needed for making adequate management decisions (Bourne, 1999).
Past & future
Most of the common financial measures have measurement problems, which make them bad predictors of future performance (Doyle, 1994). Also, different accounting methods can have a big influence on the reported losses or profits. Therefore, financial measures do not give a reliable indication of the opportunities for an organization in the future, they merely give an image of the performance in the past. For example, profits can be quickly raised by trading off the future for the present. By cutting back on expenses such as Research & Development or brand support, earnings are boosted for a few years. However, there is a big chance that this decision will lead to a worse performance in the future. Similarly, firing employees and cutting back on education and training will certainly affect the current profitability. However, this will have a very negative influence on the service quality of the organization in the future.
3.4.2 The roles
The roles that were mentioned most frequently in the literature were (i) ‘strategy implementation/execution’, (ii) ‘focus attention/provide alignment’, (iii) ‘internal communication’ and (iv) ‘measure performance’. It’s also worth noting that only 1 definition mentioned the role of ‘strategy formulation’.
Franco-Santos et al. (2007) propose five different categories of PMS roles, being: 1) Measure performance: monitor progress and measure/evaluate performance; 2) Strategy management: comprises the roles of planning, strategy formulation, strategy implementation/execution and strategic alignment;
3) Communication: comprises the roles of internal and external communication, benchmarking and compliance with regulations;
4) Influence behavior: comprises the roles of rewarding or compensating behavior, managing relationships and control;
5) Learning and improvement: comprises the roles of feedback, double-loop learning and improvement of the systems and processes.
De Lima et al. (2013) add two extra roles. Firstly, they believe that a PMS can provide a better understanding of market needs. Secondly, the implementation of a PMS in an organization can produce a positive change in organizational culture.
3.4.3 The processes
Based on the analysis made by Franco-Santos et al. (2007), PMSs can include 12 different processes. Again, the authors proposed five different categories of necessary PMS processes:
1) Selection and design of measures 2) Collection and manipulation of data
3) Information management (information provision, interpretation, decision making) 4) Performance evaluation and rewards
5) System review (ensure feedback loop within the system) 3.5 Implementation of a Performance Measurement System
Managing the performance measurement of an organization is not just about selecting the relevant measures for that firm. The next step is putting all the ideas into action. Fitzgerald et al. (1991) split up the process in three steps:
1. Developing business objectives: analyzing the needs of the customers and the other stakeholders;
2. Designing measures: design them in such a way that it reinforces the achievement of the business objectives;
3. Managing through measurement: procedures must be put in place so that the measures are collected, analyzed, reviewed and acted upon on a regular basis over a sustained period of time (Bourne, 1999).
Implementing a PMS means that the system will have to interact with a wider environment (Neely et al., 2005). There are two dimensions in this environment: internal and external. The internal environment relates to the organization itself, the external environment relates to the market within which the organization competes. The latter consists of two elements: customers and competitors.
Some organizations are better in managing through measures than others. In other words, while some companies find it difficult to act upon their results, others systematically use theirs to support the decision-making processes within the organization. Franco-Santos & Bourne (2005) carried out a systematic review on this topic, their findings were based on 73 studies.
Franco-Santos & Bourne (2005) argue that there are 16 factors that have an impact on the way organizations manage through measures. These are split up in 11 process factors and 5 context factors. Below, you can find a schematic representation of these factors.
Table 1 - Factors that influence the management through performance measurement (Franco-Santos & Bourne, 2005)
The main process factors can be subdivided into those factors related to an effective design of a PMS, those factors related to an effective implementation of a PMS, and those factors related to the use of a PMS (Bourne et al., 2000). The contextual factors have been categorized as internal and external context factors. Although most of the sub-factors are evident, others need some explanation.
‘Alignment and integration’ is a sub-factor that can be split up into 2 different aspects. First of all, it relates to the integration and alignment of an organization’s mission, vision and strategy when designing a PMS. Secondly, it relates to the integration of a PMS with other key management systems such as planning and budgeting, rewards, or information systems. To effectively implement a PMS, people must be empowered, enabled and encouraged (Frigo & Krumwiede, 1999). ‘Empower’ refers to the need for people’s involvement in the development of a PMS. ‘Enable’ refers to the need for people’s education and training on the measures and on the related tools and procedures. ‘Encourage’ refers to the need for actions
or activities that actually motivate people to use the data provided by a PMS in their day-to-day work, create the right attitude towards the system and reduce the levels of resistance. The few studies that exist on the impact of ‘rewards’ on the use of PMSs, conflict in their findings (Franco-Santos & Bourne, 2005). Some authors argue that rewards are necessary to encourage the use of a PMS and, doing so, achieving better results (Kaplan & Norton, 1996; Malina & Selto, 2002; Gates, 1999). Others argue that linking performance on certain measures and rewards may lead to subjectivity and may have a negative impact on the effectiveness of the PMS (Ho & Mckay, 2002; Ittner et al., 2003).
3.6 Dynamic Performance Measurement
As already stated above (see supra p. 13), during the 1980’s, there was a growing need for more relevant, integrated and balanced PMSs. This lead to the creation of numerous new frameworks. However, it could be argued whether these frameworks are sufficiently advanced to create a truly dynamic PMS. According to Bititci et al. (2000) most organizations use a static PMS, instead of a dynamic one. This has a negative effect on the integrity of the PMS as well as on the agility and responsiveness of the organization. Bititci et al. (2000) state that the three main barriers to adopt a more dynamic approach are: (i) the lack of a structured framework, (ii) the absence of a flexible platform to allow organizations to effectively and efficiently manage the dynamics of their PMSs and (iii) the inability to quantify the relationships between measures within a system. In this context, the use of a company-wide IT-platform could be very useful.
The fact that PMSs need to achieve alignment with strategic priorities is well established within the literature (Dixon et al., 1990; Neely et al., 1995). However, it is also recognized that the external and internal environment of an organization is not static but is constantly changing (Bititci et al., 2000). Therefore, according to Bititci et al., a dynamic PMS should have:
An external monitoring system, which continuously monitors developments and changes in the external environment;
An internal monitoring system, which continuously monitors developments and changes in the internal environment and raises warning when certain performance limits or thresholds are reached;
A review system, which uses the information provided by the internal and external monitors and the objectives and priorities set by higher level systems, to decide internal objectives and priorities;
An internal deployment system to deploy the revised objectives and priorities to critical parts of the system.
4. Review of Performance Measurement Frameworks
In this chapter, the aforementioned PMSs will be reviewed. They are ordered in chronological order.
4.1 The Performance Measurement Questionnaire
The Performance Measurement Questionnaire (PMQ) was developed by Dixon et al. (1990). The PMQ helps managers (i) identify the improvement needs of their organization, (ii) to determine the extent to which the existing performance measures support improvements, and (iii) to establish an agenda for performance measure improvements (Pun & White, 2005). The framework is structured in two main parts. Part 1 is aimed at evaluating the specific
improvement areas of the organization and how effectively the current performance measures evaluate improvement. Originally, Dixon et al. (1990) classified the improvement areas in three categories, i.e. Quality, Labour Efficiency and Machine Efficiency.
Management is given a list of possible improvement areas for the organization. On a Likert scale, they have to indicate (i) the long-term importance of each improvement area for the organization and (ii) whether the current measures support improvement (Park et al., 1998).
How much improvement is
required in the long term? IMPROVEMENT AREAS
Do current measures support improvement?
None >>> Great Inhibit >>> Support
1 2 3 4 5 6 7 Improvement area 1 1 2 3 4 5 6 7
1 2 3 4 5 6 7 Improvement area 2 1 2 3 4 5 6 7
1 2 3 4 5 6 7 Improvement area 3 1 2 3 4 5 6 7
… … …
Table 2 - The Performance Measurement Questionnaire part 1 (Dixon et al., 1990)
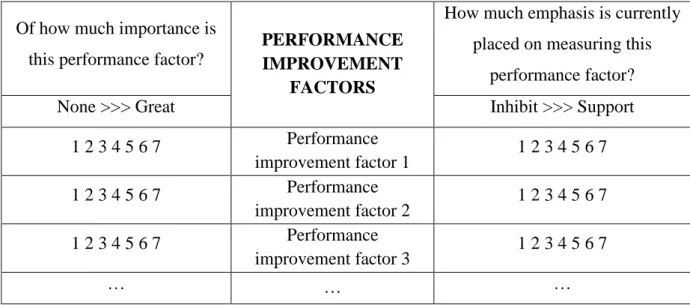
Part 2 is aimed at evaluating how achieving excellence for different performance improvement factors (= measures) will lead to long-term health of the organization and to which extent the organization already places emphasis on the most crucial factors (Bourne & Neely, 2003). The procedure is the same as for the improvement areas, management has to indicate (i) whether achieving excellence in a certain measure is important for the long-run health of the organization and (ii) whether the organization emphasizes this performance factor (Park et al., 1998).
Of how much importance is this performance factor?
PERFORMANCE IMPROVEMENT
FACTORS
How much emphasis is currently placed on measuring this
performance factor? None >>> Great Inhibit >>> Support
1 2 3 4 5 6 7 Performance improvement factor 1 1 2 3 4 5 6 7 1 2 3 4 5 6 7 Performance improvement factor 2 1 2 3 4 5 6 7 1 2 3 4 5 6 7 Performance improvement factor 3 1 2 3 4 5 6 7 … … …
Table 3 - The Performance Measurement Questionnaire part 2 (Dixon et al., 1990)
The PMQ can also be used as a step in the process of performance measurement within another framework. This is, for instance, the case in the Integrated Dynamic Performance Measurement System.
It could be argued that the PMQ cannot be considered a comprehensive measurement system (Ghalayini et al., 1997). Unlike the other models, the PMQ is not built around a fixed framework. Also, the PMQ does not provide identification of specific performance measures that are related to the strategy of the organization (Jagdev et al., 2004).
4.2 The Performance Measurement Matrix and the Results-Determinants Framework
Another older PM framework is the Performance Measurement Matrix (PMM), which was developed by Keegan et al. (1989). The strength of the PMM lies in the fact that it tries to integrate different dimensions of performance, being internal and external, financial and non-financial (Striteska & Spickova, 2012). However, the PMM does not make the links between the different dimensions of business performance (Neely et al., 2000). Fitzgerald et al. (1991) developed a modified system of the PMM, called the Results-Determinants Framework (RDF).
The RDF tries to overcome the criticism about the PMM. This framework was designed to be used in service businesses. The RDF classifies measures into two categories: measures that relate to the results of the strategy (financial performance and competitiveness) and measures that are determinants of that strategy’s success (resource utilization, quality of service, innovation and flexibility). The results obtained are a function of past performance. Therefore, they could be seen as lagging indicators, whereas determinants are leading indicators (Neely
et al., 2000). For the six dimensions, relevant measures are selected. Between the dimensions, there will be interactions and trade-offs. This should lead to better balanced strategic plans during the process of strategy formulation (Brignall & Balantine, 1996). Below is a schematic overview of the RDF model.
Results Competitiveness Measure 1 Measure 2 … Financial performance Measure 1 Measure 2 … Determinants Quality Measure 1 Measure 2 … Flexibility Measure 1 Measure 2 … Resource utilization Measure 1 Measure 2 … Innovation Measure 1 Measure 2 …
Table 4 - The Results-Determinants Framework (Fitzgerald et al., 1991)
Given that many large service organizations diversified on an organizational and geographical level, Fitzgerald et al. (1991) recommend that strategic business units (SBUs) become the main focus of performance measurement. A SBU could be defined as: “an operating unit which sells a distinct set of products or services to an identifiable group of customers in competition with a defined set of organizations” (Fitzgerald et al., 1991, p.21). For every SBU, the manager’s task is to select and implement a strategy to beat the competition while satisfying organizational performance requirements (Brignall & Balantine, 1996).
RDF reflects the concept of causality, which means it acknowledges that the results obtained today are a function of past business performance in relation to specific determinants (Neely, 2007).
4.3 The SMART Performance Pyramid
The SMART (Strategic Measurement Analysis and Reporting Technique) Performance Pyramid was created by Cross & Lynch (1991). The aim of this model is to connect the organization’s strategy with its operations, by translating objectives from the top down and measures from the bottom up. The pyramid contains four levels of objectives that affect the organization’s external effectiveness and simultaneously its internal efficiency.
Figure 2 - The performance pyramid (Cross & Lynch, 1991)
At the first level, an overall corporate vision is defined. This is then divided into individual business unit objectives. At the second level of the pyramid, short-term, financial targets are defined, as well as the long-term goals of growth and market position. The third level contains day-to-day operational measures (concerning customer satisfaction, flexibility and productivity). The last level includes four key indicators of performance measures: quality, delivery, cycle time and waste (Striteska & Spickova, 2012).
Although the SMART performance pyramid attempts to integrate corporate objectives with operational indicators, it does not provide any mechanism to identify these key performance
indicators. Also, it does not explicitly integrate the concept of continuous improvement (Striteska & Spickova, 2012).
4.4 The Balanced Scorecard
The most commonly used framework for performance measurement, is the Balanced Scorecard (BSC) (Susilawati et al., 2013; Neely et al., 2001). The BSC was created in 1992 by Robert S. Kaplan and David P. Norton. The authors state that the BSC revolutionized conventional thinking about performance measurement, by going beyond the traditional measures of financial performance. Non-financial metrics are valuable because they predict future financial performance rather than simply report what has already happened (see supra p. 15).
The BSC is based on four different perspectives that provide an organization’s performance measures and four management processes that contribute to linking long-term strategic objectives with short-term actions. First, the four perspectives of the BSC will be discussed. The traditional financial performance measures worked well for the industrial era, but they are out of step with the skills and competencies that companies are trying to master today. Nowadays, managers want a balanced presentation of both financial and operational measures. Kaplan and Norton complemented the financial measures with operational measures on customer satisfaction, internal processes and the organization’s innovation and improvement activities (see Figure 3). These operational measures are the drivers of future financial performance (Kaplan & Norton, 1992).
Figure 3 - The four perspectives of the balanced scorecard (Kaplan & Norton, 2007)
A. Customer Perspective: How do customers see us?
This perspective has become more and more important for the management of an organization in the past decades. The BSC demands that managers translate their general mission statement on customer service into specific measures that reflect the factors that really matter to customers. These concerns are subdivided into four categories: time, quality, performance and service.
B. Internal Business Perspective: What must we excel at?
Excellent customer performance derives from processes, decisions and actions occurring throughout the organization. Therefore, managers need to focus on those critical internal operations that enable them to satisfy customer needs (Kaplan & Norton, 1992). The measures that are implemented in a company’s BSC should have a direct relation with the internal business processes that have the greatest impact on customer satisfaction. Companies should also attempt to identify and measure their company’s core competencies, these are “the critical technologies needed to ensure continued market leadership” (Kaplan & Norton, 1992, p. 75). In conclusion, organizations must evaluate which processes are most important and select relevant measures for every process.
C. Innovation and Learning Perspective: Can we continue to improve and create value?
Growing global competition requires that organizations are able to continually improve their products and introduce new products to the market (Kaplan & Norton, 1992). Only by continually launching new products, creating more value for customers, and improving operating efficiency can a company penetrate new markets and increase revenues and margins.
D. Financial Perspective: How do we look to shareholders?
Some critics argue that by making fundamental improvements in operations, the financial numbers will take care of themselves. In other words, companies should stop navigating by financial measures (Kaplan & Norton, 1992). However, there is always some uncertainty between an organization’s operational performance and the financial results. In reality, improved operational performance does not necessarily lead to an improvement of financial performance. Therefore, a well-designed financial control system can be a tool for improving quality management.
As stated above, the BSC relies on four processes to bind short-term activities to long-term objectives and strategy (see Figure 4). These were not added in the original BSC, but added later. The management processes are discussed below.
A. Translating the Vision
This process focuses on the formulation of the company’s vision and strategy. For people to act on the vision and strategy statements, these statements must be expressed as an integrated set of objectives and measures. These measures must describe an organization’s long-term drivers of success and are agreed upon by the top-management (Kaplan & Norton, 2007).
B. Communicating and Linking
The second process lets managers communicate their strategy up and down the organization and link it to departmental and individual objectives. By developing personal scorecards, employees will have a better understanding on how their own productivity supports the overall strategy. To align employees’ individual performances with the overall strategy, scorecard users generally engage in three activities: (i) communicating and educating, (ii) setting goals and (iii) linking rewards to performance measures (Kaplan & Norton, 2007).
C. Business Planning
In the third process, companies integrate their business and financial plans, ensuring that the financial budgets support the strategic goals. Organizations identify the most influential drivers for the selected performance measures. Subsequently, milestones are set for every driver to enable evaluation of the progress that has been made with these drivers (Kaplan & Norton, 2007).
D. Feedback and Learning
The fourth process gives companies the capacity for what is called strategic learning. The BSC allows organizations to modify their strategies to reflect real-time learning. An organization that has implemented the BSC can monitor short-term results from the three operational perspectives and evaluate the current strategy in the light of this performance (Kaplan & Norton, 2007).
4.5 The EFQM Excellence Model
The European Foundation for Quality Management (EFQM) is a non-profit organization that was established in 1988 with the mission ‘Being a stimulus of sustainable excellence’. The EFQM Excellence Model was presented as an outline framework in 1992 (EFQM, 2012). The framework can be used by different kinds of companies and has a flexible approach. Not all businesses or business-units should apply the same prescriptive template, they can apply a
customized framework with specific measures to fit their goals, mission or strategy (Wongrassamee et al., 2003).
The EFQM Excellence Model gives people an insight in how a company’s actions and decision have an impact on the company’s results. It allows an organization to assess its effectiveness in developing and delivering a stakeholder-focused strategy. The model allows constant improvement by determining the shortcomings and encouraging appropriate solutions for them (EFQM, 2012).
To ensure sustainable financial growth, it’s necessary for a company to achieve adequate levels of customer satisfaction. The EFQM Excellence Model aims to achieve this by finding a balance between the most important stakeholder needs. The model acknowledges 4 types of stakeholders: Society, People (the employees), Customers and Shareholders (EFQM, 2012). The EFQM Excellence Model is based on a set of three integrated components: the Fundamental Concepts of Excellence, the Model Criteria, and the Radar Logic.
A. Fundamental Concepts of Excellence
First of all, excellence needs to be defined. “Excellent organizations achieve and sustain outstanding levels of performance that meet or exceed the expectations of all their stakeholders” (EFQM, 2012). In the EFQM Excellence Model, excellence is outlined by eight fundamental concepts. Each of the concepts is important, but maximum benefit is achieved when an organization can integrate them all into its culture.
The Fundamental Concepts of Excellence form the basis for the criteria of the EFQM Excellence Model. They are (1) adding value for customers, (2) creating a sustainable future, (3) developing organizational capability, (4) harnessing creativity and innovation, (5) leading with vision, inspiration and integrity, (6) managing with agility, (7) succeeding through the talent of people, and (8) sustaining outstanding results (EFQM, 2012).
B. The Model Criteria
Figure 5 - The Model criteria (EFQM, 2012)
To achieve excellence, the EFQM Excellence Model relies on nine criteria. Five of these are ‘enablers’ and four are ‘results’. The enabler criteria cover what an organization does and how it does it. They are the things an organization needs to do to develop and implement its strategy and are pictured on the left-hand side of the model. The 5 enablers are: (1) leadership, (2) strategy, (3) people, (4) partnerships & resources and (5) processes, products & services (EFQM, 2012).
On the other hand, the results criteria represent what a company achieves. These are the results an organization achieves, in line with its strategic goals. They are shown on the right-hand side of the model. The four results are: (1) customer results, (2) people results, (3) society results and (4) business results.
These results should provide an organization with the relevant measures for analyzing their performance. These measures enable the organization to evaluate the successful deployment of their strategy. The results can be segmented to evaluate the performance of specific areas of the organization (EFQM, 2012).
Because of the ever-changing global market and customer needs, the companies that achieve excellence today will not necessarily be the companies that achieve excellence in the future. The EFQM Excellence model has implemented a continual feedback loop to handle this challenge. This feedback loop allows companies to learn out of their results and thereby improving their 5 enablers. In the long term, this should lead to constant innovation and customer satisfaction (EFQM, 2012).
C. The Radar Logic
Figure 6 - The RADAR Logic (EFQM, 2012)
The RADAR methodology is the core of the EFQM Excellence model. It is a dynamic assessment tool that allows the management to examine the performance of the organization in a structured way. It states that an organization must take the following into consideration (EFQM, 2012):
Determine the Results it is aiming to achieve as part of its strategy;
Plan and develop an integrated set of sound Approaches to attain the required results;
Deploy the approaches in a systematic way to ensure implementation;
Assess and Refine the approaches by monitoring and analyzing the results achieved. 4.6 The Integrated Dynamic Performance Measurement System
The Integrated Dynamic Performance Measurement System (IDPMS) was created by Ghalayini et al. (1997). This PMS was specifically built for manufacturing environments. The IDPMS provides (i) performance measurement at several levels of the organization, (ii) integration of general areas of success with associated performance measures, and (iii) integration of relevant financial measures with operational performance measures (Ghalayini et al., 1997).
The IDPMS is based on the integration of three primary functional areas, which will be discussed below: management, process improvement teams (PITs) and the factory shop floor.
The management is responsible for both the ‘general’ and ‘specific’ areas of success that will be used in IDPMS. General areas of success are the important areas for the company’s long-term success. They are based on the organization’s strategy and the use of the PMQ. The specific areas of success are the essential areas for competing in a specific product market. These are usually determined by the marketing department according to sales and market share reports and customer satisfaction reports.
The PITs are composed of people from both management and the factory shop floor. The focus is on improving the operational and cost performance of the manufacturing systems. These teams select the performance indicators, determine an appropriate time horizon and report to management about the performance measures.
The factory shop floor includes departments directly related to manufacturing a product. They collect and analyze data on daily operations with respect to the performance measures of both general and specific areas of success. They may use a chain of performance indicators to govern and improve the relationships among the different departments.
Three different tools help the functional areas measure and improve performance in an integrated manner: the performance questionnaire (PMQ), the half-life concept and a modified value-focused cycle time (MVFCT) diagram.
The starting point of the IDPMS is to apply the PMQ. Afterwards the results of the PMQ are used to develop the organization’s strategies, supporting areas of success, and associated performance measures. A second tool is the half-life concept. The underlying premise of the concept is that “any defect level that is subject to legitimate process improvement efforts will decrease at a predictable rate” (Ghalayini et al., 1997, p. 213). The PITs use the half-life concept to determine a reasonable planning horizon and expected improvements to be achieved in the horizon. The last tool that is being used in the IDPMS, are the MVFCT diagrams. These are developed to model the manufacturing processes simply and accurately. It allows employee-based teams to improve process performance from an overall systems perspective. These diagrams indicate all the value adding and non-value adding components of a certain process. Teams can use these diagrams to improve the overall process.
Figure 7 - Integrated dynamic performance measurement system (Ghalayini et al., 1997) IDPMS implementation follows four steps:
1. Evaluate the PMQ results to determine areas of success and associated performance measures;
2. Identify the interrelationships between the various areas of success and performance measures;
3. Set up specific performance measures and indicators throughout the company; 4. Initiate system improvement activities.
For each general area of success, a list of specific areas of success can be generated. These are then further analyzed to determine a set of performance indicators. After identifying the areas of success and the associated performance indicators, the management has to identify the interrelationships among the different areas and measures. This enables the organization to prioritize improvement efforts in order to maximize the return of activities (Ghalayini et al., 1997). However, Susilawati et al. (2013) state that within the IDPMS, it is unclear to measure in a logical order and manage the relationships between measures.
4.7 The Integrated Performance Measurement Framework
The Integrated Performance Measurement Framework (IPMF) was designed by Medori (1998) as a PMS for manufacturing organizations. Medori & Steeple (2000) state that most PMSs give little guidance for the selection and implementation of the measures that form the
PMS. Therefore, the IPMF not only serves as a PMS for an organization, it can also be used to evaluate the relevance of the different measures that are already being used within the PMS of a firm.
The IPMF consists of 6 steps that have to be followed (Medori & Steeple, 2000). 1. Determining the company’s success factors
The selected success factors have to be strongly related to the organization’s strategy, mission and vision.
2. Forming the Performance Measurement Grid (PMG)
The selected success factors must now be linked to the six ‘competitive priorities’ of any organization in the manufacturing business. These are (i) quality, (ii) cost, (iii) flexibility, (iv) time, (v) delivery and (vi) future growth.
3. Selection of measures
For every competitive priority, the measures that are most relevant in accordance with the success factor(s) that correspond(s) with the competitive priority are selected. For one competitive priority, different measures can be selected. Below, a schematic representation is given of the first three steps of the IPMF.
Competitive priorities (step 2) Company success factors (step 1) Measures (step 3)
1 Quality
Success factor 1 Measure 1 Success factor 2 Measure 2 Measure 3
2 Cost Success factor 3 Measure 4
Measure 5
3 Flexibility … …
4 Time … …
5 Delivery … …
6 Future Growth … …
Table 5 - The selection of performance measures in the IPMF (Medori, 1998) 4. Auditing of the existing PMS
If the company is not using a PMS at the moment, this step can be ignored. However, if a PMS is already in practice, the IPMF allows an organization to asses it by
using the IPMF. When there is a gap or difference between both sets of measures, adjustments have to be made.
5. Implementation of the measures
The IPMF provides organizations with an eight step plan to implement their selected measures. The 8 steps are (i) title, (ii) objective, (iii) benchmark, (iv) equation, (v) frequency, (vi) data source, (vii) responsibility and (viii) improvement. These steps will not be discussed into detail.
6. Periodic maintenance
The measures that are most relevant today, could become irrelevant in the future, and vice versa. Therefore continual reviewing is imperative.
4.8 The Performance Prism
The Performance Prism was created by Neely & Adams (2001). It is one of the younger PMSs. Although Neely and Adams recognize the importance of the BSC, they argue that priorities are constantly changing and that there is a need for second generation of PM frameworks.
The Performance Prism consists of five interrelated facets:
A. Stakeholder Satisfaction: Who are the important stakeholders in your organization and what do they want and need?
This facet is broader than the BSC view of stakeholders, which only encompasses shareholders and customers. In the Performance Prism, the impact of employees, suppliers, the local community, etc. on performance plays a more prominent role.
B. Stakeholder Contribution: What do we want from our stakeholders?
This facet recognizes the fact that organizations not only have to deliver value to their stakeholders, they also enter into a long-term relationship with their stakeholders. This relationship should involve the stakeholders contributing to the organization.
C. Strategies: What are the strategies we require to ensure the wants and needs of our stakeholders are satisfied?
The starting point when selecting measures was: “Who are the stakeholders and what do they want and need?”. Only when these questions have been answered is it possible to start to explore the issue of what strategies should be put in place to ensure the wants and needs of the stakeholders are satisfied. In other words, strategy means how the goal will be achieved. It is not the goal itself.
D. Processes: What are the processes we have to put in place in order to allow our strategies to be delivered?
Many organizations classify four business processes: (1) develop products and services, (2) generate demand, (3) fulfill demand, (4) plan and manage the enterprises. These processes can be sub-divided into more detailed processes. Management will have to identify which are the most important processes, and focus attention on these, rather than simply measuring the functioning of all processes.
E. Capabilities: What are the capabilities we require to operate our processes?
Capabilities are the combination of people, practices, technology and infrastructure that together enable execution of the organization’s business processes. They are the fundamental building blocks of the organization’s ability to compete.
The Performance Prism builds on the strengths of existing measurement systems on shareholder value and brings innovation based on free premises. The strength of this framework is that it first questions the company’s existing strategy before the process of selecting measures is started (Najmi et al., 2012). However, the framework does not offer any information about how these performance measures are going to be implemented (Striteska & Spickova, 2012).
4.9 The Dynamic Multi-dimensional Performance Framework
The most recent PMS that will be discussed is the Dynamic Multi-dimensional Performance Framework (DMPF), designed by Maltz et al. (2003). This framework was created as a reaction on some older frameworks, like the BSC. Three points of criticism were mentioned, the authors state the older frameworks (i) fail to focus on the long term and are too focused on the short term (Maltz et al., 2003), (ii) put insufficient emphasis on the environment (Atkinson et al., 1997) and (iii) put insufficient emphasis on employees (Atkinson et al., 1997).
The DMPF includes five major dimensions: Financial, Market/Customers, Process, People Development and Preparing for the Future. The first three dimensions are more related to short term performance, while People Development and Preparing for the Future are aimed at the long term.
For every dimension, an organization has to select the most relevant measures. This means that measures can and should differ between organizations. What measures an organization will select, depends on its size, strategy, environment, industry, etc. The authors empirically determined that there are 12 measures that are relevant in most organizations, regardless the characteristics of the company. We call these measures the ‘potential baseline measures’. They are presented in table 6 below.
Dimensions Potential baseline measures 1 Financial 1 Sales 2 Profit margin 3 Revenue growth 2 Market / Customer
4 Customer Satisfaction Index 5 Customer retention rate 6 Service quality
3 Process
7 Time to market with new products/services
8 Quality of New Product Development and Performance Measurement processes
4 People Development 9 Retention of top employees
10 Quality of leadership development
5 Preparing for the Future
11 Depth and quality of strategic planning
12 Anticipating/preparing for unexpected changes in external environment
Table 6 – The twelve potential baseline measures of the DMPF (Maltz et al., 2003)
The importance of the different dimensions will vary strongly between different types of companies. A car manufacturer for example, will put more emphasis on the Process dimension, whereas a service organization will focus more on Preparing for the Future (Waltz et al., 2003).