1877–0509 © 2011 Published by Elsevier Ltd. Selection and/or peer-review under responsibility of Prof. Mitsuhisa Sato and Prof. Satoshi Matsuoka çdoi:10.1016/j.procs.2011.04.174
Procedia Computer Science 4 (2011) 1612–1621
International Conference on Computational Science, ICCS 2011
Cluster Analysis-Based Approaches for Geospatiotemporal Data
Mining of Massive Data Sets for Identification of Forest Threats
Richard Tran Millsa,1, Forrest M. Hoffmana, Jitendra Kumara, William W. Hargroveb
aComputer Science and Mathematics Division, Oak Ridge National Laboratory, Oak Ridge, TN, USA bSouthern Research Station, USDA Forest Service, Asheville, NC, USA
Abstract
We investigate methods for geospatiotemporal data mining of multi-year land surface phenology data (250 m2 Normalized Difference Vegetation Index (NDVI) values derived from the Moderate Resolution Imaging Spectrometer (MODIS) in this study) for the conterminous United States (CONUS) as part of an early warning system for detecting threats to forest ecosystems. The approaches explored here are based onk-means cluster analysis of this massive data set, which provides a basis for defining the bounds of the expected or “normal” phenological patterns that indicate healthy vegetation at a given geographic location. We briefly describe the computational approaches we have used to make cluster analysis of such massive data sets feasible, describe approaches we have explored for distinguishing between normal and abnormal phenology, and present some examples in which we have applied these approaches to identify various forest disturbances in the CONUS.
Keywords: phenology,
MODIS, NDVI, remote sensing,k-means clustering, data mining, anomaly detection, high performance computing
1. The Forest Incidence Recognition and State Tracking System (FIRST)
Early identification of forested areas under attack from insects, disease, or other agents can enable timely response to protect forest ecosystems from long-term or irreversible damage. Unfortunately, given the sheer size of the United States and limited resources of agencies such as the USDA Forest Service to conduct aerial surveys and ground-based inspections, many threats go unnoticed until a great deal of damage has already been done. To improve threat de-tection, the USDA Forest Service, in partnership with Oak Ridge National Laboratory and the NASA Stennis Space Center, is developing The Forest Incidence Recognition and State Tracking (FIRST) early warning system. FIRST will detect and monitor threats to forests and wildlands in the conterminous United States (CONUS) as part of a two tier system. An early warning system that monitors continental-scale areas at a moderate resolution using remote sens-ing data will spatially direct and focus efforts of the second tier, consisting of higher resolution monitoring through
Email addresses:[email protected](Richard Tran Mills),[email protected]
(Forrest M. Hoffman),[email protected](Jitendra Kumar),[email protected](William W. Hargrove) 1Corresponding author
airborne overflights—called Aerial Detection Survey (ADS) sketch-mapping—and ground-based inspections. Tier 2 is largely in operation today, but the strategic direction provided by the FIRST system in Tier 1 will improve the
efficiency and utility of these costly and labor-intensive surveys.
The goals of the FIRST early warning system are to provide a single, unified system for change detection from
re-motely sensed vegetation properties through time over the domain of the conterminous United States at about 250 m2
nominal resolution—obtained from the Moderate Resolution Imaging Spectroradiometer (MODIS) sensors on board NASA’s Terra and Aqua satellites—at frequent intervals, on the order of one week. The system must be automated, requiring unsupervised data mining methods, and provide results as close to real-time as possible. It must “learn” or improve its prognostic ability utilizing a library of previous experiences, including both true and false warnings with attribution to causes for the former. FIRST will utilize data on soils, topography, climatology, and weather events, as well as satellite-derived vegetation parameters. Because of the huge data volumes involved, even at this moderate resolution, FIRST must employ highly scalable data mining and statistical algorithms that operate on very large data sets using moderate- to large-sized clusters and supercomputers.
One of the most important types of data that FIRST will utilize is satellite-derived data indicating the annual tem-poral patterns of variation in vegetation greenness, i.e., the ecosystem phenology. This paper explores the application
of data mining techniques to analyze seasonal changes in phenology as represented by Normalized Difference
Vege-tation Index (NDVI) values derived from MODIS coverage of the CONUS. NDVI exploits the strong differences in
plant reflectance between red and near-infrared wavelengths to provide a measure of “greenness” from remote sensing measurements: NDVI= σnir−σred σnir+σred (1)
These spectral reflectances are ratios of reflected over incoming radiation,σ = Ir/Ii, hence they take on values
be-tween 0.0 and 1.0. As a result, NDVI varies bebe-tween−1.0 and+1.0. Dense vegetation cover is 0.3–0.8, soils are
about 0.1–0.2, surface water is near 0.0, and clouds and snow are negative. The Moderate Resolution Imaging
Spec-troradiometer (MODIS) is a key instrument aboard the Terra (EOS AM, N→S) and Aqua (EOS PM, S→N) satellites.
Both view the entire surface of Earth every 1 to 2 days, acquiring data in 36 spectral bands. The MOD 13 product provides Gridded Vegetation Indices (NDVI and EVI) to characterize vegetated surfaces. Available are 6 products at
varying spatial (250 m2, 1 km2, 0.05◦) and temporal (16-day, monthly) resolutions. The Terra and Aqua products are
staggered in time so that a new product is available every 8 days. Results shown here are derived from the 16-day
Terra MODIS product at 250 m2resolution, processed by NASA Stennis Space Center.
The utility of these data has already been demonstrated in [1], in which the authors used raster map arithmetic approaches, such as comparing maximum NDVI from mid-summer against maximum NDVI over a six-year baseline, to detect potential forest disturbances. Some of these disturbances could represent threats to the long-term health and
functioning of forest ecosystems. A difficulty with using such approaches is identification of appropriate parameters
(maximum NDVI, 20% “spring” NDVI, etc.) to use, since the appropriate choice of parameters may vary by region
and/or type of forest disturbance. Here, we experiment with approaches that do not depend on choosing particular
pa-rameters; instead, using high-performance computing, we apply geospatiotemporal data mining techniques to perform unsupervised classification based on multiple years of NDVI history for the entire CONUS. These classifications use the full volume of available NDVI data (rather than only a small subset of selected parameters) to construct a potential basis for determining the “normal” seasonal and inter-seasonal variation expected at a geographic location and to detect deviations from the norm that merit additional Tier 2 scrutiny.
2. Geospatiotemporal Cluster Analysis of Massive Data Sets
Different approaches to geospatiotemporal data mining of the NDVI history for the entire CONUS are being
explored as part of FIRST. In this paper, we describe techniques based onk-means cluster analysis, building on
pre-vious work by Hargrove and Hoffman [2, 3, 4] in which clustering techniques are used to define sets of categorical,
multivariate classes or states useful for describing and tracking the behavior of ecosystem properties through time within a multi-dimensional phase or state space. These techniques have been previously applied to remotely sensed hyperspectral imagery for detection of brine scars [5] and to monthly climate and NDVI data from 17 years of 8 km
Advanced Very High Resolution Radiometer (AVHRR) images for land surface phenology [6], and results suggest that this method could be a key component of an early warning system for detecting forest threats.
The approach described here employs an initialk-means cluster analysis of six years of the annual cycle of NDVI
performed for the entire CONUS, producing annual maps of phenological ecoregions or “phenoregions” [6]. The NDVI data are derived from the MODIS MOD 13 NDVI product and pre-processed at NASA’s Stennis Space Center, and cover years 2003–2009, with 2007 omitted due to data processing errors that NASA Stennis is currently working
to correct. The processed NDVI data for the CONUS have a 250 m2spatial resolution and are available every 16 days.
At this spatial and temporal resolution, each map contains more than 146M cells, and 22 maps (one for each 16-day period) are created for each year. The 19B NDVI values in the data set are arranged as annual NDVI traces of 22 val-ues, for each grid cell (146.4M records) in each of the six yearly maps, and the entire set of NDVI traces for all years and map cells is combined into one 77 GB (single precision) data set of 878 22-dimensional “observation” vectors
that are analyzed via thek-means algorithm. After applyingk-means, the cluster assignments are mapped back to the
map cell and year from which each observation came, yielding six maps in which each cell is classified into one of
kphenoclasses, which form a “dictionary” of representative or prototype annual NDVI traces (the cluster centroids)
derived from the full spatiotemporal extent of the observations in the input data set.
The time evolution of phenoclass assignment, or phenostate, for every cell in the map indicates a change in the phe-nological behavior and ecosystem productivity observed at that location due to natural or anthropogenic disturbance, forest regrowth, or ecosystem responses to interannual changes in climate. Comparison of the current phenostate with the nominal behavior of healthy vegetation indicated by the historical phenoclass assignment at every location in the CONUS could allow a national early warning system to identify locations where the vegetation appears to deviate from its usual phenological behavior [1].
Due to the very large size of our data set—which will continue to grow as we add additional years of NDVI data as well as ancillary data layers—clustering with available, serial tools is computationally infeasible. We have developed
a highly scalable parallelk-means cluster analysis tool that employs “acceleration” techniques to reduce the number
of distance comparisons required by the standardk-means algorithm, as well as a scalable tool for determining good
initial seeds to ensure a high quality clustering. 2.1. Determining Initial Cluster Seeds
It is well known that thek-means algorithm is sensitive to the initial seeds chosen, as the algorithm attempts to
minimize the sum of squared residuals but is only guaranteed to reach a local minimum. To enable a clustering of high enough quality to be useful for change detection, it has been necessary to not only develop a scalable implementation
of thek-means algorithm itself, but a scalable tool for choosing the initial cluster seeds as well. Previously, Hargrove
and Hoffman [2] have used a heuristic that approximates finding thekmost widely separated points in the data space.
Doing so exactly is an inherently sequential process, so instead the data set is equally divided among themcompute
processes, each of which finds the bestkcandidate centroids, with the root process then finding the bestkcentroids
from thek×mcandidates. Since this last, sequential step can be quite costly ifk×mis large, an alternative scheme
can be employed, in which the upper half of the active processes sends itskcandidate seeds to the lower half of the
active processes, the upper half becomes inactive, the lower half finds the bestkcandidate seeds from the 2keach
process now possesses, and so on, repeating this “folding” procedure until only a single process is left, with its bestk
candidates becoming the cluster seeds.
The above heuristic can yield high-quality seeds, but will not scale to data sets the size of the FIRST NDVI data. Instead, we have developed a method based on that of Bradley and Fayyad [7]. The method is based on the observation
that, viewing the data as arising from a mixture of different probability distributions (clusters), severe subsampling of
a data set naturally biases the sample to representatives “near” the modes. It consists of two phases of sub-sampling and clustering trials to produce high quality, highly representative initial centroids. In Phase 1 of the procedure, the
large data set is sub-sampled many times,Ns, and each sub-sample is clustered, usingkrandomly-selected
observa-tions from the sub-sample as initial centroids each time. In Phase 2, theNsgroups ofkcentroids that result from these
smaller clustering trials are combined to produce a single new data set that substitutes for the original data. This data
set is then clusteredNstimes, using as initial centroids each of theNs groups ofkcentroids. A pseudo-F statistic is
computed for each of these Phase 2 trials, and the group of centroids that result from the winning trial (i.e., the one
The challenge in using this method is that an extremely large data set must randomly sampled, resulting in an
ex-tremely inefficient file access pattern. This led us to explore three alternative sampling schemes as well: interleaved,
contiguous, and random. The NDVI data sets that we use are taken from a GIS, and are stored on disk in non-random reading-style geographically, right-to-left in sequential order, with data points corresponding to land only. Say, for example, that we want to use a 10% sample of the original data set to be clustered. The interleaved method starts
from some offset and simply takes every tenth record throughout the original data set. The contiguous method takes
a contiguous tenth of the original data set, starting from some offset. The random method takes a randomly selected
tenth of the original data set. All three methods use parallel I/O (via the MPI-IO interface), without which these
tasks would be impractical. Somewhat to our surprise, the three methods showed extremely close agreement in the
quality of cluster seeds generated, based on pseudo-Fand sum of squared residual statistics computed from the final
k-means clusterings. For the results reported here, however, we opted to simply use the random sampling method,
as the performance of our parallel sampling code was fast enough to be practical when the data set was stored on the center-wide Lustre parallel filesystem at the National Center for Computational Sciences at Oak Ridge National Laboratory. For the results discussed later in this paper, we used ten samples of 10% of the size of the entire data set to produce the initial centroid seeds.
2.2. Accelerated k-means clustering
The clustering code we have developed and employed in this study uses a master-slave model of parallelism im-plemented for a message passing environment using the MPI standard. (We note that because the single master can become a bottleneck when many MPI processes are used, we have also developed a fully distributed implementation
[8], but this is not an issue for this study.) Implementation of the standardk-means algorithm, even in parallel, is
fairly straightforward. Our code, however, has some additional modifications [2] that dramatically reduce the time to solution and improve cluster quality. One modification is based on two “acceleration” techniques described by Phillips [9, 10] that can dramatically reduce the time to solution without changing the clustering results. The first technique uses the triangle inequality to eliminate unnecessary point-to-centroid distance computations and compar-isons based on the previous cluster assignments and the new inter-centroid distances. The second technique further
reduces evaluations by sorting inter-centroid distances so that new candidate centroidscj are evaluated in order of
their distance from the former centroidci. Once the critical distance 2d(p,ci) is surpassed, no additional evaluations need be performed, as the nearest centroid is known from a previous evaluation.
Another modification to ourk-means implementation improves cluster quality by moving or “warping” clusters
that become empty to locations in data space where points that are farthest from their current cluster centroids reside. This scheme is implemented by having all slave processes keep track of the farthest (or worst fitting) point for each cluster in its subset of points, which are then passed to the master process. The master process keeps only the farthest point for each cluster it receives from all slave processes, called the “worst of the worst.” At the end of an iteration, if any empty clusters are detected, the master process will sort the list of centroids by the distance to its farthest point. This list is read from the bottom since an ascending sort is performed, and each empty cluster is “warped” to the lo-cation of the point that has the next worst fit, called the “farthest of the far.” When this occurs, the point is reassigned to the newly warped centroid and removed from the cluster to which it was assigned in the current iteration. Because some clusters may have only one member point, those points are not candidates for reassigning to empty clusters. In practice such single-member clusters will sort to the top of the list and are unlikely to be considered since the “farthest distance” will be zero for those clusters.
3. Detection of Adverse Forest Events
Application of our scalablek-means analysis code to the NDVI data set yields six maps, one for each year, that
classify each cell as belonging to one ofkphenoclasses (its cluster membership for that year). We term the phenoclass
assignment of a map cell at a particular time its phenostate. These phenostate maps can be interpreted and viewed as incredibly detailed national vegetation type maps. Unlike traditional vegetation type maps, which are delineated
statistically on the basis of reflectances from a single imaging date, the vegetation types in our maps are differentiated
dynamically on the basis of the differing behavior of the vegetation throughout the year, i.e., differences in the annual
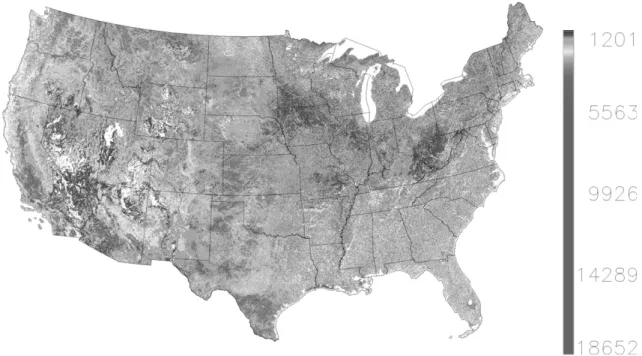
Figure 1: The 2009 map of phenostates (fork =50 phenoclasses) defined for the CONUS derived from geospatiotemporal cluster analysis of MODIS NDVI data.
response (based on the requested level of divisionk) a single area will be further discriminated into the two differently
responding vegetation types. As a result, the time evolution of phenoclass assignment, or phenostate, for every cell in the map indicates a change in the phenological behavior and ecosystem productivity observed at that location due to natural or anthropogenic disturbance, forest regrowth, or ecosystem responses to interannual changes in climate. Comparison of the current phenostate with the nominal behavior of healthy vegetation indicated by the historical phe-noclass assignment at every location in the CONUS forms the basis for an early warning system to locations where the vegetation appears to deviate from its usual phenological behavior. Figure 1 shows the 2009 phenostate map derived
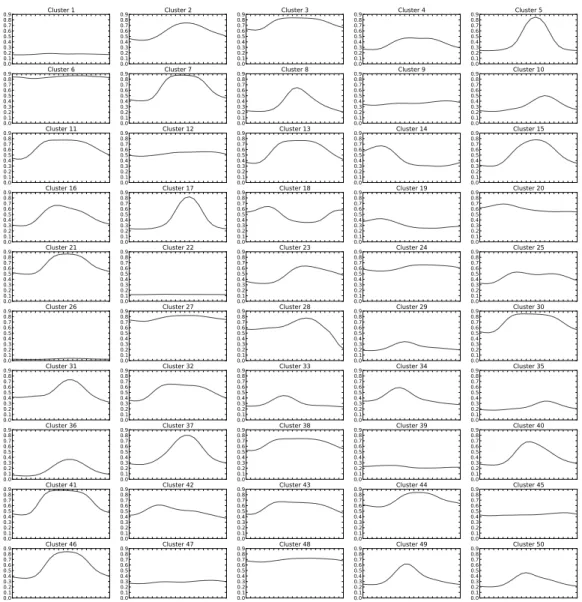
from ak =50 clustering, and Figure 2 displays the phenoclass prototypes (cluster centroids) corresponding to the
possible states a map cell can occupy. It is perhaps not surprising that several physiographic (e.g., mountain ranges,
rivers) and ecological (e.g., different biomes) features are readily discerned; we interpret this as indicating, among
other things, that the quality of our clustering is good. We also note the spatial coherence observed in the cluster assignments, even though remote sensing data are noisy.
A straightforward approach to detecting anomalies using the phenostate maps is to examine the current phenostate compared to historical phenostates at a given map cell, and then flag the present state of a cell as “abnormal” if the cell has very infrequently or never occupied this state in the past. This approach, however, depends strongly on having
chosen an appropriate number of clusters,k. Ifkis too large, then the normal seasonal variation in NDVI will likely
result in a different phenostate assignment each year, leading to many “false positive” commission errors, even though
the different phenostates may, in fact, be very similar. Because the normal seasonal pattern of NDVI varies regionally
and by biome, selecting an appropriate value ofkfor the entire CONUS may not be possible. This simple method
cannot take into account the fact that a newly observed phenostate may, in fact, be very similar to previously observed states at that map cell.
An alternative approach for change detection is to create maps of the “transition distance” between years, plotting at each map cell the Euclidean distance between the new and old phenostate centroids; this distance gives a relative
multivariate measure of how different the observed phenology is between the two years. We show several examples
of such transition maps for various regions below. In all of these maps, we use a histogram equalized color table ranging from blue through cyan through yellow to red. Red locations indicate a large change in phenostate between
Figure 2: Plots of the 50 prototype Phenostates (cluster centroids) from the 2003–2009 NDVI Clustering. For each plot, the vertical axis is NDVI and the horizontal one is time (one year is shown).
the two years. A summary of all of the areas experiencing large transitions over any of the six years of NDVI data for the entire CONUS is shown in Figure 3, which depicts the maximum of all the year-to-year transition distances at each map cell. Such a map becomes somewhat noisy because disturbances at any time over the six observation years are composited, but it is a useful summary, nonetheless. Several forest disturbances (specific examples are examined below) are apparent on the map, although there are many areas with high transition values that are not associated with forest disturbances. Areas of intense agricultural activity tend to exhibit large year-to-year transitions as crops are rotated, etc., as do areas, such as semi-arid grasslands, where precipitation causes rapid vegetation greenup and a smooth annual cycle is not observed. Interpretation of the transition maps for the CONUS is made considerably easier by masking out non-forested areas, though we have not done so here. Alternatively, subtracting the median transition
distance observed for all years at each point can be effective in reducing the visual impact of these areas.
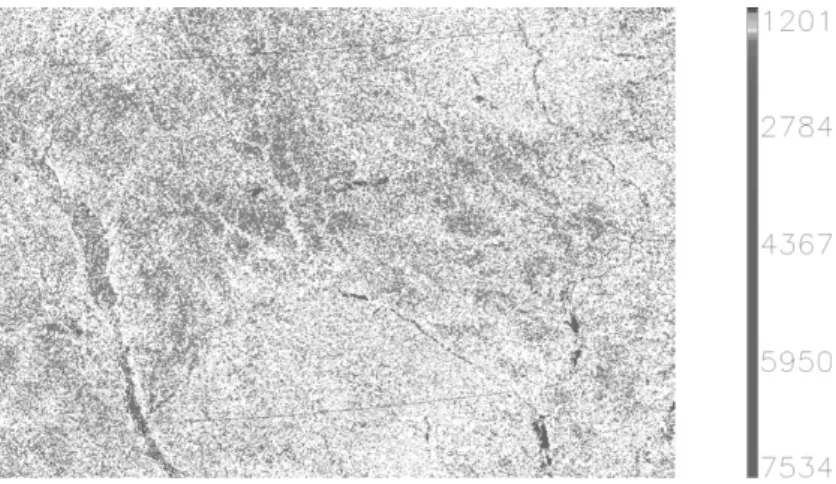
Although we have only conducted preliminary analysis so far, the transition distance maps appear to have con-siderable utility for identifying a number of forest disturbances. One example is shown in Figure 4, which depicts the transition distance between phenostates in the year 2003 and the year 2008 in Colorado, USA. A mountain pine
Figure 3: Maximum transition distance (scaled by 1000) over all year-to-year transitions from 2003–2009 for the CONUS.
Figure 4: The map of relative state-space transition distances for phenoregions between 2003–2008 for Colorado, USA. Values are scaled by 1000.
beetle (MPB) outbreak, which began before 2003 and is still ongoing, has caused significant mortality in Ponderosa and lodgepole pines in Colorado and Wyoming. Areas of high transition distance in the mountains (central and west-ern portions of the state) correspond closely to areas of MPB activity noted by aerial sketch-map surveys, shown as black-outlined polygons in the figure. Given the inexact nature of these surveys, the spatial correspondence between the largest phenostate transitions and the sketch-map polygons is high. The transition distance map shown in Figure 4 may provide a more comprehensive assessment of MPB damage than the sketch-maps. This 2003–2008 transition distance map depicts the cumulative damage by MPB over the entire time period, while year-to-year transition maps for this period (not shown) allow one to chart the yearly progression of the MPB outbreak.
Figure 5: 2006–2008 transition map (left) and adjusted transition map (right) in which the median transition distance over all years at each map cell has been subtracted, with negative values not shown. Values are scaled by 1000. Discrete, hard edged, red areas visible in both maps correspond to wildfires. Subtracting out the median value filters out some of the high transition distances that appear for areas that generally exhibit large year-to-year transitions for all years.
Figure 6: 2006–2008 transition map (values scaled by 1000) for the area around the Okefenokee Swamp on the Georgia-Florida border. Large red areas in the center of the map correspond to fire damage from the Bugaboo scrub fire that burned from April to June of 2007.
Not surprisingly, wildfires are easily detected in the transition distance maps. Figure 5 depicts several wildfires in California in the 2006–2008 time period; shown are the transition distance map, as well as the “adjusted” transition
distance map in which the median transition distance for all years has been subtracted, which effectively filters out
those map cells where high variation in the annual NDVI curve is the norm. Figure 6 depicts damage from the 2007 Bugaboo scrub fire that began in the Okefenokee swamp along the Georgia–Florida border. Damage due to hailstorms, tornados, etc., is also readily apparent. Figure 7 depicts damage from a hail storm on August 9, 2009 in central Iowa.
We expect events involving high mortality, such as wildfires, to be easily discernible. More subtle events, however, are also apparent in the transition maps. Figure 8 shows that vegetation decline due to Hurricanes Katrina and Rita in 2005 is easily discerned in the transition maps (as is subsequent recovery in later years, which is not shown here).
It is apparent from this preliminary work that the year to year transition maps have considerable utility, and that this utility will be increased when combined with information about the direction of the transitions: for instance, transitions to NDVI profiles indicating increased vegetation growth may indicate recovery, while drops in vegetation growth may indicate adverse events. Beyond the year to year transition maps, other clustering-based approaches for
Figure 7: 2008–2009 transition map (values scaled by 1000) depicting damage (linear, red feature trending roughly west to east) along the path of a hailstorm across central Iowa.
Figure 8: 2004–2005 transition map (left) and residual (squared Euclidean distance from cluster centroid) map (right) depicting vegetation decline (bright red areas) along coastal wetlands due to saltwater intrusion caused by Hurricanes Katrina and Rita. (Values are scaled by 1000.) The areas of high transition distance and residual norm occurring along the coastal areas correspond closely to high salinity areas in normally freshwater wetlands reported from field sampling.
profiles, which may indicate adverse events, will tend towards falling into clusters with very few members. This, in
fact, is how the original data quality issues were uncovered in the 2007 NDVI product, when withk= 50 we found
clusters that had very few members, all from year 2007. With the 2007 data set removed from the input, no NDVI
traces are unusual enough to end up in such few member clusters whenk = 50, although increasingkwill make
some anomalous traces apparent. Another approach is to look for NDVI traces that are poor fits to their assigned cluster, as it seems reasonable to expect that adverse events will have anomalous traces that are far from the cluster centroid. The right map in Figure 8 shows the squared Euclidean distance from the NDVI trace at each map cell to its cluster centroid for Louisiana, showing similar patterns to those seen in the transition map in coastal wetlands where hurricane induced salt water intrusion has occurred.
We note that our approaches so far have only made use of the average phenology profile (the centroid) for each cluster, without taking into account information about the range of variation present within each cluster. Identification of profiles that are a poor fit to the correlation structure of the cluster via techniques such as principal components analysis may be useful in identifying anomalous phenologies. We plan to explore other, complementary, techniques based on spectral analysis, as well. Given a library of NDVI profiles known to represent adverse forest events, tech-niques, such as singular value decomposition (SVD), can be used to construct a vector basis for a space of “adverse” NDVI profiles. An NDVI profile can then be classified as indicative of healthy or unhealthy forest based on how well it can be represented using this “adverse” basis.
4. Conclusions and Future Work
Initial results from the geospatiotemporal cluster analysis of annual phenology patterns from MODIS NDVI con-firm its utility for unsupervised change detection in remote sensing data and suggest that it may be successfully implemented as a key component in the FIRST early warning system, which is designed to detect forest threats from
natural and anthropogenic disturbances at a continental scale. The parallel cluster seed generation and enhancedk
-means clustering codes, which can run on computing platforms ranging from small cluster computers to the largest and fastest supercomputers in the world, enable the analysis of very large, high resolution remote sensing data such as these. While determining what constitutes a “normal” phenological pattern for any given location is challenging—due to interannual climate variability, a spatially varying climate change trend, and the relatively short record of MODIS NDVI observations—significant disturbances, like the progressive damage from MPB or vegetation decline due to hurricane induced salt water intrusion, are already easily detectable by simply computing relative transitions between blocks of successive years of phenostates. Moreover, as anomalies are detected and tracked through time, a library of phenostate transitions attributed to pests or pathogens for individual biomes can be built up, allowing the system to hypothesize about the causes of future disturbances detected in functionally similar biomes.
Future work on FIRST will focus on building and verifying the aforementioned library. Additionally, ancillary map layers consisting of ecologically relevant variables such as soil moisture, topography, temperature, and precipi-tation will be constructed and incorporated into the adverse event detection process. Other, complementary detection algorithms will be explored as well. Techniques based on singular value or principal component decompositions are one avenue that will be explored. Finally, adapting the techniques we have been exploring to allow near real-time detection of forest anomalies using the most recently acquired MODIS data is needed to give operational utility to the FIRST system.
5. Acknowledgments
The authors wish to thank Joseph P. Spruce at the NASA Stennis Space Center for providing quality controlled NDVI maps generated from the MODIS MOD 13 product. We thank Shivakar S. Vulli for his work on developing and testing the Bradley method sampling code during an internship at ORNL. This research was sponsored by the U.S. Department of Agriculture Forest Service, Eastern Forest Environmental Threat Assessment Center. This re-search used resources of the National Center for Computational Science at Oak Ridge National Laboratory, which is managed by UT-Battelle, LLC, for the U.S. Department of Energy under Contract No. DE-AC05-00OR22725.
6. References
[1] W. W. Hargrove, J. P. Spruce, G. E. Gasser, F. M. Hoffman, Toward a national early warning system for forest disturbances using remotely sensed phenology, Photogrammetric Engineering & Remote Sensing 75 (10) (2009) 1150–1156.
[2] F. M. Hoffman, W. W. Hargrove, R. T. Mills, S. Mahajan, D. J. Erickson, R. J. Oglesby, Multivariate Spatio-Temporal Clustering (MSTC) as a data mining tool for environmental applications, in: M. S`anchez-Marr`e, J. B´ejar, J. Comas, A. E. Rizzoli, G. Guariso (Eds.), Proceedings of the iEMSs Fourth Biennial Meeting: International Congress on Environmental Modelling and Software Society (iEMSs 2008), Barcelona, Catalonia, Spain, 2008.
[3] F. M. Hoffman, W. W. Hargrove, D. J. Erickson, R. J. Oglesby, Using clustered climate regimes to analyze and compare predictions from fully coupled general circulation models, Earth Interact. 9 (10) (2005) 1–27, doi:10.1175/EI110.1.
[4] W. W. Hargrove, F. M. Hoffman, Potential of multivariate quantitative methods for delineation and visualization of ecoregions, Environ. Manage. 34 (5) (2004) s39–s60, doi:10.1007/s00267-003-1084-0.
[5] F. M. Hoffman, Analysis of reflected spectral signatures and detection of geophysical disturbance using hyperspectral imagery, Master’s thesis, Department of Physics and Astronomy, University of Tennessee, Knoxville (Nov. 2004).
[6] M. A. White, F. Hoffman, W. W. Hargrove, R. R. Nemani, A global framework for monitoring phenological responses to climate change, Geophys. Res. Lett. 32 (4), doi:10.1029/2004GL021961.
[7] P. S. Bradley, U. M. Fayyad, Refining initial points for k-means clustering, in: ICML ’98: Proceedings of the Fifteenth International Conference on Machine Learning, Morgan Kaufmann Publishers Inc., San Francisco, CA, USA, 1998, pp. 91–99.
[8] J. Kumar, R. T. Mills, F. M. Hoffman, W. W. Hargrove, Parallel k-means clustering for quantitative ecoregion delineation using large data sets, in: Proceedings of the Eleventh International Conference on Computational Science (ICCS 2011), Tsukuba, Japan, 2011, to appear. [9] S. J. Phillips, Acceleration of k-means and related clustering algorithms, in: D. M. Mount, C. Stein (Eds.), ALENEX ’02: Revised Papers
from the 4th International Workshop on Algorithm Engineering and Experiments, Springer-Verlag, London, UK, 2002, pp. 166–177. [10] S. J. Phillips, Reducing the computation time of isodata and k-means unsupervised classification algorithms, in: Geoscience
and Remote Sensing Symposium, 2002 (IGARSS’02), Vol. 3, 2002, pp. 1627–1629, doi:10.1109/IGARSS.2002.1026202.