MULTI COLOUR GRANITE QUARRY
Category B2
PROPONENTM/s Pokarna Granite
SANJA DAGA
Managing Partner
105, Suriya Towers, Sardar Patel Road,
Secunderabad, Telangana, India
Pincode- 500 003
Ph: +914027896361/7722, +919751373585 E-mail: contact@pokarna.com
CONSULTANT
SURIYA MINING SERVICES
NABET/QCI Accredited EIA Consultant,
3
/216, K.S.V.Nagar, Narasothipatti, SALEM-4.
Phone (0427) 2440446, Cell: 09842729655
Email: ceo@suriyamining.com, suriyakumarsemban@gmail.com
www.suriyamining.com
2016
EXTENT: 2.980 HAS.F.NO:
568/1,575/2(p), 621/2(p) VILLAGE: SUBRAMANIAPURAM TALUK : SIVAKASI DISTRICT: VIRUDHUNAGARENVIRONMENT CLEARANCE SUMMARY
S. No
Particulars Description
1. Name of the Owner/Firm M/s POKARANA LIMITED
2. Location of the quarry- S.F. No. Subramanipuram Village, Sivakasi Taluk, Virudhunagar District, Tamil Nadu.
3. Purpose of Application Proposal for Environment Clearance for Quarrying MULTI COLOUR GRANITE QUARRY.
4. Extent of quarry in Ha- 2.98.0 hectares 5. Modernization/New Existing
6. Ownership Own Patta land
7. Topo Sheet No. Topo Sheet No. : 58 G/15 8. Latitude / Longitude –
DGPS (Co-ordinates)
PILLAR
NAME LATITUDE LONGITUDE
1 090 23’14.96421”N 77050’12.96351”E 2 090 23’15.337479”N 77050’10.89368”E 3 090 23’19.65530”N 77050’11.32549”E 5 090 23’16.47663”N 77050’22.79395”E 6 090 23’12.93841”N 77050’21.94637”E 7 090 23’13.40202”N 77050’19.78584”E
9. Topography of MSL area The lease hold area is a plain ground. The deposit is a sub-surface one with topsoil cover. Major portion of the area applied for lease is covered by soil. The black cotton soil s thickness varies from 0.5Mts to 2.5Mts. The variation in water table in the area is 20Mts to 5Mts, in summer and winter respectively. The area receives rain fall mostly during North-East Monsoon and the average rain fall in about 600m.m per annum. The climate is dry and temperature raise up to 41○C in summer and is around 23○C in winter season. The wind direction in North East-South West and vice versa. They are some active granite quarries surrounding this leased hold area.
10. Land Use Pattern The area is a flat terrain with gentle slope from north to south. The regional crops are maize, groundnut, etc...
Quarrying Area – 1.50.0 Hectares Dumping Area – 0.48.0 Hectares
Afforestation & Safety Zone – 1.00.0 Hectares 11 Method of Mining Open cast semi-mechanized mining using Hydraulic
excavator and tippers in combination
12 Production (quantity in m3) Production Schedule is proposed as 100cbm/year.
Description Quantity Geological reserves 59600 M3
Mineable reserves 23000 M3
13 Overburden/Waste Year Topsoil &
Weathered Granite Mineral Rejects 80% of ROM Total Waste I 240 400 640 II 200 400 600 III 200 400 600 IV 200 400 600 V 200 400 600 Total 1040 2000 3040
14 Period of Lease 20years
15 Climatic condition Average Rainfall – 600mm per annum. Summer up to - 41°C
Winter up to– 23°C
16 Water table 15 m below ground level
17 Water requirement Total Water requirement of the mining operations including dust suppression is about 6.5KLD and majority of this is proposed to be met from the bore well.
18 Nearby lake / river/ odai/ channel etc. There is no major river, pond, etc… are found around 500m radius. A Seasonal odai track is flowing center of the lease area both of side leaving 10meters safety distance is provided.
19 Waste water No generation of waste water.
20 APC Measures Dust expected to be generated from hauling roads, place of excavation etc will be suppressed by periodical wetting of land by spraying.
Subramaniyap uram
1000 SW 2.5kms Ottampatti 500 NE 1km Vetrilayurani 500 SE 4.5kms
22 Man power 18 employees
23 Ariel distance from Reserve forest, Sensitive areas, Forest, Bird sanctuaries, Wild
life sanctuaries, National parks, Monuments etc., within 15km
There is no Reserve forest is situated about 10 kms.. There is no Wildlife Sanctuary is located within 10kms radius.
Bird Sanctuaries – Nil Wild life sanctuaries - Nil Monuments – Nil
24 Interstate boundary Nil
25 Precise area statement Approved by Government Letter No: 1475/MMB2/2006-1, dated 23.10.2006
26 Mining plan Prepared by Approved by
J.RAJANNA RQP/MAS/169/2002A.
From the Commissioner and Director of Geology and Mining, Guindy, Chennai Letter. No. 14083/MM2/05 dated 10.01.2007
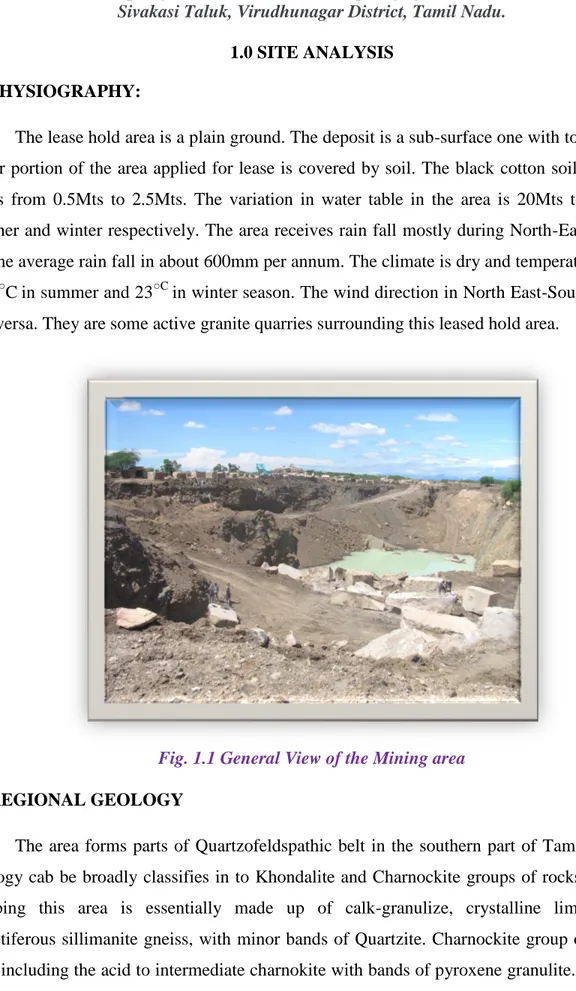
1.0 SITE ANALYSIS 1.1 PHYSIOGRAPHY:
The lease hold area is a plain ground. The deposit is a sub-surface one with topsoil cover. Major portion of the area applied for lease is covered by soil. The black cotton soil s thickness varies from 0.5Mts to 2.5Mts. The variation in water table in the area is 20Mts to 15Mts, in summer and winter respectively. The area receives rain fall mostly during North-East Monsoon and the average rain fall in about 600mm per annum. The climate is dry and temperature raise up to 41○C in summer and 23○C in winter season. The wind direction in North East-South West and vice versa. They are some active granite quarries surrounding this leased hold area.
Fig. 1.1 General View of the Mining area
1.2 REGIONAL GEOLOGY
The area forms parts of Quartzofeldspathic belt in the southern part of Tamil Nadu and Geology cab be broadly classifies in to Khondalite and Charnockite groups of rocks. Kondalite grouping this area is essentially made up of calk-granulize, crystalline limestone and garnetiferous sillimanite gneiss, with minor bands of Quartzite. Charnockite group on the other hand including the acid to intermediate charnokite with bands of pyroxene granulite. Both group
of rocks were later migmatised and reconstituted giving rise to grey colored migmatite comprising Hornblende biotite gneiss, as well as garnet biolite gneiss and garnetiferous quartz-feldspathic granulite. The intrusion of younger pink granite as well as pink migmatitic gneiss and pink augen gneiss. The white garnetiferous sillimanite gneiss while the pink augen gneiss is due to blastic growth of pink potash feldspar augens with in the grey gneiss. A number of minor pegmatite and quartz veins repsent the last stage intrusive activity in the area. The fine/medium grained pink granite gneiss *(with or without garnet) seen in this area as alternate layers (lines) of mafic and yellow/orange/pinkish color forms the beautiful appearance similar to “Rawsilk”. The tentative geological succession of the rock type is as follow:
Topsoil : Recent
Pegmatite and Quartz veins, pink : Anchean Fine/medium grained : Anchean
Granite/gneiss : Anchean
Quartz feldspathic granite : Anchean
Peninsular gneiss : Anchean
1.3 GEOLOGY OF THE PRECISE AREA
The area applied for lease mainly composed of pink granite gneiss with of without garnet has the fine/medium silky texture and light yellowish pink yellow/ orange color of the rock. The deposit is a sub-surface deposit. The rock strikes North 6○ East and South 60○ West with steep dip. Strike and diagonal joints are seen.
The typical land specimen is light yellowish pink in color with silky texture, fine to medium grained, consist mainly quartz, feldspar and less amount of mafic minerals like biolite mica. Even through the rock type appears has raw type, it s not similar to raw silk type area of Thiruvathvar since, this rock contains more of mafic lines. In few places the outcrops showed grey color of more than the pink/ orange color and looks as grey /granitic gneiss.
Fig.1.2 Texture and Colour of Sivakasi Yellow/Gold granite
1.4 DRAINAGE PATTERN OF THE AREA
The area of flat terrain with gently sloping from north to south so natural drain towards south. Sub-surface water collection in rainy season is stored in deeper pit in the adjoining area and dewatered with the help of pumps to the natural drainage.
1.5 CLIMATIC CONDITIONS
The district receives the rain under the influence of both southwest and northeast monsoons. The northeast monsoon chiefly contributes to the rainfall in the district. Most of the precipitation occurs in the form of cyclonic storms caused due to the depressions in Bay of Bengal. The southwest monsoon rainfall is highly erratic and summer rains are negligible. Rainfall data from seven stations over the period 1901-2000 were utilized for analysis and a perusal of the data shows that the normal annual rainfall over the district varies from about 724 to 913 mm. Average rain fall is reported as 812mm per annum. It is minimum around Sathur in the south eastern part of the district. It gradually increases towards west, north and northwest and attains a maximum around Watrap. The district enjoys a subtropical climate. The period from April to June is generally hot and dry. The weather is pleasant during the period from November to January. Usually mornings are more humid than afternoons. The relative humidity is on an average between 65 and 85% in the mornings. Humidity in the afternoon is generally between 40
and 70%.The annual mean minimum and maximum temperatures are 23.78 and 33.95° C respectively. The daytime heat is oppressive and the temperature is as high as 40.2°C. The lowest temperature recorded is of the order of 19.3° C.
1.5.1 Summers
The sun is at its glory and shines very brightly during the summers. During the summer months, i.e. from May to June, the temperature varies between 27 deg C and 40 deg C.
Therefore, the climate is quite hot. May is the hottest month. Cottons are recommended during this time.
1.5.2 Winters
In winters, which starts from December and lasts till February, the temperature ranges between 20° C and 30° C. The climate remains pleasant during this time, as the temperature rarely falls below 20° C.
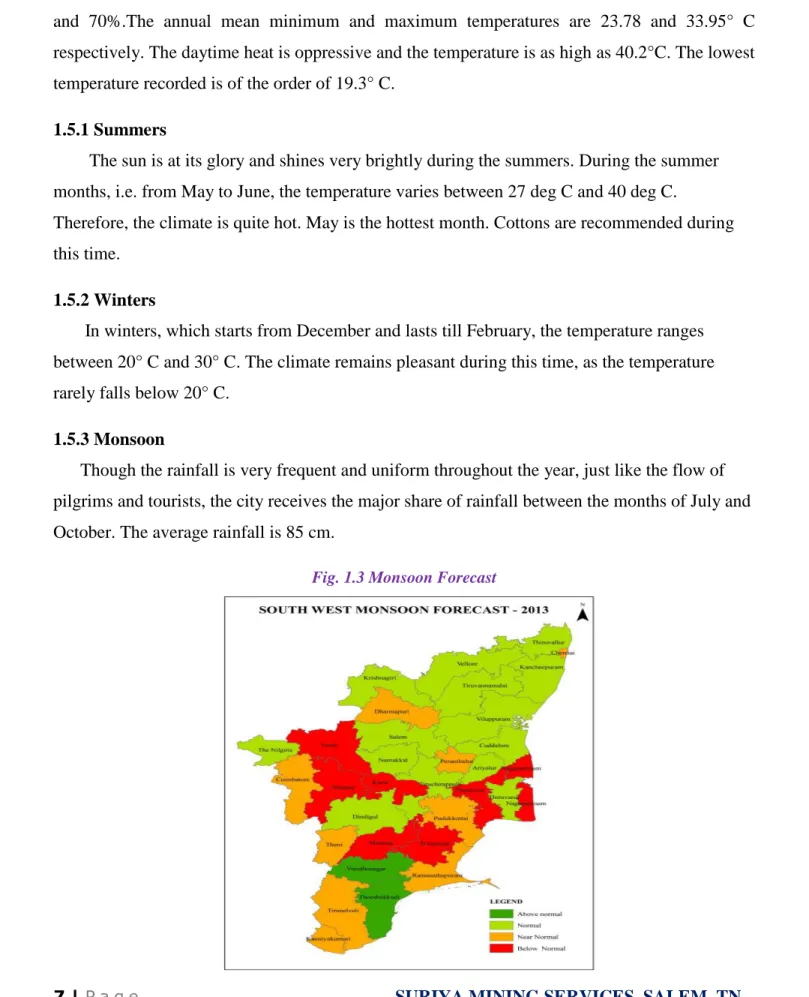
1.5.3 Monsoon
Though the rainfall is very frequent and uniform throughout the year, just like the flow of pilgrims and tourists, the city receives the major share of rainfall between the months of July and October. The average rainfall is 85 cm.
1.6 LAND USE PATTERN
The area is a flat terrain with gentle slope from north to south. The regional crops are maize, groundnut, etc... Dumping of the waste is shown in plate no. 6 & 7.
Table 1.1 Land Use Pattern
S. No Description Present area (Ha)
1 Mining Area 1.50.0
2 Dumping Area 0.48.0
3 Afforestation & Safety Zone 1.00.00
Total 2.98.0Ha
1.7 AIR ENVIRONMENT
The impacts on air environment from a mining activity depend on various factors like production capacity, machinery involved, operation and maintenance of various equipments and vehicle. Apart from these, there will be other activities associated via transportation of mineral and waste, stocking facilities and dump management within the mine lease area that may contribute to pollution. The quarrying operation is limited to small area and there is no air pollution due to quarrying and quality of air does not change.
The existing ambient air quality data in the mine has been assessed by keeping in view of the meteorological condition of the plant area. Pre-calibrated fine particulate sampler and respirable sampler have been used for monitoring the existing AAQ.
The Ambient Air Quality study was carried out for the significant parameter viz, particulate matter 2.5 (PM 2.5), Respirable particulate matter (PM10), SULPHUR DIOXIDE (SO2) and oxide of nitrogen (NOX). The estimated valve for the parameters monitoring are represented in below table and the analyzed different parameters are within the limits prescribed by T.N.P.C.B.
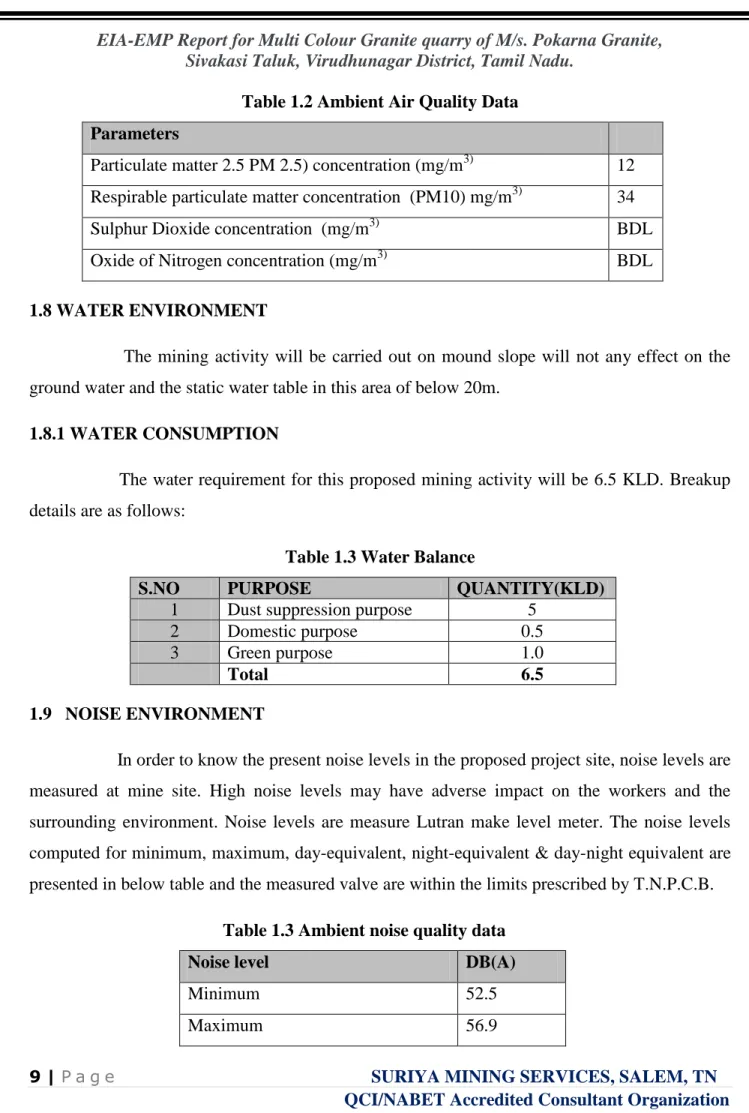
Table 1.2 Ambient Air Quality Data Parameters
Particulate matter 2.5 PM 2.5) concentration (mg/m3) 12 Respirable particulate matter concentration (PM10) mg/m3) 34
Sulphur Dioxide concentration (mg/m3) BDL
Oxide of Nitrogen concentration (mg/m3) BDL
1.8 WATER ENVIRONMENT
The mining activity will be carried out on mound slope will not any effect on the ground water and the static water table in this area of below 20m.
1.8.1 WATER CONSUMPTION
The water requirement for this proposed mining activity will be 6.5 KLD. Breakup details are as follows:
Table 1.3 Water Balance
S.NO PURPOSE QUANTITY(KLD)
1 Dust suppression purpose 5
2 Domestic purpose 0.5
3 Green purpose 1.0
Total 6.5
1.9 NOISE ENVIRONMENT
In order to know the present noise levels in the proposed project site, noise levels are measured at mine site. High noise levels may have adverse impact on the workers and the surrounding environment. Noise levels are measure Lutran make level meter. The noise levels computed for minimum, maximum, day-equivalent, night-equivalent & day-night equivalent are presented in below table and the measured valve are within the limits prescribed by T.N.P.C.B.
Table 1.3 Ambient noise quality data Noise level DB(A)
Minimum 52.5
1.10 BIODIVERSITY
Flora as observed and identified in the field are covered by photograph and shown below. Mostly Nona tree, Palm tree, acacia, neem and karuveli etc… are found more on regional scale. The applicant has developed trees like Casuarinas, Eucalyptus etc with proper nursery garden and plantation on vacant land. Fauna is represented by rabbits, rat, scorpion, millipedes etc…
Fig. 1.4: a) Nona Tree b) Acacia Bushes
Flora is represented by herbs and shrubs of local species and free regional trees and their botanical terms are given as under with numbers.
1.10.1 TREES
S. No Name of trees Botanical Name Number Remarks 1 Vembu Azadirachta indica 8 Growing well
2 Nona Morinda tinctoria 37 “
3 Palmera Borassus flabelly 10 “
4 Bushes Acacia Nilotica 25 “
1.10.2 SHRUBS
S. No Local Name Botanical Name
1 Korai Elacocarpus aerratas
2 Erukku Calotrophis gigantea
3 indumul Pterolobium indicum
1.10.3 HERBS
S. No Local Name Botanical Name 1 Poolai poondu Aerva lanata
3 Thumbai Leucas aspera
4 Peru Nerunji Pedalium murex
5 Kantangkathri Solanum xanthocarpum 6 Nerunji Tribulus terrestris
1.10.4 LIST OF CULTIVATES CROPS IN THE CORE ZONE (500m)
S. No BINOMIAL ENGLISH NAME TAMIL NAME
1 Cocos nucifera Coconut Thennai
2 Teak Tectona grandis Tekku 3 Casurina Casuarina equisetifolia Savukku
1.11 SOCIO-ECONOIMC ENVIRONMENT
The mine area does not cover any habitation. Hence the mining activity does not involve any displacement of human settlement. No public building, places, monuments etc are not found within the lease area or in the vicinity. The mining operation will not disturb/ relocate any village or need resettlement.
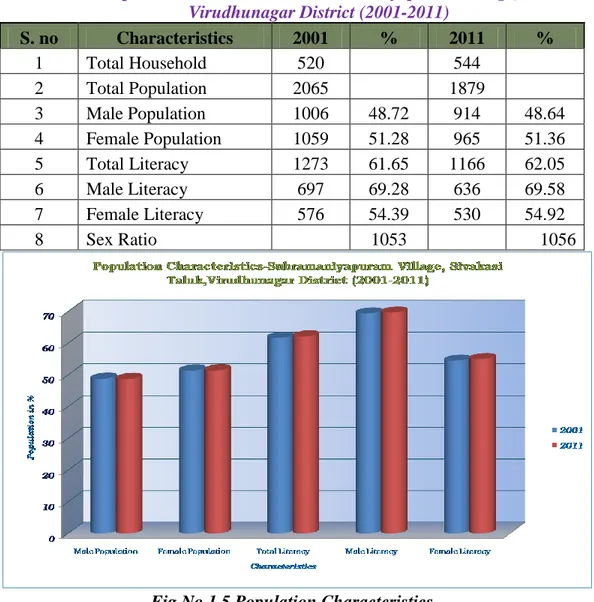
1.11.1 POPULATION CHARACTERISTICS –SUBRAMANIYAPURAM VILLAGE
In Sivakasi taluk, Subramaniyapuram village had a total household 520 in 2001 which is increased 544 in according to census 2011. Village had a total person of 1879 in 2011 census previous census 2065 persons in 2001. There were about 914 men (48.72%) according to 2011 census and 1006 men (48.72%) in 2001 census marking an decrease of 92 men over the previous census. During 2001 there were about 1059 women (51.28%), which decreased to 965 (51.36%) in 2011 census.
Subramaniyapuram village had a literate accounted for 1273 persons (61.65 %) in 2001 and increased to 1166 persons (62.05%) in 2011. There were about 69.28 percent males in 2001 and 69.58 percent in 2011. There were about 576 (54.39%) females decreased to 530 (54.92%) classes as literates in 2011.
Sex composition is the most important demographic characteristics that affect the incidence of birth and death. The average sex ratio in Sivakasi Taluk, Subramaniyapuram village was 1053 during 2001 and increased in 1056 the year of 2011. The highest sex ratio may be either due to the migrants for educational purpose and employment opportunities and due to infant birth of female is very high.
Table No: 1.4 Population Characteristics-Subramaniyapuram Village, Sivakasi Taluk, Virudhunagar District (2001-2011) S. no Characteristics 2001 % 2011 % 1 Total Household 520 544 2 Total Population 2065 1879 3 Male Population 1006 48.72 914 48.64 4 Female Population 1059 51.28 965 51.36 5 Total Literacy 1273 61.65 1166 62.05 6 Male Literacy 697 69.28 636 69.58 7 Female Literacy 576 54.39 530 54.92 8 Sex Ratio 1053 1056
Fig No.1.5 Population Characteristics
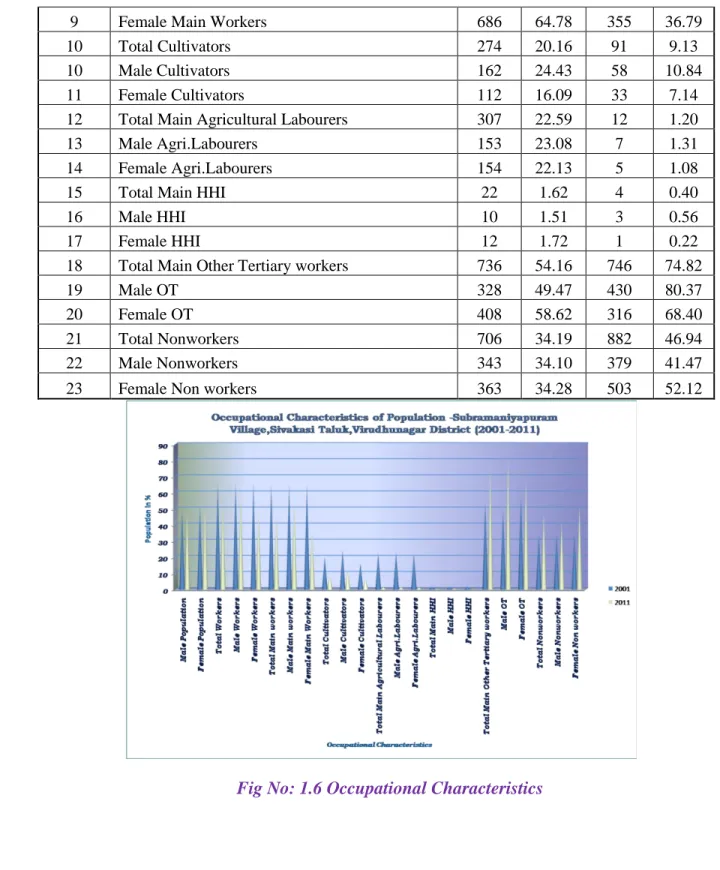
1.11.2 OCCUPATIONAL CHARACTERISTICS- SUBRAMANIYAPURAM VILLAGE
The term workers denote the population engaged in primary, secondary and tertiary activities classified in the census reports of Indian government. During the year 2001 Subramaniyapuram village had 1359 workers accounting for 65.81 percent of the total
population of the Village. During 2011 there were about 997 (53.06%) according to the census. There were about 663 men (65.90%) during 2001 which is decreased 535 persons (58.43%) according to census 2011. There were about 696 (65.72%) female according to 2001 which is decreased 462 (47.88%) female during 2011 marking a decrease of 234 women over the previous census.
In Subramaniyapuram village had a total main workers accounted of 1339 (64.84%) persons during 2001 census which is decreased 853 (45.40%) persons during 2011. There were about 653 (64.91%) women in 2001 and 498 (54.49%) women according to the census 2011 marking decreases of 155 women over the previous census.
Study on occupation characteristics of population should analyze the workforce engaged in different type of occupation. Cultivators are the major category of occupation representing the workforce owning land. Subramaniyapuram village had total cultivators 274 (20.16% of the total workers) cultivators. The proportion of cultivators to total workers is calculated as a percent for the two census years 2001 and 2011 for the taluk of Sivakasi in Subramaniyapuram village. There were about 162 (24.43%) men in 2001 which is decrease 58 (10.84%) according to census 2011. Subramaniyapuram village had female cultivators 112 (16.09% of the female workers) cultivators during 2001 census which is decreased 33 (7.14 %) during according to census 2011.
The distribution of agricultural laborers in the study area for the two census periods has revealed that the study area has experienced a decline in the proportion of workers classed as agricultural laborers between 2001 and 2011. Sivakasi taluk in Subramaniyapuram village had agricultural labourers 307 (22.59 % of the total workers) agricultural labourers during census 2001. There were about 153 (23.08 % of male workers) men in 2001 which is decrease 7 (1.31% of male workers) according to census years 2011. Subramaniyapuram village had female agricultural laborer decreased 5 (1.08%) census 2011 compare to the previous census year 2001 about 22.13% of female workers.
This group includes the employment of workers in manufacturing activities. Agro based industries, located in the study area engages a sizeable amount of workers. The distribution of secondary workers in the study area is calculated as percent to the total workers.
The proportion of secondary workers to total workers has experienced decreasing trend in the Subramaniyapuram village area between 2001 and 2011. Secondary workers during 2001 and 2011 it could be stated that this may be due to the opening of a number of manufacturing units in the study area.
The tertiary workers include the labour force engaged in service sector such as education, medical, judicial, finance, administration, recreation, trade and commerce and transport. In Subramaniyapuram village had tertiary workers accounted for about 54.16 percent of the workers during 2001 census it is increased 74.82% according to census 2011. There were about male tertiary workers of 328 (49.47% of the male workers which is increases 430 (80.37% of the male workers) according to census 2011. There were about 408 women tertiary workers (58.62 % of the female workers) during 2001census which is almost equally increased to (68.40 % of the female workers) according to census 2011. The study area has experienced a change in the occupational structure in the form of a decline in the proportion of cultivators, agricultural laborers and an increase in the proportion of tertiary workers.
In Subramaniyapuram village had non workers population accounted of 882 (46.94% of the total population) according to census 2011. Which is decreased from previous census 2001 had population 706 (34.19%). There were about male non workers of (34.10% of the male population) during the census 2001. Which is increased 379 (41.47 % of the male population) according to census 2011. Because of more number of people are educated most of people living the village had cracks industries money earn our daily life.
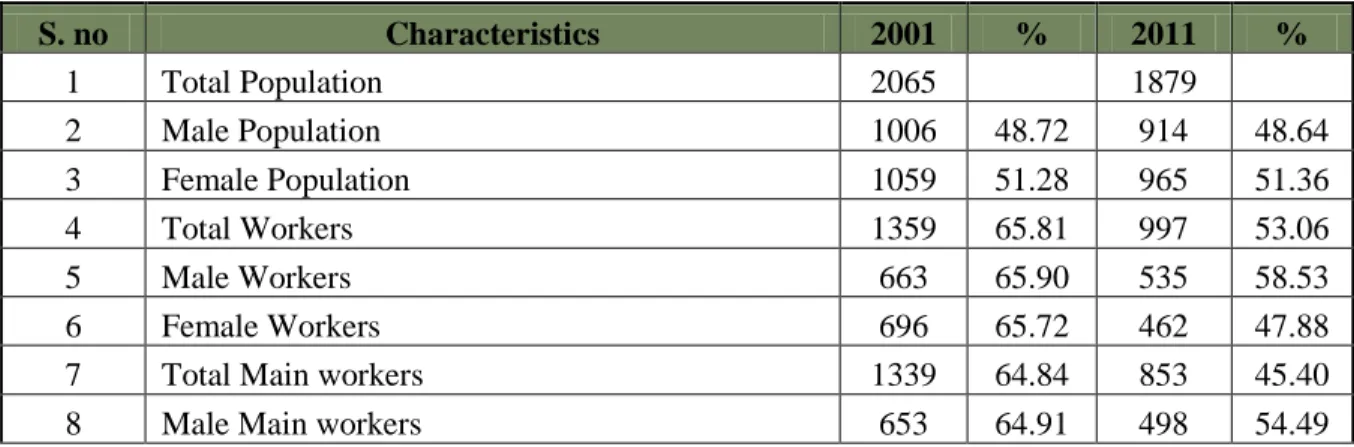
Table No: 1.5 Occupational Characteristics of Population -Subramaniyapuram Village, Sivakasi Taluk, Virudhunagar District (2001-2011)
S. no Characteristics 2001 % 2011 % 1 Total Population 2065 1879 2 Male Population 1006 48.72 914 48.64 3 Female Population 1059 51.28 965 51.36 4 Total Workers 1359 65.81 997 53.06 5 Male Workers 663 65.90 535 58.53 6 Female Workers 696 65.72 462 47.88
7 Total Main workers 1339 64.84 853 45.40 8 Male Main workers 653 64.91 498 54.49
9 Female Main Workers 686 64.78 355 36.79
10 Total Cultivators 274 20.16 91 9.13
10 Male Cultivators 162 24.43 58 10.84
11 Female Cultivators 112 16.09 33 7.14 12 Total Main Agricultural Labourers 307 22.59 12 1.20 13 Male Agri.Labourers 153 23.08 7 1.31 14 Female Agri.Labourers 154 22.13 5 1.08
15 Total Main HHI 22 1.62 4 0.40
16 Male HHI 10 1.51 3 0.56
17 Female HHI 12 1.72 1 0.22
18 Total Main Other Tertiary workers 736 54.16 746 74.82
19 Male OT 328 49.47 430 80.37
20 Female OT 408 58.62 316 68.40
21 Total Nonworkers 706 34.19 882 46.94
22 Male Nonworkers 343 34.10 379 41.47
23 Female Non workers 363 34.28 503 52.12
2.0 EVALUATION OF IMPACTS
Opencast mining activity causes some adverse impacts on the surrounding environmental unless proper environmental management plan is adopted. Selecting suitable sites for mining and adopting the guidelines prescribed by the Ministry of Environment, Forest & Climate Change (MoEFCC) and Indian Bureau of mines (IBM), one can minimize the major possible impacts.
In this chapter, an attempt has been made to quantify the possible environmental impacts on various features such as air, water, noise, land, ecology and socio-economics. The following aspects have been studied to identify the possible impacts while achieving the total production of 100 cum/Year of colored Granite.The magnitude and significance of the environmental pollution caused by mining depends on method of mining, scale and concentration of mining activity.
2.1 AIR ENVIRONMENT
Mining is carried out by open cast semi mechanized methods using jack hammer drilling & wire saw cutting and using low explosive blasting. Based on the various operation involved in the production of minerals, the various emission sources has been identified as given below.
a. Point sources b. Area sources. c. Line sources.
Drilling operation of the mine is considered as point sources. Extraction of minerals from mine, are considered as area source. Transportation of materials from mining benches to various end points is considered as line sources. The impacts of above sources on air environment are discussed below.
a) Drilling & blasting
The concentrations due to low explosive blasting will be confined to a maximum distance of 10m from the area of blasting. These concentrations will not emit
continuously. However presence of personnel near the blasting site during blasting will be totally avoided. So, the impacts of blasting on the air environment will be minimal.
b) Extraction & loading:
Extraction & loading will be done by a crane and excavator and these activities of mine operation is contributing to the area source emission and the extend influence of this operation is about 100m2
c) Haulage & transportation
In this operating mine, the dressed block form face to the consumers is transported by hired trucks. The trucks will be well maintained so that exhaust smoke does not contribute abnormal valves of noxious and unburnt hydrocarbons. The other sources of air pollution are due to the dust generated during the movement of tippers on the haul road.
The above source, which includes drilling, low explosive blasting excavation, and haulage for transport of blocked, will contribute to dust pollution in the air.
2.1.1 ANTICIPATED IMPACTS
The impacts envisaged due to mining activity are evaluated based on various factors the emission inventory of the pollutants is as follows, the main air pollutant would be dust or particulate matter generated by handling and transportation of colored granite. But the impacts of mining operation on air quality is minimum as mining involved methods by using jackhammer drilling & wire saw cutting & low explosive blasting and as the production quantity is very less i.e.0.4 Cum/day only.
The maximum concentration of particulate matter (PM 10) recorded in mine lease is 34µg/m3. The envisaged production of minerals is only 0.4 cum/Day. Prediction levels of PM10 were found to be within permissible limits. Anticipated impacts is assessed by considering increase of 10 % in core zone on the PM10 levels due to the mining operation and the following table shows the overall scenario. The dust generated due to mining operations will be controlled by water sprinkling through water tankers.
OVERALL SCENARIO
Particulars Concentration (µg/ m3 ) Core Zone Baseline concentration 34
Predicted concentration 3.4
Overall scenario 37.4
Specified NAAQ Limits 100µg/m3
2.2 NOISE ENVIRONMENT
Noise will be produced at the mine is due to operation of machinery, drilling blasting, and movement of vehicles. The noise generated by the mining activity is dissipated within a small zone around the mine. There are no major impacts of the mining activity in the vicinity however; pronounced effect of above noise levels will felt only near the activity working area and on the personnel working in the vicinity. The impacts of noise on the village are negligible as the villages are located far from the mine site.
2.3 WATER ENVIRONMENT
The water regime is unpolluted by any external source, quarrying will not have any impact on water regime.
2.3.1 IMPACT ON SURFACE WATER
There are no major streams and rivers, which can get affected by the mining. Hence there will be no effect on the surface water. During the plan period quarrying will go to depth of 8 meters from the present level of mining. During the monsoon period, the rainwater, if gets stagnated, will be drained out. The benches will made with an inward slope to facilities run off faster on to the mine floor. Small bunds, garlands and silting tanks also will be constructed to minimize inflow muddy water which carries fine materials.
2.3.2 IMPACT ON GROUND WATER
Mining activity will be above the BWL (20m). Hence, there will be no effect on the ground water regime.
2.3.3 IMPACT ON WATER QUALITY
Water quality in the buffer zone has indicated that the ground water is free from heavy metal concentration and these mining activities will not interference on the water quality. There is no generation and discharge of waste water from this mine.
2.4 LAND ENVIRONMENT
Various components of land environment have been identified for study fo impacts mine operations. Details of the same are given below:
2.4.1 SOLID WASTE GENERATION
Removal of weathered rock and the rock waste is the only solid waste that will be generated from this mine. Some of the materials from the waste may be sorted out and used for making small blocks to be used by the local unit for making tiles. The markets for tiles are good at the moment and they will offer a better substitute for marble in terms of price and quality. Some rejected and unsorted materials may be used in the civil engineering projects in the vicinity of the area. The waste materials can also be crushed into smaller sizes and can be used as road metal.
The waste generated during the five years dumped in the zone separate reserved for during within the Q.L. area. The dump is designed in such a way that it will have slopes equal to the angle of repose of such materials. Garland drains have to be sunk along around the leading edge of the dump. A retaining wall will be constructed around the dump to preventing the slanting of boulders care will be minimizing the waste generation at the source. About 608 m3/Year of waste will be generated from this mine. The topsoil, weathered granite and granite waste will be dumped along the boundary southern side of the lease hold area (safety zone).
2.4.2 IMPACT ON LAND USE
The mine is located in an area of 2.980Ha.No forestland is involved. It may not be possible to complete regain the original topography of the area. During quarrying whatever solid waste is generated shall be dumped at dumping site in outside the Q.L. area. The mining lease area is not a part of any type of forest. Entire mine lease area is govt. land hence all the impact on land use is positive because aesthetic environment will not be effected, as the mine is located on a plain with some bushes.
There is no forest area located within 10km from the lease boundary. Due to opencast mining activities, the landscape will be slightly changed. There will be no land subsidence as the country is made up of hard rock. The soil cover in this mine is almost nil and agriculture is seen mainly in the plains in the vicinity of the lease area and the mining will not have any impact on the agricultural pattern. Only few bushes will be cleared to facilitate mining and other related activities and there are no big trees, which may have to be cut.
2.4.3 IMPACT OF GROUND VIBRATION
Fragmentation of rock by blasting is an important operation in mining project, where hard rock occurs. Blasting will be done only when it is absolutely necessary, using low intensity explosives. Blasting of the minerals at the proposed mine will be done by using low-density chemical explosive like ECM/CaOH will be used. Sometimes smooth blasting may be done using silent non- explosive demolishing agents like Acconex. The ground vibration caused by blasting will not have any affect as the mining is on a mound and the vibrations will be minimum and will not be carried too far due to the hard nature of the rock.
2.5 BIOLOGICAL ENVIRONMENT
There is no adverse impacts are anticipated due to the proposed mining activity on biological environment. However with the implementation of the environment management measures, there will be improvement in the parameters of biological environment.
The tree species found with the core zone represent the common type of flora species along with small shrubs and bushes. Due to mining activities community structure of the
vegetation will not change, whereas diversity of plant species and food web index of the area compared to the existing level.
2.6 SOCIO ECONOMIC ENVIRONMENT
It will be obvious to assume that the activities of the mining operation have to be produced some improvement in the socio-economic levels in the study area. The lessee will provide employment to local population and it will give preference to the local people whenever there is requirement of manpower.
The proposed mining activities will provide employment to persons of different skills and trades. The local population is the largest plausibility among these employees. The employment potential ameliorated economic conditions of these families directly and provided employment to many other families indirectly who are involved in business and service oriented activities. This in-turn will improve the socio-economic conditions of the area.
2.7 OCCUPATIONAL HEALTH AND SAFETY
The mine is going to be developed mainly semi mechanized opencast method by using jackhammer drilling, wire saw cutting & low explosive blasting. No major crushing or pulverization will be done here. The small- scale mining will not have any ill effects on labour.
Excessive dust and noise are the chief health hazards for the miners. As already mentioned these causative factors are well within the safety limits and the proponents will strictly implemented the prescribed safety measures. The health of the workers will be regularly checked and suitable medical facilities should be created on or close to the site. Highest safety will be ensured in the working conditions of the miners.
3.0 ENVIRONMENTAL MANAGEMENT PLAN
The mining development in the study area needs to intertwine with judicious utilization natural resource within the limits or permissible assimilative capacity. The assimilative capacity of the study area is the maximum amount pollution load that can be discharged in the environment without affecting the designated use and is governed by dilution, dispersion and removal due to natural physio-chemical and biological processes. The environment management plan (EMP) is required to ensure sustainable development in the study area.
This section discusses the management plan for mitigation/abatement impacts and enhancement of beneficial impacts due to mining. The environment management plan (EMP) has been designed within the framework of various Indian legislative and regulatory requirements on environment and socio-economic aspects. Environmental management plan giving the environmental protection measures at mine to meet the stipulated norms of IBM/MoEF&CC are as detailed.
3.1 AIR POLLUTION CONTROL MEASURES
The present ambient air quality measurement in the mine area are well within the limit due to the proposed production of 100 Cum/Year of colored granite, there will be marginal increase in dust concentration.
Mitigative measures suggested for air pollution control are based on the baseline ambient air quality monitoring data. From the point of view maintenance of an acceptable ambient air quality in the region, it is desirable that air quality should be monitoring on a regular basis to check the standards prescribed by CPCB and in cause of non-compliance appropriate mitigative measure shall be adopted.
The following dust prone areas are identified for adopting control measure in the mine area. 1) Drilling & wire saw cutting blasting
2) Excavation 3) Transportation
The environmental control measures which will be implemented to control the fugitive dust release from the proposed production are given below:
Wet drilling system & dust proof
Optima wire saw cutting ( using water - reduces dust )
Use of sharp drill bits for drilling holes. The charge concentration of the explosive will be between 10- 40 grams per linear meter.
Water sprinkling arrangement such as specially fabricated tankers mounted in tipper are deployed at mine site to control; the fugitive dust generation from the haulage roads.
Regular grading of haul roads service to clear accumulation of loose materials.
The blasted blocks (Temporary) are wetted by spraying water.
Avoiding blasting during high windy periods, times and temperature inversion periods.
Excavation operations are suspended during periods of very strong winds.
Massive afforestation for control of dust.
Spraying of water on sub grade stacks.
The vehicle and machinery are kept in well –maintained so that emission of fugitive constitute is minimized.
Plantation of wide leaf trees, creepers, tall grass around working pit, along roads will help suppress dust.
Tall trees with an average height of 5m will be developed all along the boundary of the lease area to minimize the dispersion of the dust from the mining.
Periodical monitoring of air quality to take steps to control the pollutant.
3.1.1. OCCUPATION HEALTH & SAFETY MEASURES
All the precautions would be adopted to prevent dust generation at site and to be dispersion into the outer environment. However, fir the safety of workers at site, engaged ay
strategic locations/ dust generation points like drilling, loading and unloading points, etc. dust masks would be provided. Dust masks would prevent inhalation of RSPM thereby reducing the risk of lung disease and other respiratory disorders. Regular health monitoring of workers will be carried out.
3.2 NOISE POLLUTION CONTROL MEASUREs
The ambient noise level monitoring is carried out in and around the proposed mine shows that ambient noise levels are well within the stipulated limits of CPCB.
Noise generation may be for an instant, intermitted or for continuous periods, with low to high decibels. Periodic inspections and checks of the risk prone areas and equipment have to be conducted.
To control noise pollution during the proposed mining operation following steps will be practiced.
The noise generated by the machinery will be reduced by proper lubrication of the machinery and equipment.
The workers employed should be provided with personal hearing protection equipment, with earmuffs and earplugs combined, as a protection from the high noise level generated at the plant site.
The provision of green barrier along the boundary will further reduce the propagation of noise level generated.
Limiting time exposure of workers to excessive noise.
Speed of trucks entering or leaving the mine is limited to moderate speed of 25 kmph to prevent undue noise from empty tippers.
3.2.1 SAFETY IN BLASTING
Care should take to evacuate the mining area completely at the time of low explosive blasting operations. The blasting team should be equipped with all personal safety and precautionary measure. The following safety measure will be attention while conducting the blasting operations.
A blasting SIREN should be used at the time blasting audio signal
Before blasting and after blasting, red & green flags should be displayed as visual signals.
Warning notice boards indicating the time of blasting and NOT TO TRESPASS are displayed prominently.
3.3 WATER POLLUTIN CONTROL MEASURES
The action program for minimizing adverse affects on water regime is to prevent wash-off of mine water and uncontrolled run-off water during monsoon. Proposed measures for this are as follows:
a) Building/extending of retention/toe wall at the foot of the dumps.
b) Construction of garland drains along the slops to divert the rainwater course away from the dumping areas.
c) Covering of dump slopes with grass plantation to stabilize and prevent erosion. d) Plantation of trees along the rides and slopes.
3.4 LAND ENVIRONMENT
3.4.1 STORAGE AND REUSE OF TOP SOIL:
Topsoil removed during clearing of the area for granite extraction shall be stacked separately to check the erosion of the stacked soil. A retaining wall shall be constructed all around the topsoil stockyard. Planting of grass and local species etc. are proposed on the surface of this stack to prevent erosion and to increase the soil nitrogen. As per the analysis of the soil samples they are found to be basic in nature. During afforestation, it is recommended to plant fast growing species with good quality canopy cover and dense leaf density and some ornamental species to give a good aesthetic look. It is recommended to sow neem, mahogany plants as soil and climate conditions are suitable for the growth of these plants.
3.4.2 SOIL WASTE MANAGEMENT
Removal of weathered rock and the rock waste is the only solid waste that will be generated from this mine. Some of the material from the waste may be sorted out and used for making small blocks to be used by the local unit for making lines. The market for tiles is good at
the moment and they will offer a better substitute for marble in terms of price and quality. Some rejected and unsorted material may be used in the civil engineering projects in the vicinity of the area. The waste materials can also be crushed into smaller sizes and can be used as road metal.
The waste generated during the five years dumped in the zone separately reserved for dumping within the Q.L. area. The dump will be designed in such that it will have slopes equal to the angle to the repose of such material. Garland drains have to be sunk along around the leading edge of the dump. A retaining wall will be constructed around the dump to preventing the slanting of boulders care will be taken to minimize the waste generation at the source. About 608 m3/Year of waste will be generated from this mine. The topsoil, weathered granite and granite waste will be dumped along the boundary southern side of the lease hold area (safety zone).
3.4.2.1 Stabilization of dumps
Land restoration or reclamation of the area is very essential in any mining industry. Proper measure adopted during restoration will control most of the adverse environmental impacts of quarry and also improve the aesthetic beauty of the area. Due to the quarry activities in this area the profile of the ground will change due t formation of pits. At the end of the quarry operations, the top soil/minerals rejects will be utilized for back filling wherever suitable and rehabilitation.
Following steps shall be taken for improving and protecting the environment. A) Quarry lease area.
B) Surrounding the quarry lease area. C) Surrounding the statutory building. D) On the undisturbed virgin lease area.
i. Surrounding the mining area
The dust generated during the quarrying operations will be carried by wind and will be deposited over the trees and on the adjacent area around the quarry in the buffer zone. To filter this dust, a green belt of 10m width shall be developed along the quarry lease area i.e., around ultimate pit limit. This green belt will also act as sound barrier. In between the lease tree
saplings, grass and bushes shall be grown. Creation of the green belt around the lease areas shall be undertaken on priority basis and shall be completed concurrent to quarry over a 10-year period.
ii. Surrounding the statutory buildings
All around the proposed statutory buildings and along the road side trees shall be planted in addition to the existing ones which will, protect the workers from the noise and dust. To plant trees around the statutory buildings, the topsoil that is going to be mined from the area shall be laid to form a strip of 10-15m width and 0.5m thickness.
iii. On the undisturbed virgin lease area
The undisturbed virgin lease area shall be utilized for afforestation purposes by developing the area with local varieties. This work shall be done after the cessation of quarry operations.
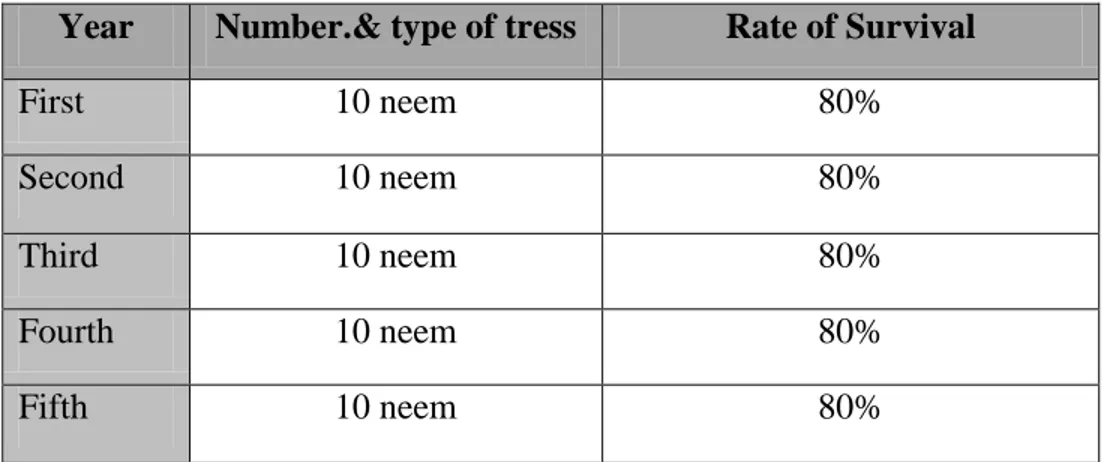
iv. Afforestation plan
The topsoil and weather granite will be stored separately and the same will be spread on the boundary safety zone. Trees like neem will be planted at a rate 10 tree per annum and rate of survival expected to 80% in this area.
Table 3.1 Showing programme of year wise afforestation of the five year period.
Year Number.& type of tress Rate of Survival
First 10 neem 80%
Second 10 neem 80%
Third 10 neem 80%
Fourth 10 neem 80%
Apart from the green belts and aesthetic plantation for eliminating fugitive emissions and noise control, all other massive plantation effort shall be decided and executed with the assistance and co-operation of the local community. Based on the community needs the afforestation would mainly aim at:
a) Protection & development of nature vegetation b) Protection of soil erosion
c) Plantations of fuel wood blocks to meet the energy requirement.
3.5 SOCIO ECONOMIC BENEFITS
There are positive impacts on socio-economic of people living in the villages. The villages in buffer zone depend upon agriculture. Mining operation in the subject area has positive impacts by providing direct and indirect job opportunities. There will be employment opportunities in transportation of ore to destination. This will result in following benefits:-
Improvements in physical infrastructure.
o Improvements in Social Infrastructure. o Increase in Employment Potential o Contribution to the Exchequer. o Prevention of illegal mining.
o During and Post-mining enhancement of green cover.
3.6 POST PROJECT MONITORING
The lessee will monitor the environmental parameter as per TNPCB/IBM/CPCB guidelines.
3.7 IMPLEMENATION OF EMP & MONITORING PROGRAMME
The environment management plan is detailed on the basis of impact assessment. Control and mitigation measure for the adverse impacts envisaged. As the major environmental attributes have been confined to the project area alone, implementation of the proposed control measures and monitoring thereof will be undertaken on the regional basis. The
lessee will ensure the implementation of the measures within the mine area and carrying efficient monitoring. On the environment, it is suggested to monitor the environmental parameters regularly.
The details of investments to carry out the regular monitoring and pollution control measure are given below in table 3.2.
Table-3.2: Cost of environmental protection measure (in Rs) Sl. no
Particularly/Activity Capital Cost
Recurring Expense/annum
01 Green Belt Development 40,000 10,000
02 Check Dams /Gully plugs/ Retaining Wall/ Road side drain cutting/ Maintenance/Parapet wall
2,50,000 60,000
03 Water spraying of haulage roads 2,50,00 50,000
04 Environmental monitoring --- ---
05 Occupationalhealth & safety --- ----
06 miscellaneous 1,50,000 3,20,000
Total 6,90,000 3,20,000
The applicant will adhere to all the terms & conditions laid in respect of safe working keeping in view of the sustainable Environmental Management and will comply with the provision of the Environmental Protection Act-1986, the mines Act-1952 & Mineral Conservation 7& Development Rules-1988 and any other Rules noticed from to time.
Signature of the Applicant Signature of RQP/ EIA Coordinator (Mining)
SURIYA MINING SERVICES, SALEM