Valuing Performance-Linked Share
Based Payments: A Report from the
Coal Face
Prepared by John J. Graham & Keith Martland
Presented to the Institute of Actuaries of Australia Financial Services Forum 2006
11 and 12 May, 2006
This paper has been prepared for the Institute of Actuaries of Australia’s (Institute) for the Financial Services Forum 2006. The Institute Council wishes it to be understood that opinions put forward herein are not necessarily those of the
Institute and the Council is not responsible for those opinions.
© John Graham and Keith Martland, Mercer Finance and Risk Consulting
The Institute will ensure that all reproductions of the paper acknowledge the Author/s as the author/s, and include the above copyright statement:
The Institute of Actuaries of Australia Level 7 Challis House 4 Martin Place
Sydney NSW Australia 2000
Telephone: +61 2 9233 3466 Facsimile: +61 2 9233 3446 Email: [email protected] Website: www.actuaries.asn.au
PAYMENTS: A REPORT FROM THE COAL FACE
JOHN J. GRAHAM AND KEITH MARTLAND
Abstract. We present a numerical analysis of the impact of mar-ket-based performance conditions on the fair value of employee share options (ESOs) in the sense of the new international ac-counting standard IFRS 2 and its national equivalents AASB 2, FAS 123 (R) and FRS 20.
The need to align performance and reward, shareholder pressure and corporate governance issues have led remuneration committees to consider attaching performance conditions to the stock options and restricted stock granted to executives. The archetypal market-based condition is that the total shareholder return (TSR) of the company must exceed that of its peers, where “peers” has three common interpretations: a small group of competitors, a large group of companies, and a market index. We use Monte Carlo simulation based on the Hull-White binomial model to calculate the fair value as a risk-neutral expected value of certain discounted cash flows. We investigate the sensitivity of the results to the volatility of the companies and the covariance matrix for the TSR of the peers. We conclude with some theoretical justifications for the, perhaps surprising, difference in impact between the various conditions for options and stock.
1. Introduction
The new accounting standards IFRS2 and FAS 123(R) require the cost of share based payments (SBPs) (employee share options (ESO) and performance shares) issued by companies to be expensed. If the SBP is not traded, and hence there is no market price, the “fair value” needs to be determined using a generally accepted valuation methodol-ogy. In this context “fair value” is an estimate of the price that would be paid for the SBP in an arms length transaction between knowledge-able, willing parties. In particular, it is not the value perceived by either the company or an individual SBP holder.
Date: February 28, 2006.
The most commonly used valuation methodologies are analytic for-mulæ (eg. Black-Scholes), lattice models (eg. binomial) and Monte-Carlo simulation, or derivatives of these approaches. If all SBPs were vanilla European options, then Black-Scholes would be the end of the story. However, the ability to early exercise the SBPs and the presence of performance hurdles necessitate the use of other methodologies.
Most ESOs allow exercise before the contractual term of the ESO is reached. This early exercise is essentially due to two causes:
• involuntary early exercise where the ESO holder is contractually forced to exercise their ESOs because they leave the company, for example, to take up alternate employment; and
• voluntary early exercise where the ESO holder chooses to ex-ercise the ESO due to the payoff of the option being sufficient for the holder to trade any potential value of the ESO for the realised value of the payoff.
Early exercise therefore depends on both time to expiry and share price and the valuation methodology must produce price paths to ac-commodate this feature.
The desire to align performance and reward, shareholder activism and corporate governance issues has led to performance hurdles being incorporated into many SBP designs. Under the accounting standards, the performance hurdles are categorised as market-based if the hurdle depends on the share price or the return of the underlying share (e.g. absolute or relative total shareholder return (TSR)), or internal where the hurdle does not explicitly depend on the share price (e.g. earnings per share growth). The accounting standards require the fair value to reflect the impact of the market-based hurdles but not the internal hurdle. Therefore the valuation methodology used must incorporate the features of market-based hurdles.
In our experience, the most commonly used market-based perfor-mance hurdle is the relative TSR hurdle. Here the underlying com-pany’s TSR over a given period, or periods, must exceed a given per-centile rank when compared to the TSR of the chosen peers. Once this base percentile is exceeded, the proportion of SBPs that vest cor-responds to the percentile rank achieved. In general we have found that the comparator group is relatively large, for example the ASX 50, ASX 100 or ASX 200; whilst the vesting scale provides no vesting if the underlying company achieves a ranking below median, 100% vesting for a ranking in the upper quartile and pro-rata vesting for a ranking in between.
In this paper we analyse the impact on the fair value of utilising peer groups of close competitors as opposed to general groupings and also the use of an index as the performance indicator.
We find that using an appropriate index has a significantly greater impact than using a general TSR group or even a closely correlated group of comparators. We show that the use of a reasonable comparator TSR hurdle for ESOs has minimal impact, unless there is a considerable time period between the test date and the contractual term; whilst the same hurdle can be highly effective for a performance share.
We have been actively valuing SBPs for clients from around the world over the past 3 years. In Australia, we have provided advice on SBP valuation to 14 of the ASX 50 companies and many other companies outside the ASX 50. The majority of our advice has been valuing SBPs with comparator group TSR hurdles. In this paper, we discuss our approach to valuing SBPs.
2. The Model
In this section, we specify the model we use to calculate the fair value of an SBP on a given underlying share with a market-based vesting condition.
The term “total shareholder return” has several related, but distinct, meanings. For this paper, we adopt the following approach. Suppose you invest $1 in a share at time 0. When the share goes ex-dividend, you borrow the (then) present value of the dividend at the risk free rate and invest it in the share. The dividend when paid, is used to pay off the loan. We call the natural log of the value of this investment, the natural return y(t) at time t.
We model the (risk-neutral) total shareholder return on n shares using the usual Black-Scholes framework. More precisely, we fix a symmetric, positive definite n×n matrix C and a function r of t >0 and proceed as follows. LetLdenote the unique lower triangular matrix with positive eigenvalues such that C =LLt. Let µdenote the vector valued function of t >0 given by
µi(t) = Z t
0
r(s)ds− t 2Cii.
Then we simulate the natural return of our n shares by
y=µ+Lz
where z is an n-dimensional Weiner process. The distribution of y(t) is multivariate normal with mean µ(t) and covariance matrix tC. The choice of µ ensures that the expected value of the TSR for share i
over an instantaneous interval at time t is r(t). Share i has volatility σi =
√ Cii.
We model early exercise behaviour for options in the manner sug-gested by Hull and White [HW].
(1) Exercise is allowed only after a vesting period.
(2) An exercisable option is exercised if the share price is at least m times the strike price.
(3) After the vesting period, employment termination resulting in the involuntary early exercise is modelled by a Poisson process. There is a probability λ dt that a vested option will be termi-nated in a given instantaneous interval of length dt. When an option is terminated, it is exercised if it is exercisable; otherwise it lapses.
Exercise also occurs at expiry if the option is in the money.
For an option that is exercised at time t, the present value of its payoff is X = exp − Z t 0 r(s)ds (S−K)
where S is the share price at time t and K is the strike price. If the option is not exercised (including those that do not vest), its payoff is zero. The fair value of the option equals E(X), the expected value of the present value of the payoff. After vesting, the expected value E(X | F) of X given the share price history to vesting, depends on only one share. Hence it may be evaluated with a lattice model. We use Monte Carlo simulation to evaluate
E(X) = E(E(X | F)). Our simulator is a C program with control variates.
We model indices such as the S&P ASX 100 total return index in the same manner as a share rather than as a weighted average of the underlying shares.
3. Hull-White
There is an extensive literature on early exercise behaviour and its impact on option values.
In [AS], Ammann and Seiz argue that values produced by various models are approximately equal, once they are calibrated so that the expected value of the time until exercise is correct. (See also [C].) We have found this parameter difficult to estimate in practice. Firstly, early exercise is strongly correlated with high share price. Since we have only one historical share price path, all our data is conditional
on this path. The expected value is a property of the whole distribu-tion. Secondly, the expected value discussed in loc. cit. is with respect to the risk neutral measure. The expected value with respect to the real world measure is significantly smaller (assuming the capital asset pricing model). Nevertheless, we do find the idea useful in this paper, because it provides a way to translate our calculations based on the Hull-White model to other commonly used models. For this reason we include the expected value of the time until exercise in our data.
Utility based models (e.g. [R], [BBL]) appear attractive in theory. However there is much evidence (e.g. [SW], [HHL]) that employees do not behave rationally. (In the stock market, this is not as obvious because other players make a profit trading against such psychological bias.) The models also have unobservable parameters, which must be calibrated to existing exercise behaviour. We found this calibration impossible for many companies as there was insufficient historical data. Indeed, this is the Achilles’ heel of any model with multiple parameters. There are several factors that undermine the collection of historical data:
• plan rules change every few years; • market sentiment varies, e.g. bear, bull; • company restructures;
• employee mix varies in age or level;
• individual employee preferences change over time; and • sample sizes can be tiny.
Where models lack a firm theoretical basis, it is not clear how to aggregate data of different types to provide a large enough sample to extract a statistically significant parameter estimate.
Hull-White is convenient because its two parameters have a simple interpretation under different circumstances.
Companies collect statistics on employment termination for other purposes. They generally have an expected value at hand, so the in-voluntary early exercise factor λ is readily available. In this paper we use a rate of 10% p.a. which is a typical value.
Some judgement is required to estimate the multiple m at which an option is exercised early. A na¨ıve estimate is the median of the multiple for historical early exercise. However, when an option is exercised following the vesting period or a black-out period, the employee might have exercised at a lower price given the opportunity. Excluding such exercises removes those who exercise earliest from the sample, biasing the result.
The multiplemat which an option is exercised varies from employee to employee. In this paper we calculate with four values for robustness:
• 2 as this is approximately the median at many companies; • 1.5 for impatient people;
• infinity (i.e., no voluntary early exercise); and • γ, defined as follows: α= (r−q− σ 2 2 )/σ; β = √ α2 + 2r; γ = 1 1− σ β−α
where r is the initial risk free rate and for the underlying share, q is the dividend yield andσ is the volatility.
4. Test Cases
The most common SBPs granted are at the money options (i.e. op-tions with a strike price equal to the current share price) and perfor-mance shares. Since it does not affect the analysis, we suppose that the grant date share price of the test company is $10, and that the strike price is $10 or $0.
We consider both types of SBP with a term of 7 years and a vesting period of 3 years. At the end of the vesting period we compare the total shareholder return of the test company with one of the following hurdles:
• the median TSR of a small group of competitors (specified be-low);
• the median TSR of a broad group of established companies (see table 14);
• the S&P ASX 100 total return index; or • the sector specific index specified below.
If the test company has done better than the hurdle, the SBP vests; otherwise it lapses. We have chosen this all-or-nothing hurdle as op-posed to a graded hurdle to facilitate comparison between the com-parator group hurdles and the index hurdles.
We calculate the fair value of these SBPs for three test companies. Our first test case is the Commonwealth Bank of Australia. We use a dividend yield of 5.42% p.a. (continuously compounding) and a volatility of 17% p.a. The comparator group consists of the banks listed in Table 1 and the sector specific index is S&P ASX 200 banks total return index.
Our second test case is BHP Billiton. We use a dividend yield of 2% p.a. and a volatility of 27.3% p.a. The comparator group consists of
Table 1. Banks AUS.AND NZ.BANKING GP. COMMONWEALTH BK.OF AUS. MACQUARIE BANK
NATIONAL AUS.BANK SAINT GEORGE BANK WESTPAC BANKING Table 2. Materials AMCOR ALUMINA BHP BILLITON CSR RIO TINTO SIMS GROUP
Table 3. Consumer Staples COCA-COLA AMATIL COLES MYER FUTURIS FOSTERS GROUP LION NATHAN WOOLWORTHS
the companies listed in Table 2 and the sector specific index is S&P ASX 200 materials total return index.
Our third test case is Woolworths. We use a dividend yield of 3.25% p.a. and a volatility of 19% p.a. The comparator group consists of the companies listed in Table 3 and the sector specific index is S&P ASX 200 consumer staples total return index.
5. Parameter Estimation
In this section, we estimate the parameters r and C for our stock market model.
The risk free rater (listed in Table 4) is derived from the yields on liquid issues of Commonwealth government bonds published daily by the Reserve Bank of Australia. These are continuously compounded per annum forward rates.
The matrixCis ann-dimensional analogue of volatility. The value of an option is exquisitely sensitive to volatility. Consequently techniques
Table 4. Risk free interest Date Rate 22 Nov 2005 5.30% 15 Feb 2006 5.25% 15 Nov 2006 5.11% 15 Oct 2007 5.24% 15 Aug 2008 5.32% 15 Sep 2009 5.31% 15 Aug 2010 5.28% 15 Jun 2011 5.42% 22 Nov 2012 5.37%
for estimating volatility have been thoroughly studied and are well understood. If there is a deep and liquid market for at the money market-traded options, this provides a forward looking estimate for short term volatility, called the implied volatility. Unfortunately, there is no market analogue which provides an estimate of the covariance of the return on two different shares.
The covariance of natural return is the same with respect to the risk neutral measure and the real world measure, so we can estimateCij by computing the sample covariance of the daily changes in natural return for shares iand j, and scaling by √dwhere dis the number of trading days per year. This estimate runs into one or more of the following problems:
• a small sample implies a higher sampling error;
• a higher sampling frequency is complicated by the fact the intra-day and inter-intra-day steps are different; and
• over a long period, the covariances wander. The correlation coefficient is the quotient
ρij = Cij σiσj
.
As the off diagonal correlations tend to be small, it is reasonable to hope that ρ is more stable than C. One can calculate ρ using the historical data and σi using standard techniques, and then combine them to form C.
We present some sensitivities to illustrate the stability of this method. The worst cases we have found are banks, which have low volatilities but the highest correlations. The “price” sections of Tables 5 and 6 list the fair value of an ESO (m = 2) and a performance share on Common-wealth Bank of Australia subject to a TSR performance hurdle against
Table 5. ESOs 2004 2003 2002 2001 2000 1999 1998 Std dev Price Small 0.924 0.957 0.921 0.919 0.939 0.973 0.925 0.021 Large 1.071 1.105 1.098 1.104 1.104 1.107 1.097 0.012 Term Small 6.063 6.055 6.064 6.066 6.061 6.051 6.064 0.005 Large 6.070 6.069 6.070 6.070 6.070 6.067 6.071 0.001 Probability Small 0.276 0.285 0.275 0.275 0.280 0.289 0.277 0.005 Large 0.327 0.339 0.337 0.339 0.339 0.340 0.337 0.005
Table 6. Performance Shares
2004 2003 2002 2001 2000 1999 1998 Std dev Price Small 4.945 5.018 4.941 4.945 4.993 5.044 4.958 0.041 Large 5.710 5.824 5.821 5.841 5.837 5.809 5.828 0.045 Term Small 3.000 3.000 3.000 3.000 3.000 3.000 3.000 0.000 Large 3.000 3.000 3.000 3.000 3.000 3.000 3.000 0.000 Probability Small 0.513 0.514 0.514 0.515 0.516 0.512 0.515 0.001 Large 0.584 0.588 0.591 0.591 0.591 0.585 0.592 0.003
the small and large comparator groups. The right column contains the standard deviation of the estimates. (The interpretation of the other outputs is specified in the results section below.) The volatilities of the shares are the same in each sensitivity—only the matrix of correlations is changed. Each run uses the historical data for a one year period (from 22 November) to avoid seasonal confounding.
In the rest of the paper, we use a correlation matrix based on the last 5 years of historical returns. In particular we are using historical volatility. Our examination of the impact of hurdle choice does not require a forward looking volatility, unlike fair values for accounting purposes.
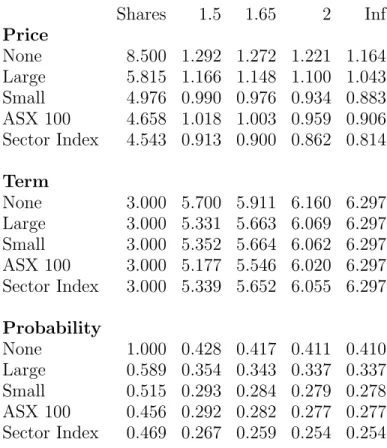
Table 7. Commonwealth Bk. of Aus. Shares 1.5 1.65 2 Inf Price None 8.500 1.292 1.272 1.221 1.164 Large 5.815 1.166 1.148 1.100 1.043 Small 4.976 0.990 0.976 0.934 0.883 ASX 100 4.658 1.018 1.003 0.959 0.906 Sector Index 4.543 0.913 0.900 0.862 0.814 Term None 3.000 5.700 5.911 6.160 6.297 Large 3.000 5.331 5.663 6.069 6.297 Small 3.000 5.352 5.664 6.062 6.297 ASX 100 3.000 5.177 5.546 6.020 6.297 Sector Index 3.000 5.339 5.652 6.055 6.297 Probability None 1.000 0.428 0.417 0.411 0.410 Large 0.589 0.354 0.343 0.337 0.337 Small 0.515 0.293 0.284 0.279 0.278 ASX 100 0.456 0.292 0.282 0.277 0.277 Sector Index 0.469 0.267 0.259 0.254 0.254 6. Results
Our results are presented in Tables 7, 8 and 9. The first column of data is for performance shares which we deem to be exercised upon vesting. The remaining columns are for ESOs; the column heading is the early exercise multiple m. The rows are indexed by the hurdles specified in the section Test Cases. We stress once again, that the data are expected values with respect to the risk neutral measure; the expected values with respect to the real world measure can be significantly different. “Price” is the expected value of the present value of the payoff. “Term” is the expected value of the time until exercise or expiry, conditional on the ESO vesting. “Probability” is the probability that the ESO will (vest and) be exercised. The term and probability values in the performance share column correspond to the expected value of the time until vesting given the hurdle has been passed, and to the probability of vesting respectively.
Table 8. BHP Billiton Shares 1.5 2 4.95 Inf Price None 9.418 2.776 2.973 3.040 3.030 Large 6.181 2.366 2.525 2.586 2.576 Small 5.898 2.216 2.355 2.412 2.402 ASX 100 5.441 2.185 2.322 2.379 2.369 Sector Index 5.146 2.063 2.185 2.238 2.228 Term None 3.000 5.034 5.627 6.269 6.297 Large 3.000 4.025 5.004 6.240 6.297 Small 3.000 4.220 5.088 6.239 6.297 ASX 100 3.000 3.848 4.847 6.229 6.297 Sector Index 3.000 3.947 4.878 6.228 6.297 Probability None 1.000 0.547 0.497 0.484 0.484 Large 0.481 0.402 0.364 0.351 0.351 Small 0.479 0.372 0.338 0.327 0.327 ASX 100 0.405 0.351 0.318 0.307 0.307 Sector Index 0.388 0.326 0.297 0.286 0.286
Suppose m = 2 and that an ESO is exercised at timet. If m = 1.5, it would still have been exercised at timetif not earlier. It follows that term increases from left to right while probability decreases.
The price and probability for an SBP with a hurdle does not ex-ceed the corresponding figures for the SBP without a hurdle, while the opposite is true for the term of an SBP with a hurdle.
Next we draw attention to some observations which might surprise the unwary.
(1) The TSR performance hurdles tested have a rather small effect on the fair value of an option. The reduction in value is much less than the probability of failing the hurdle, as allowed under the previous Australian accounting standard AASB 1046. (2) A hurdle against a carefully selected group of peers has more
impact on value than a hurdle against a broad group.
(3) The probability of CBA being in the top half of the large group is 59%, which is significantly higher than 50%.
Table 9. Woolworths Shares 1.5 2 2.55 Inf Price None 9.071 1.944 1.999 1.986 1.964 Large 6.006 1.676 1.725 1.714 1.692 Small 5.704 1.572 1.617 1.606 1.584 ASX 100 5.097 1.500 1.543 1.532 1.511 Sector Index 4.973 1.475 1.518 1.507 1.485 Term None 3.000 5.359 5.984 6.204 6.297 Large 3.000 4.736 5.746 6.130 6.297 Small 3.000 4.792 5.752 6.128 6.297 ASX 100 3.000 4.585 5.666 6.101 6.297 Sector Index 3.000 4.561 5.653 6.096 6.297 Probability None 1.000 0.537 0.514 0.512 0.512 Large 0.549 0.412 0.391 0.390 0.390 Small 0.531 0.383 0.364 0.363 0.363 ASX 100 0.452 0.351 0.333 0.331 0.331 Sector Index 0.439 0.343 0.325 0.324 0.324
(4) It is harder to beat the hurdle against the ASX 100 (resp. sector specific) index than against the large (resp. small) comparator group.
The first observation is a consequence of the fact that passing the hurdle and the option being in the money at expiry are correlated. Both occur when the company does well, and neither occur when the company does poorly.
How does the hurdle reduce the fair value of an SBP? This requires some share price histories where the underlying share does well enough for a significant payoff but not so well that the test is passed. It is therefore necessary that the constituents of the comparator group or index do well. Since companies in the same line of business are exposed to common shocks, we find higher correlation coefficients between the daily returns on such shares. Moreover, the sector specific indices have greater volatility than the broad ASX 100 index does. This makes the precondition, that the constituents do well as a whole, more likely.
The distribution of a company’s TSR is lognormal. This means that the probability of being double the median value is the same as the
probability of being half the median value. Consequently the mean return is higher than the median return. Suppose Y is normally dis-tributed with meanµand standard deviation σ. Then Y =µ+σZ for a standard normal variable Z. The mean, mode and median of Y is µ. Now consider X = exp(Y). Its distribution is lognormal with median exp(µ). Its mean is
E(X) = √1 2π Z ∞ −∞ exp(µ+σz) exp(−z 2 2)dz (6.1) = exp(µ+σ 2 2 )× 1 √ 2π Z ∞ −∞ exp(−(z−σ) 2 2 )dz = exp(µ+σ 2 2 ).
We assume that all shares have the same mean return as a risk free investment. Hence µis smaller for more volatile shares.
Banks have a lower volatility than the market. Therefore they have a higher median return. This is why CBA has such a high chance of beating the median of a large group of companies, but only an even chance of beating the other banks.
The volatility of an index is much lower than that of its constituents. Hence its median return will be higher, making it harder to beat.
A second consequence of the analysis above, is that half of the current value of a share comes from the return for z > σ, that is, future prices above exp(µ+σ2
). Most of the value of an option comes from price paths well above the mean.
7. The Timing of the Test relative to the Contractual Term
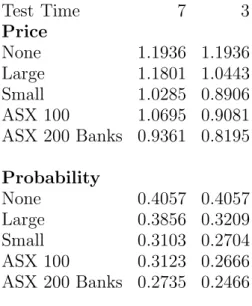
Part of the impact of the hurdle on the option is due to the fact that there is a reasonably long time between the test date and the end of the contractual term. The results in Tables 10 and 11 illustrate this for test company CBA. For simplicity, we assume no early exercise.
When the hurdle has been achieved, it is likely that the option will be in the money. Options that are well in the money approximate shares and given the large dividend yield on CBA, early exercise is optimal. Hence holding a vested option for the period from 3 years to 7 years reduces the value. In addition, the comparator group hurdles for the CBA share become relatively easier to achieve over time whilst for the index hurdles become harder to achieve as the variance σ2
in Equation 6.1 is proportional to time.
Table 10. Options without Early Exercise Test Time 7 3 Price None 1.1936 1.1936 Large 1.1801 1.0443 Small 1.0285 0.8906 ASX 100 1.0695 0.9081 ASX 200 Banks 0.9361 0.8195 Probability None 0.4057 0.4057 Large 0.3856 0.3209 Small 0.3103 0.2704 ASX 100 0.3123 0.2666 ASX 200 Banks 0.2735 0.2466
Table 11. Probability of Beating hurdle
Test Time 7 3 None 1.000 1.000 Large 0.614 0.575 Small 0.522 0.515 ASX 100 0.433 0.456 ASX 200 Banks 0.453 0.469 8. Multiple Tests
When the hurdle is tested multiple times, the impact of the hurdle is obviously reduced. To illustrate this impact, we adopted monthly testing of the hurdle from the end of the vesting period to the end of the contractual term.
The prices for the CBA ESOs (with m = 2) are shown in Table 12 and the prices for CBA shares are shown in Table 13.
Retesting clearly reduces the impact of a hurdle on an SBP’s price. In particular, we can see that the impact of the hurdle on the ESOs with retesting becomes negligible. Even a strict hurdle such as the Banks Index results in an option value only 10% less than the value of an option without a hurdle.
Table 12. ESOs
Price
One Test Retests
None 1.221 1.221
Large 1.100 1.218
Small 0.934 1.170
ASX 100 0.959 1.180
ASX 200 Banks 0.862 1.112
Table 13. Performance Shares
Price
One Test Retests
None 8.500 8.500 Large 5.815 7.385 Small 4.976 6.943 ASX 100 4.659 6.427 ASX 200 Banks 4.543 6.314 9. Bibliography
[AS] M Ammann and R Seiz, “Does the Model Matter? A Valuation Analysis of Employee Stock Options”, (2004).
[BBL] J C Bettis, J M Bizjak, “Exercise Behaviour, Valuation and the Incentive Effects of Employee Stock Options” (2004).
[C] J Carpenter, “The Exercise and Valuation of Executive Stock Options”, Journal of Financial Economics 48(2)(1998), 127–158.
[HHL] C Heath, S Huddart and M Lang, “Psychological Factors and Stock Option Exercise”, Quarterly Journal of Economics 114 (1999), 601–628.
[HL] S Huddart and M Lang, “Employee Stock Options Exercises: An Empirical Analysis”, Journal of Accounting and Economics 21(1)
(1996), 5–43.
[HW] J Hull and A White, “How to Value Employee Stock Options”,
Financial Analysts Journal 60(1) (2004), 114–119.
[LLV] R A Lambert, D F Larcker and R E Verrecchia, “Portfolio Considerations in Valuing Execuative Compensation”, Journal of Ac-counting Research 29(1991), 129–149.
[R] M Rubinstein, “On the Accounting Valuation of Employee Stock Options”, Journal of Derivatives 3(1) (1995), 8–24.
[SW] Z Sautner and M Weber, “Stock Options and Employee
Table 14. Large Group
AUST.GAS LIGHT LION NATHAN
ARISTOCRAT LEISURE MACQUARIE BANK
AMCOR MACQUARIE COUNTRY.TRUST
ANSELL MACQUARIE INFR.GROUP
AUS.AND NZ.BANKING GP. MACQUARIE OFFICE TRUST
APN NEWS & MEDIA METCASH
ALUMINA NATIONAL AUS.BANK
AXA ASIA PACIFIC HDG. NEWCREST MINING
BHP BILLITON ORIGIN ENERGY (EX BORAL)
BRAMBLES INDUSTRIES ORICA
COCA-COLA AMATIL OIL SEARCH
COLES MYER OXIANA
CENTRO PROPS.GROUP PUBLISHING AND BCAST.
COCHLEAR PERP.TRUSTEES AUS.
COMMONWEALTH BK.OF AUS. PATRICK
COMPUTERSHARE QANTAS AIRWAYS
CSL QBE INSURANCE GROUP
CSR RIO TINTO
CALTEX AUSTRALIA SAINT GEORGE BANK
DOWNER EDI SIMS GROUP
DB RREEF TRUST STOCKLAND
DCA GROUP SONIC HEALTHCARE
FUTURIS SANTOS
FOSTERS GROUP SUNCORP-METWAY
JOHN FAIRFAX SYMBION HEALTH
CFS GANDEL RETAIL TRUST TABCORP HOLDINGS
GUNNS TRANSURBAN GROUP
GPT GROUP TELECOM CORP.NZ. (ASX)
HARVEY NORMAN HOLDINGS TELSTRA
ING INDL.FUND TOLL HOLDINGS
ILUKA RESOURCES WEST AUST.NEWSPAPER HDG.
INVESTA PROPERTY GROUP WESTPAC BANKING
JAMES HARDIE INDS.CDI. WESTFIELD GROUP
LEIGHTON HOLDINGS WESFARMERS
LIHIR GOLD WOOLWORTHS
School of Mathematics and Statistics, The University of Sydney, NSW 2006 Australia
E-mail address: [email protected]
Mercer Finance and Risk Consulting, GPO Box 3479, Sydney NSW 2000 Australia