using GPU Implemented Algorithms
Eduardo Romero-Vivas1, Fernando D. Von Borstel1, and Isaac Villa-Medina1,2 1
Centro de Investigaciones Biológicas del Noroeste S.C., Instituto Politécnico Nacional, La Paz, B.C.S.,
Mexico 2
Instituto Tecnológico de La Paz, B.C.S., Mexico
http://cibnor.mx/es/investigacion/grupos-de-investigacion/grupo-de-bioinformatica/inicio
Abstract. DNA microarrays are used to simultaneously analyze the expression level of thousands of genes under multiple conditions; however, massive amount of data is generated making its analysis a challenge and an ideal candidate for massive parallel processing. Among the available technologies, the use of General Purpose computation on Graphics Processing Units (GPGPU) is an efficient cost-effective alternative, compared to a Central Processing Unit (CPU). This paper presents an implementation of algorithms using Compute Unified Device Architecture (CUDA) to determine statistical significance in the evaluation of gene expression levels for a microarray hybridization experiment designed and carried out at the Centro de Investigaciones Biológicas del Noroeste S.C. (CIBNOR). The obtained results are compared to traditional implementations. Keywords. GPU, microarray, CUDA.
Análisis de expresión genética en
microarreglos utilizando algoritmos
implementados en GPU
Resumen. Los microarreglos de ADN permiten analizar simultáneamente el nivel de expresión de miles de genes ante condiciones múltiples; sin embargo, la gran cantidad de datos generados representa un reto para su análisis y los hace un candidato ideal para el procesamiento masivo paralelo. Dentro de las tecnologías disponibles, el uso de cómputo en tarjetas gráficas de propósito
general (GPGPU), es una alternativa eficiente, en términos de costo-efectividad, comparada con respecto a las unidades de procesamiento central (CPU). Este artículo presenta la implementación de algoritmos utilizando la arquitectura de cómputo unificada (CUDA), para determinar la significancia estadística en la evaluación de niveles de expresión génica para un experimento de hibridación de microarreglos, diseñado y llevado a cabo en el Centro de Investigaciones Biológicas del Noroeste, S.C. (CIBNOR). Los resultados obtenidos se comparan con respecto a las implementaciones tradicionales.
Palabras clave. GPU, microarreglos, CUDA.
1 Introduction
Recent technological advances in molecular biology and genomics have triggered an explosion in the amount of information generated; prominent examples of this growth can be easily observed in public databases of DNA sequences such as GenBank or UniProt where information doubles approximately every 6 months. Technologies such as next-generation sequencing or the use of a microarray to analyze gene expression allow large scale analyses to cover a large proportion of the genome of an organism, in contrast to only a few years ago, when techniques allowed genes to be analyzed only separately. For example, DNA microarrays, for the task of analyzing simultaneously the expression level of thousands of genes with
multiple conditions, has revolutionized molecular biology impacting academia and fields in medicine and pharmaceuticals, biotech, agrochemical and food industries.
Today the costs of analyses of this information, in terms of economics, time, and resources, tend to be higher than its generation [1]. This growth in the amount of information generated in each experiment requires the use of new analysis technologies that go hand in hand with the data dimension. Bioinformatics, understood as an application of mathematics, statistics and information technologies for the analysis of genomic and proteomic signaling, has become the accepted solution to this challenge so far.
One of the main features of a microarray is a large volume of data generated; therefore, one of the greatest challenges in this area involves handling and interpretation of these data. The size of generated information and its analysis with microarrays make them ideal candidates for parallel processing architectures taking advantage of many cores and multi-cores that are revolutionizing the high-performance computing. However, the use of clusters and supercomputers has remained prerogative of laboratories and universities with large resources. Meanwhile, the development of many-core architectures such as Graphics Processing Units (GPU), and specifically the Architecture of Unified Computing Devices (CUDA), proposed by NVIDIA in 2006 [2, 4], allows researchers to design bioinformatics analysis algorithms with high-performance low-cost devices but with high computing power.
There are only a few studies using GPU's for microarray analyses. For example, an algorithm based on GPU's for the classification of genes expressed in a microarray has been developed recently [5]. The present paper reports the implementation of algorithms in CUDA to determine statistical significance in the evaluation of gene expression levels for a microarray hybridization experiment designed at CIBNOR and compares the obtained results with traditional implementations.
2 Materials and Methods
2.1 MicroarraysDNA microarrays are devices that can measure the expression levels of thousands of genes in parallel. A microarray is a crystalline solid surface, usually a microscopic slide, which adheres specific DNA molecules for the purpose of detecting the presence and abundance of complementary molecules (nucleic acids) marked in a biological sample (via Watson-Crick hybridization duplex formation). In most experiments, microarray labeled nucleic acids derived from messenger RNA (mRNA) of a tissue sample of an organism are involved in the generation (coding) process of a protein microarray and therefore the degree of expression of a gene can be measured by quantifying the relative abundance of molecules attached [6].
Fig. 1 shows the most commonly used experimental design for microarrays. The first step in the process is to extract genetic material from tissues from two different biological conditions, such as an abnormal condition and a normal control. Then the samples are labeled with different fluorophores; red for the sample tissue (with Cy5) and green for the control tissue (with Cy3), and hybridized on the microarray slide. These markers are used to identify the DNAs complementary to nucleic acids of interest in the sample by emitting light when illuminated by a laser in red and green, respectively. Both images are combined to obtain a color image, where the overexpressed genes acquire shades of red, inhibited genes are in green shades, and genes that have remained in the same condition in both samples are shown in yellow. Afterwards, an estimate of signal intensity in each case was carried out whereby corrections were made to normalize and adjust the signal to the dark background.
The over-expression or under- expression of a given gene was represented as a fraction as defined in Equation 1. In this formula, genes that are over-expressed by a factor of 2 give a ratio of 2, whereas under-expressed genes give values of 0.5. Hence, it is preferable to use a logarithmic transformation with base 2, so that a doubly
overexpressed gene will generate a value of 1, whereas the value of an under-expressed gene will be -1, making interpretation of results more intuitive due to the natural symmetry of biological phenomena [6].
(1)
2.2 Statistical Analysis of Differential Expression
Each gene spot gives a measure of expression that compares two samples for a given experiment. However, in order to represent the variability among a population of organisms, it is required to have repetitions of the experiment for different individuals to identify genes that are expressed differentially in a consistent way. Setting a threshold of expression and averaging the readings for the total number of organisms is not appropriate as it does not reflect the extent to which the expression levels vary for each individual, or takes into account the size of the sample, i.e., the number of agencies involved in the study. Therefore, a hypothesis test shall be used to determine whether a gene is differentially expressed. The null hypothesis for this experiment is that there is no difference in expression for both tissues. If this hypothesis were true, variability in the data would only
represent the variability between individuals or a measurement error. The selection of differentially expressed genes should not be based on their proportion defined in Equation 1 but on a predefined value p (p = 0.001), i.e., the probability of observing a degree of change randomly.
For the purpose of this study, the t-paired test was selected and calculated as shown in Equation 2.
̅ √
(2)
where ̅ is the average of the ratio defined in Equation 1, S is the standard deviation calculated with Equation 3, and n is the number of biological replicates of the experiment.
√∑ ̅
(3)
The p value is calculated from the statistical comparison with a t-distribution with an appropriate number of degrees of freedom, in this case the number of replicates minus one.
2.3 Design of the Microarray
As part of SAGARPA-CONACYT 2009-II project
entitled "FUNCTIONAL GENOMICS
APPLICATION AS A STRATEGY FOR
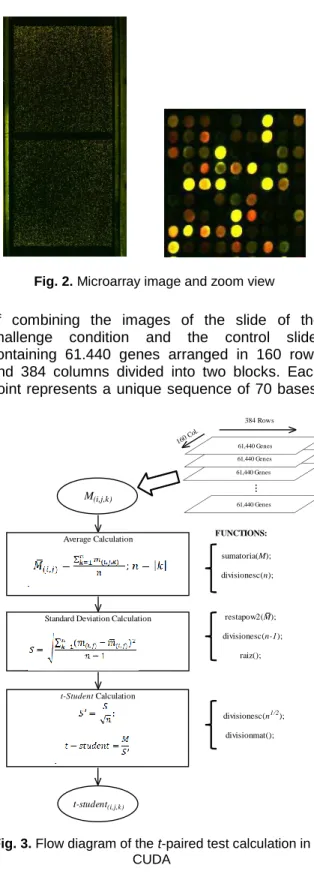
IMPROVEMENT OF THE SHRIMP INDUSTRY" a microarray was designed specifically for shrimp from unique sequences from public databases (GenBank) and subtractive libraries generated in the Biological Research Center of the Northwest, S. C. (CIBNOR). The selection of sequences, pre-processing, assembly and design of probes was carried out in CIBNOR, while the physical impression of the microarray was done by the company Biodiscovery, LLC (dba MYcroarray). Experimental challenges to various biological conditions were carried out at the CIBNOR, while the process of microarray hybridization and scanning was performed on DNA Microarray Unit at the Institute of Cellular Physiology, UNAM. Fig.2 shows an example of the microarray image generated for a given experiment and a zoom view. The Microarray image displayed is the result
Fig. 1.Experimental design and use of microarrays
mRNA mRNA cDNA (Red Fluorescence) cDNA (Green Fluorescence) A Condition B Condition Getting RNA Inverse Transcriptase Labeling Hybridization Microarray A B AB
of combining the images of the slide of the challenge condition and the control slide, containing 61.440 genes arranged in 160 rows and 384 columns divided into two blocks. Each point represents a unique sequence of 70 bases,
representative for the gene of interest. In the zoom view of the section, it is shown that not all gene spots in the microarray have the same intensity.
The SPOTFINDER program was used for image analysis of microarrays to determine the level of expression of each gene from the set of points that form the image, which generates a table of maximum, minimum, and average intensity and background.
2.4 Experimental Design
In order to evaluate the use of parallel processing algorithms for the analysis of microarray gene expression, we developed the t-paired parametric analysis on the GPU cards with graphics processing routines developed in CUDA. From hybridization data of a microarray of 61.440 genes, several subsets of data were generated by varying the number of genes selected for analysis and the number of replicates of the experiment. The computer equipment, in which the project was developed, has the following features: Processor Intel Core2Duo E8400 at 3.00 GHz with 2.0 GB RAM, 100 GB hard drive, operating system Fedora 12, with a GeForce 9800 GT (112 CUDA cores, CUDA computing capability 1.1 with 1024 MB dedicated memory and 256-bit memory interface).
2.5 Implementing CUDA
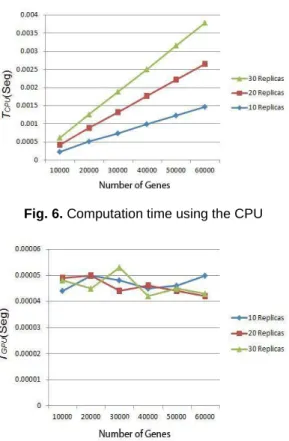
Fig. 3 shows a flowchart of operations and functions in CUDA to perform the t-paired test, as defined in Equation 2.
Fig. 2. Microarray image and zoom view
Fig. 3. Flow diagram of the t-paired test calculation in CUDA
Fig. 4. Mapping of the data matrix to global memory
Average Calculation
M(i,j,k)
Standard Deviation Calculation
sumatoria(M); divisionesc(n); restapow2(M); divisionesc(n-1); raiz(); t-StudentCalculation divisionesc(n1/2); divisionmat(); t-student(i,j,k) 61,440 Genes 61,440 Genes 61,440 Genes 1 0 R ep lic as 384 Rows 160Co l. 61,440 Genes ... FUNCTIONS:
The three-dimensional matrix consisting of the microarray data from global memory was mapped into a two dimensional array, as illustrated in Fig. 4.
The functions required for the computation are described below (see also Fig. 5).
Step 1. Get the average of the data.
To perform this operation, it is required to apply an algorithm that allows adding the elements of a row and subsequently dividing by the number of columns, thus obtaining the average. The required functions are:
sumatoria(). Sum by Row. This algorithm
receives an array of data to be processed and a vector as input parameters. The algorithm calculates the sum of all columns in each row of the array of data and stores the result in the vector. Each thread of each block is responsible for loading an element of the array in the shared buffer of each block, and the operations are performed using this buffer.
divisionesc(). Division by a Scalar. This
algorithm divides a vector by a scalar value, both are received as input parameters. Each thread loads a block of each vector element in the buffer and subsequently performs the operation.
promedio(). Average. This algorithm is aided
by the previous algorithms to obtain the average of each row.
Step 2. Obtain the standard deviation.
It is required to obtain the sum of the squares of the differences of the samples and the average. To do this we used the following algorithms:
restapow2(). Square Difference. This algorithm
receives an array and two vectors as input parameters. The algorithm subtracts from the elements of each row the corresponding value in the vector. The results are squared and stored.
raiz(). Square Root. This algorithm computes
the square root of each vector element. Step 3. Calculate the value of t.
To complete the calculation, the following algorithm divides two vectors element by element.
divisionmat(). Vector Division. This algorithm
performs element-by-element division of two vectors and stores the result in a third vector.
3 Results
We compared the results in computation time for GPU implementation against the time obtained in a serial implementation using CPU, varying the number of genes involved in the analysis and the number of replicates in each experiment.
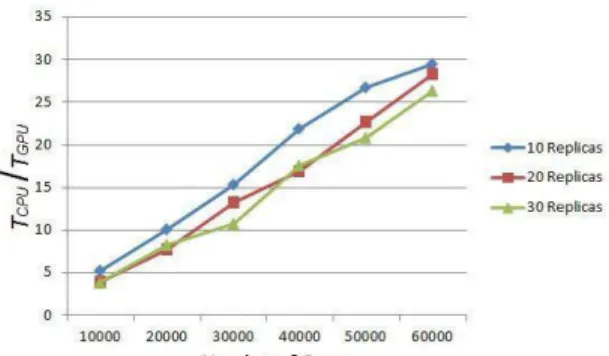
Fig. 6 and 7 show the processing time for the algorithm using a CPU and GPU, with different numbers of genes analyzed and different numbers of replicas.
4 Discussion
Fig. 6 shows how the runtime of the t-test varies with respect to the number of genes involved in each replica and to the number of replicas n. For a given number of replicas, there is a linear increase with increasing the number of genes
Fig. 6. Computation time using the CPU
involved. For a greater number of replicates, the slope becomes larger as the number of values used for each calculation grows. This behavior corresponds to what one would expect from a serial implementation developed using a CPU. Fig. 7 shows the corresponding times for the same calculation but now implemented on GPU. One can observe that the processing times remain approximately equal, in the order of one hundred thousandths of a second, regardless of the increase in the number of genes or the number of replicas. Fig. 8 shows the advantage of using calculation in parallel on the serial implementation. The process can be performed from 5 up to 30 times faster depending on the number of genes involved in comparison with the implementation using CPU.
5 Conclusions
Despite the GPU computing time being from 5 up to 30 times faster, the order of time spent on CPU and GPU, at first glance, does not justify the use of a parallel implementation, since both are made in fractions of a second. However, we must take into account that only the most basic statistical parametric test was implemented: a t-test in a single study with paired data. Microarray technology, however, is used in more complex experiments, where there may be multiple groups in which more than one condition is analyzed. Such experiments require more sophisticated analysis known as ANOVA and generalized linear
models. Both techniques are similar to the t-test in that they require that the variability in the data follows a normal distribution. Bootstrap analysis can be applied to both techniques to generate the data distributions under no Gaussian assumptions. For that, new sets of data of the same dimensions are generated from the original data, as it is common to produce millions of these sets to generate the distributions [6]. In these cases, the advantage in speed of analysis presented in GPU implementations is fully justified.
Acknowledgements
The authors acknowledge the support of the project SAGARPA-CONACYT 2009-II entitled "Functional Genomics application as a strategy for improvement of the shrimp industry”. This research was made in the facilities of CIBNOR Bioinformatics Laboratory.
References
1. Sboner, A., Mu, X.J., Greenbaum, D., Auerbach, R.K., & Gerstein, M.B. (2011). The real cost of
sequencing: higher than you think!. Genome
Biology, 12, 125–135. http://genomebiology.com/ 2011/12/8/125.
2. NVIDIA (2013). Retrieved from
http://developer.nvidia.com/object/cuda.html.
3. Sanders, J. & Kandrot, E. (2010). CUDA by example: An introduction to General-Purpose GPU Programming. Upper Saddle River, NJ: Addison-Wesley.
4. Kirk D.B. & Hwu, W.W. (2010). Programming
massively parallel processors. A hands-on
approach. Burlington, MA: Morgan Kaufmann
Publishers.
5. Benso, A., Di Carlo, S., Politano G., & Savino, A. (2010). GPU acceleration for statistical gene
classification, 2010IEEE International Conference
on Automation Quality and Testing Robotics
(AQTR 2010), 2, 1–6, Cluj-Napoca Romania.
6. Stekel, D. (2003). Microarray bioinformatics. Cambridge; New York: Cambridge University Press.
Eduardo Romero Vivas received his Ph.D. from the University of Southampton, UK. Researcher at
Centro de Investigaciones
Biologicas del Noroeste (CIBNOR),
Mexico, in the Bioinformatics
Group, he is also a member of the Signal Processing, and Engineering in Medicine and Biology IEEE Societies.
Fernando D. Von Borstel received his Ph.D. in Artificial Intelligence from Instituto Tecnológico y de Estudios Superiores de Monterrey, México. He works as a researcher at Centro de Investigaciones Biológicas del Noroeste,
México (CIBNOR), and he is member of the Bioinformatics Group.
Isaac Villa Medina received his M.Sc. from Instituto Tecnológico de La Paz, Mexico (ITLP). Currently he holds an academic position at ITLP.