Regular article
Viral vectors for the treatment of alcoholism: Use of metabolic flux analysis
for cell cultivation and vector production
V. Martinez, Z.P. Gerdtzen, B.A. Andrews, J.A. Asenjo
Centre for Biochemical Engineering and Biotechnology Department of Chemical Engineering and Biotechnology, Institute for Cell Dynamics and Biotechnology (ICDB): a Centre for Systems Biology, University of Chile Beauchef 861, Santiago, Chile
a r t i c l e
i n f o
Article history:
Received 3 October 2008 Received in revised form 27 July 2009
Accepted 29 September 2009 Available online 6 October 2009 Keywords:
Metabolic flux analysis Media design Adenovirus equation
a b s t r a c t
The HEK293 cell line has been used for the production of adenovirus vectors to be used in the potential treatment of alcoholism using a gene therapy strategy. Culture optimization and scale-up has been achieved by first adapting the cells to serum-free media and secondly by growing them in suspension. Adenovirus production after infection was increased, resulting in higher specific glucose consumption and lactate accumulation rates compared to the growth phase. We applied media design tools and Metabolic Flux Analysis (MFA) to compare the metabolic states of cells during growth and adenovirus production and to optimize culture media according to the metabolic demand of the cells in terms of glucose and glutamine concentrations. This allowed obtaining a higher maximum cell concentration and increased adenovirus production by minimizing the production of metabolites that can have an inhibitory effect on cell growth. We have proposed a stoichiometric equation for adenovirus synthesis. MFA results allowed determination of how these changes in composition affected the way cells distribute their nutrient resources during cell growth and virus production. Virus purification was successfully achieved using chromatography and Aqueous Two-Phase Systems (ATPS).
&2009 Elsevier Inc. All rights reserved.
1. Introduction
Alcoholism is an addiction that causes very serious social and economic problems worldwide. A single dominant negative mutation in the gene coding for mitochondrial aldehyde dehy-drogenase (ALDH2) can produce marked protection against alcohol abuse and alcoholism. Subjects that show this mutation and hence cannot degrade acetaldehyde into acetate (as shown in
Fig. 1), show marked elevations in blood acetaldehyde levels when consuming ethanol, leading to a strong reaction that deters further alcohol intake (Ocaranza et al., 2008). The main treatment in use today is Disulfiram, a drug that inhibits ALDHs, which is clearly effective in reducing ethanol consumption by alcoholics; however its use has been reduced mainly due to its toxicity and low patient compliance. In recent years only 10% of the alcoholism treated by specialist physicians in the United States were prescribed Disulfiram (Ocaranza et al., 2008). An attractive alternative consists of a genetic treatment with similar aims. Such an alternative consists of a long-term inhibition of ethanol consumption by reducing ALDH2 levels by the administration of vectors that code for anti-aldh2 antisense RNA molecules that inhibitaldh2gene expression. A long lasting inhibition of ethanol
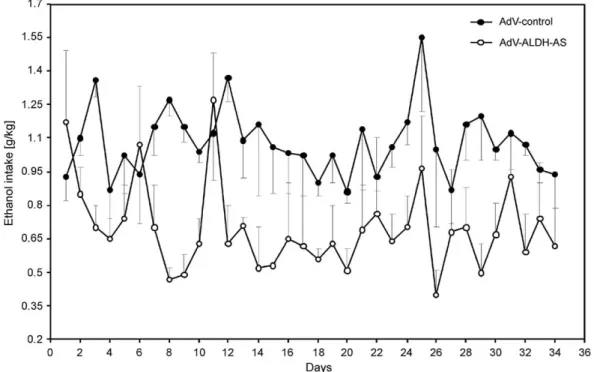
consumption could be achieved by the in vivo administration of AdV (adenovirus) system carrying an anti-aldh2 antisense gene. Since 1990 adenovirus vectors have been the vectors of choice for gene therapy applications (Nadeau and Kamen, 2003). Adenoviruses are medium-sized (90–100 nm), nonenveloped icosahedral viruses containing double-stranded DNA. There are over 51 different serotypes in humans which are responsible for 5–10% of upper respiratory infections in children, and many infections in adults as well. Adenoviruses have a linear dsDNA genome and are able to replicate in the nucleus of mammalian cells using the host’s replication machinery. In vivo studies in alcohol-dependant rats have shown that a single intravenous administration of the AdV carrying the anti-aldh2antisense gene markedly reduces ALDH2 activity in the liver and lowered voluntary ethanol consumption for months by 50–60% (Ocaranza et al., 2008). This is clearly shown inFig. 2, where the ethanol intake is compared in alcohol-dependant rats, which correspond to the control injected with AdV without the anti-aldh2antisense gene and those with AdV with the gene.
Gene therapy is rapidly expanding with a major focus on cancer but also into treatment of other diseases (Nadeau and Kamen, 2003). Replication-defective adenoviruses are the vectors of choice for delivering corrective genes into human cells. Today, adenoviruses constitute the most important gene delivery vehicle in the field of gene therapy and are currently involved in one-third of the protocols of gene therapy (Henry et al., 2005). To meet the
Contents lists available atScienceDirect
journal homepage:www.elsevier.com/locate/ymben
Metabolic Engineering
1096-7176/$ - see front matter&2009 Elsevier Inc. All rights reserved. doi:10.1016/j.ymben.2009.09.003
Corresponding author. Fax: +56 2 6991084. E-mail address:[email protected] (J.A. Asenjo).
increasing demand of clinical trials the optimization of cell culture procedures and the development of high-yield processes is critical. Viral vectors are the most efficient vehicles for transfer-ring corrective genes into human cells. Non-viral gene delivery is potentially safer but at present, their use is limited by their inefficiency. Adenovirus vectors are therefore being extensively manipulated to make them suitable for specific applications. The improvement of AdV vector systems intended for gene therapy purposes should enhance the therapeutic potential as well as the safety features.
The use of adenoviruses has many advantages. These include accepting large quantities of exogenous DNA, they infect cells that are not in the division process unlike retroviruses that can only infect cells that are in the division process and do not integrate their genome into the host cell. One of the main advantages of adenovirus vectors is their ability to replicate at high titers in complementing cell lines. They possess advantages over other virus types as they are naturally benign viruses of the upper respiratory tract and can infect a large variety of dividing or nondividing cells. In fact over 50% of the population already show antibodies to adenovirus serotype 5, suggesting that it can be an extremely safe vector. First-generation vectors were developed for the gene delivery of several different genes involved in monogenic diseases. These adenoviral vectors were designed for systemic and repeated delivery in order to transfer the correct gene and are usually deleted in their E1 and E3 regions providing space for the gene of interest. The emergence of E1 containing vectors, due to homologous recombination in HEK293 cells, called replicative
competent adenovirus may have adverse effects. To address these drawbacks, new complementing cell lines and new vectors have been engineered. Second-generation vectors are replicative in-competent adenovirus, which are further deleted in E2a, E2b or E4. These vectors have shown reduced immunogenicity. Third-generation vectors, often called gutless or helper-dependent vectors, have been developed. These vectors are devoid of viral proteins. Consequently, they display a reduced immunogenicity and a long-term transgene expression. These vectors are repli-cated in HEK293 or other E1 complementing cell lines with the help of an E1 deleted adenovirus. To date 600 gene therapy clinical protocols have been reported, 27% of which used adenovirus vectors to deliver therapeutic or marker genes. The aim of this paper is to show the application of a methodology for optimizing cell growth and adenovirus production using MFA and cellular requirements for culture media design.
2. Materials and methods 2.1. Cell line and viral vector
The cell line used was HEK293 (ATCC CRL-1573), derived from human kidney fibroblasts transformed with Ad5 DNA and expressing the E1A and E1B proteins constitutively (Graham et al., 1977).
The adenovirus used for infection was an adenovirus type 5 containing the
b
-galactosidase reporter gene (Ad-LacZ). This recombinant adenovirus was a gift from the Pharmacotherapy Laboratory of the University of Chile. The viral stock was stored at 801C.2.2. Culture media
Dulbecos Modified Eagle Medium DMEM/F12 (Gibco), 1:1 glucose (4.5 g/l, Gibco) with 2.44 g/l sodium bicarbonate (Sigma), 10 mg/l ascorbic acid(Sigma), 1 mg/l putresine (Sigma), 0.02% p/v
Fig. 2.Reduction of ethanol intake after gene therapy (Ocaranza et al., 2008).
Fig. 1.Protective reaction against alcoholism: mutation of mitochondrial aldehyde dehydrogenase gene using an antisense mechanism.
Pluronic F68 (Sigma), 0.01% v/v ethanolamine (Sigma), 5mg/l sodium selenate (Sigma), 1.65
ml/l mercaptoethanol (Sigma),
5 mg/l apotransferrin (Sigma), 59.3 mg/l penicillin (Gibco), 100 mg/l streptomycin (Gibco) and 10% fetal calf serum, FCS, (Hyclone). The pH of the medium was 7, phenol red was used as, a pH indicator.2.3. Analytical methods
Total cell number and viability were determined using a haemocytometer. Viability was measured using trypan blue to visualize dead cells. Culture samples were frozen at801C until
ready for analysis.
Glucose, lactate and glutamine concentrations were analyzed using commercially available kits (Glucose GOD-PAP (Labkit), Lactate Reagent Set (Pointe Scientific), Glutamine Assay Kit (Sigma)). Amino acid and ammonia concentrations were mea-sured by HPLC (Cohen and Michaud, 1993).
2.4. Adaptation to serum-free medium
To reduce the concentration of FCS from 10% to 0%, different combinations of four supplements were added to the medium, apotransferrin (5 mg/l), BSA (Sigma) (40 mg/l), insulin (Sigma) (5 mg/l) and intralipids (Sigma) (0.01%v/v). With each combina-tion of supplements the FCS concentracombina-tion was decreased in stages from 10% to 1%, 0.1%, 0.01% and 0%.
2.5. Adaptation to suspension culture
Cells were grown in spinner flasks with 200 ml of DMEM/F12 1:1 medium without FCS and with the supplements mentioned above. To protect the cells from shear forces 0.1% Pluronic F68 was added.
3. Results and discussion
HEK293 cells were first grown as an attached culture in medium with a 10% Fetal Bovine Serum (FBS) supplement. They were then adapted to grow in serum-free media by successive dilutions in serum content, and to grow in suspension culture as described in (Cote et al., 1998;Tsao et al., 2001;Lee et al., 2003). The adaptation methodology included first the addition of apotransferrin, BSA and intralipids to the growth media. In order to adapt the HEK293 cells to grow in suspension culture they were grown in spinner flasks in supplemented serum-free medium with 0.1% pluronic F68. After 3 passages good cell growth was obtained with 80% viability and a maximum cell concentration of 1.5–2.0106cells/ml. Growth curves, glucose and lactate
con-centration profiles and
D
L/D
Gratio during culture are shown inFig. 3. The maximum cell concentration achieved in this culture setting was 50–100% higher than that obtained in attachment culture.
D
L/D
Gratio averaged 1.2 during mid-growth phase.3.1. Metabolic flux analysis and media design
Metabolic flux analysis provides a measure of the degree of involvement of various pathways in metabolic processes and cellular functions. The main input of these models are measured extracellular fluxes and the outcome is the net flux map of the cell including estimated steady-state rates for intracellular and extracellular reaction rates (Stephanopoulos et al., 1998). The
general dynamic mass balance for metabolites consumed/pro-duced by the cell can be represented bydC/dt=Sr, whereCis the metabolite concentration vector, r the vector of the metabolite rates andSthe stoichiometric matrix that contains the coefficients for the species in all the reactions that form the network. This generates a system of differential equations and unknown time-dependant fluxes. Considering that the characteristic time of metabolite concentration changes is much smaller than the cellular process one, the mass balance becomes Sr=0. Partitioning the matrix S and the rate vector r gives the Fig. 3.Suspension culture of HEK293 cells in serum-free media. (A) Growth curve of suspension culture. (B) Glucose and lactate concentrations vs. time. (C) Ratio of lactate specific production rate and glucose specific consumption rate vs. time.
expression: ðSm ScÞ rm rc ! ¼0;
wherermcontains the measured rates and rc the rates that will be calculated. As the number of measured fluxes is greater than the number of unknown fluxes the system is over determined. In this case a regression analysis method Table 1
Biochemical reactions considered in the metabolic network Glcþ2NADþ
þ2ADPþ2Pi-2Pyrþ2NADHþ2Hþþ2ATPþ2H
2O ð1Þ PyrþNADHþHþ-LacþNADþ ð2Þ PyrþCoAþNADþ -AcCoAþNADHþHþ þCO2 ð3Þ AcCoAþOAAþNADþ-aKGþCoAþCO 2þNADHþHþ ð4Þ aKGþNADþ
þCoA-SucCoAþCO2þNADHþHþ ð5Þ
SucCoAþADPþPiþFADþ-FumþATPþFADH
2 ð6Þ
FumþH2O-Mal ð7Þ
MalþNADþ-OAAþNADHþHþ ð8Þ
GlnþH2O-GluþNH3 ð9Þ
GluþNADPþ-a
KGþNH3þNADPHþHþ ð10Þ
MalþNADPþ-PyrþCO
2þNADPHþHþ ð11Þ PyrþGlu-AlaþaKG ð12Þ Ser-PyrþNH3 ð13Þ 2GlyþH2O-SerþCO2þNH3 ð14Þ Cys-PyrþNH3 ð15Þ AspþaKG-OAAþGlu ð16Þ AsnþH2O-AspþNH3 ð17Þ
Hisþ2H2O-Gluþ2NH3þCO2 ð18Þ
ArgþaKGþH2OþNADþ-2Gluþ2NH3þCO2þNADHþHþ ð19Þ
ProþADPþ2NADPþ
þPi-GluþATPþ2NADPHþ2Hþ
ð20Þ Ileþ2NADþþFADþþaKGþATPþ2CoA-SucCoAþAcCoAþGluþ2NADHþ
2HþþFADH
2þADPþCO2þPi ð21Þ
ValþaKGþATPþ3NADþþFADþþCoA-GluþSucCoAþADPþPiþ
3NADHþ3HþþFADH
2þCO2 ð22Þ
MetþSerþaKGþ2ATPþNADþ
þCoA-CysþSucCoAþGluþ2ADPþ2PiþNADHþHþ ð23Þ
ThrþCoAþNADþ-SucCoAþNH
3þH2OþNADHþHþ ð24Þ
PheþNADPHþHþ
-TyrþH2OþNADPþ ð25Þ
TyrþaKGþ2CoA-GluþFumþ2AcCoAþCO2 ð26Þ
Lysþ2aKGþ3NADþ
þFADþ
þ2CoA-2Gluþ2CO2þ2AcCoAþ3NADHþ3HþþFADH2 ð27Þ
LeuþaKGþATPþ3CoAþFADþþNADþ-Gluþ3AcCoAþADPþPiþNADHþHþþFADH
2 ð28Þ
0:0208Glcþ0:0377Glnþ0:0133Alaþ0:0070Argþ0:0261Aspþ0:0004Cysþ0:0006Gluþ 0:0165Glyþ0:0033Hisþ0:0084Ileþ0:0133Leuþ0:0101Lysþ0:0033Metþ0:0055Pheþ
0:0081Proþ0:0099Serþ0:0080Thrþ0:0040Tyrþ0:0096Val-Biomass
ð29Þ
0:066Alaþ0:067Argþ0:034Asnþ0:422Aspþ0:003Cysþ0:650Glnþ0:125Glyþ0:010Hisþ 0:026Ileþ0:049Leuþ0:027Lysþ0:019Metþ0:021Pheþ0:051Proþ0:128Serþ0:047Thrþ
0:009Trpþ0:024Tyrþ0:047Valþ0:078Glc-Virusþ0:592Glu
is used in order to minimize the error between the calculated fluxes from the mass balance equations and the measured extracellular fluxes in order to calculate the intracellular fluxes inrm.
In order to carry out a Metabolic Flux Analysis (MFA) for HEK293 during both cell growth and adenovirus production, a metabolic network was defined with the main reactions identified as relevant in terms of fluxes in the central carbon metabolism and nitrogen metabolism during both the cell growth and adenovirus production stages. A simplified network for central carbon metabolism was considered for both stages. The main carbon and nitrogen metabolism pathways considered include glucose and aminoacid metabolism lactate production, biomass synthesis and adenovirus production. A stoichiometric equation based on composition was proposed, for both biomass and adenovirus production. The biosynthesis of lipids, nucleotides and other cell components were not considered in this simplified metabolic network. Only metabolic reactions involving central carbon metabolism, amino acid metabolism and nonessential aminoacid biosynthesis were considered. The 29 reactions for the biomass synthesis stage are shown inTable 1. MFA was carried out following a methodology adapted fromHu (2007). Eqs. (1) and (2) correspond to glycolysis and lactate biosynthesis. Eqs. (3)–(8) represent the path form pyruvate to the TCA cycle (ATP production). Eqs. (9)–(11) correspond to glutaminolysis. Eqs. (12)–(28) correspond to the metabolism of amino acids, which include the main catabolic reactions of amino acids and the synthesis of nonessential ones. An alternative set of equations to describe this metabolic pathway is presented in Henry et al. (2005)andNadeau et al. (2000). The general equation for biomass considered was
aC6H12O6þbC5H10N2O3þXciCwiHxiNyiOzi-CHaNbOg
where the first and second term correspond to glucose and glutamine, respectively, CHaNbOgto biomass and the third term
to the contribution of each amino acid in the synthesis of biomass. An average composition for mammalian cells was considered, which is 75% protein, 7.5% RNA, 3.75% DNA and 13.75% lipids. This gave the amino acid balance and stoichiometric values where obtained using a carbon and nitrogen balance which resulted in Eq. (29). In order to develop a reaction for adenovirus formation this was also done using its molecular composition, which is 87% protein and 13% DNA (Fields, 1996). The amino acidic composition of the human adenovirus type 5 was used and following the number of copies of each protein, the stoichiometric coefficients associated to each amino acid were determined (Fields, 1996). This resulted in Eq. (30) as the stoichiometric equation for adenovirus.
MFA results allow the visualization and analysis of the distribution of carbon in the cell metabolism. Our aim was to use MFA to evaluate cell influx (growth) requirements and reduce nutrient concentrations in order to allow cell growth and minimize production of lactate and ammonia. Media was designed based on the stoichiometric ratios of each nutrient to glucose and glutamine, which in turn are based on specific rates of consumption of each nutrient relative to the carbon and nitrogen source. In order to do this, the main metabolites in the culture supernatant were measured. The variables measured in the course of the culture were biomass, glucose, lactate, amino acids (by HPLC) and ammonia. MFA allowed determination of all intracellular fluxes and the quantification of resources required for biomass production. All specific rates of nutrient consumption and product synthesis were calculated (mmol/ 109cells/h). The rate of CO2 synthesis was estimated as
3 times the feeding rate of pyruvate into the TCA cycle. The
experimental rates calculated were those obtained from experi-mental values measured between 94 and 141 h, which was considered to be the mid-growth phase when cell composition is at steady state.Fig. 4shows the cumulative flux rates.Fig. 4A shows cumulative lactate vs. glucose and Fig. 4B shows cumulative glutamine vs. glucose. This figure shows that 1.2 moles of lactate are produced per mole of glucose consumed during culture, and 0.12 moles of glutamine are required per mole of glucose consumed.
Specific consumption and production rates were determined from the derivative of accumulative metabolite measurements and the integral of viable cells. For biomass, Eqs. (1)–(29) were used and for virus production Eq. (30) was included (Table 1). In the first case 31 components were used and in the second 32. Intracellular fluxes were determined by solving the equation system derived from the metabolic network’s structure and extracellular measurements for the rates of glucose consumption and aminoacids consumption/production, lactate production, biomass and adenovirus synthesis by least squares method. Metabolic fluxes obtained from MFA for this system are shown in Fig. 5. This shows that over 50% of the carbon resources being fed into glycolysis are derived towards lactate production instead of biomass or energy. Glucose consumption Fig. 4. Stoichiometric ratios for suspension culture of HEK293 cells in serum-free media. (A) Cumulative lactate production vs. cumulative glucose consumption. The ratio of cumulative lactate production vs. glucose consumption is 1.219 (mol/mol). (B) Cumulative glutamine consumption vs. cumulative glucose consumption. The ratio of cumulative glutamine consumption vs. glucose consumption is 0.1256 (mol/mol).
Fig. 5.Results of metabolic flux analysis for cells growing in serum free media. Bars represent normalized flux values at 3 times: 94, 123 and 141 h (in the same order in the figure), which correspond to the mid-growth phase.
as well as TCA cycle activity is reduced as the culture progresses, but the
D
L/D
G ratio increases, indicating that a larger fraction of the glucose consumed is directed towards lactate production.Fig. 6shows the fluxes in the central carbon metabolism and the amino acid metabolism normalized to the biomass production rate. We observe that the largest fluxes correspond to the central carbon metabolism. Glutamine is consumed and fed into the TCA cycle as
a
ketoglutarate. As aminoacid fluxes are smaller, estimation errors from MFA are more significant for these fluxes.The lactate produced to glucose consumed ratio
D
L/D
G is a good indicator of the metabolic state of the cell, as it shows the proportion of the carbon source that is being directed towards lactate production instead of biomass or energy production. The theoretical maximum for this parameter (D
L/D
G)max=2. The ratiobetween lactate production and glucose consumption was ca. 1.2 during exponential cell growth (Fig. 4A) and MFA shows that a large amount of the glucose consumed goes into lactate synthesis (Fig. 5). Given the fact that glucose is the main carbon source, and that lactate inhibits cell growth the objective set was to reduce lactate production by 50%. Since the theoretical maximum is that 2 moles of lactate can be produced for each mole of glucose ca. 60% of the glucose consumed is used in lactate production. Hence, to reduce lactate by 50% glucose was reduced by ca. 30%, which gives a value of 2.19 g/l glucose in the new media. Furthermore, by carrying out MFA using the 29 equations of the central carbon metabolism already described, the composition of an improved medium based on the cell requirements was designed. The composition of the improved cell growth medium is shown inTable 2. As an initial approach (before amino acid reduction) a medium reduced in glucose (2.19 g/l) was used. Concentrated glucose and glutamine was added in a discrete fed batch mode during the culture keeping the minimum concentration of glucose at 0.2 g/l. The results obtained with this strategy are shown in Fig. 7. Compared with the original medium and batch growth an improved cell concentration of 3–4106cells/ml was obtained (Fig. 7A). Also a lower
D
L/D
Gwasachieved, indicating a more efficient use of carbon resources by the cell (Fig. 7C).
3.2. Metabolic flux analysis for adenovirus production
Our next step consisted in applying MFA principles for adenovirus production after infection. Fig. 8 shows virus concentration after infection in cultured attached cells growing with 10% serum, with 0% serum attached and with 0%
serum growing in suspension. Purified viruses were obtained by both chromatography using Q-Sepharose XL and aqueous two-phase systems in a PEG 1450 and phosphate system. Higher infectious particle titers are obtained for serum-free systems.
For the adenovirus production stage an additional equation is considered in the MFA, corresponding to adenovirus synthesis. This equation was developed based on the adenovirus protein coat Table 2
Original medium (OM) vs. improved medium for cell growth (IM)
Concentration [mM] in OM Concentration [mM] in IM % Reduction
Glc 17.51 12.2 30 Gln 2.50 1.52 39 Arg 0.70 0.20 71 Asn 0.05 0.05 1 Asp 0.05 0.05 2 Gly 0.25 0.12 51 Ile 0.42 0.16 61 Leu 0.45 0.17 63 Lys 0.50 0.04 92 Met 1.16 0.05 96 Ser 0.25 0.20 21 Thr 0.45 0.11 76 Tyr 0.22 0.03 87 Val 0.45 0.06 86
Fig. 7.Fed-batch suspension culture of HEK293 cells in serum-free media with low initial glucose concentration. (A) Growth curve of fed-batch suspension culture. (B) Glucose and lactate concentrations vs. time. (C) Ratio of lactate specific production rate and glucose specific consumption rate vs. time.
and DNA composition described in the previous section (Fields, 1996), and is shown inTable 1(Eq. (30)).
The results of the MFA obtained for the virus production phase are shown in Fig. 9. Major differences with the cell growth phase can be observed mainly in the ratio of lactate to glucose
D
L/D
G, which is higher than in the cell growth phase.(
D
L/D
G)virus=1.8 compared to (D
L/D
G)growth= 1.2, which meansthan 90% of the glucose consumed is used in lactate production during the virus production stage. Hence to reduce lactate by 50%, glucose was reduced ca. 45% which implies a glucose concentration in the virus production phase of 1.72 g/l. All of this information was used to design an improved medium with nutrients required for adenovirus production, which is shown in
Table 3.
Fig. 8.Adenovirus production in HEK293 cells. Adenovirus concentration in attachment culture supplemented with 10% FBS, 0% FBS and in suspension with 0% FBS. MOI= 10 ip/cell.
Fig. 9.Results of metabolic flux analysis for cell growth (light) and virus producing (dark) stages in suspension, serum-free media. Bars represent normalized flux values.
Table 3
Original medium (OM) vs. improved me´dium for adenovirus production (IMV) Concentration [mM] in OM Concentration [mM] in IMV % Reduction
Glc 17.51 9.6 45 Gln 2.50 1.21 51 Arg 0.70 0.38 46 Asn 0.05 0.03 30 Asp 0.05 0.06 20 Gly 0.25 0.32 28 Ile 0.42 0.27 35 Leu 0.45 0.30 33 Lys 0.50 0.31 38 Met 1.16 0.08 93 Ser 0.25 0.17 30 Thr 0.45 0.20 56 Tyr 0.22 0.09 59 Val 0.45 0.21 52
This minimal media was tested for cell growth and adenovirus production. Results are shown inFig. 10. During the cell growth stage results obtained are comparable to those obtained with the original media, reaching ca. 1.2106cells/ml at the time
of infection. Cells were infected at 118 h, and after this time a decrease in viability is observed inFig. 10A, as expected. A drastic change in the cumulative lactate to glucose ratio is observed upon infection. This figure shows that 1.2 moles of lactate are produced per mole of glucose consumed during culture, and 0.12 moles of glutamine are required per mole of glucose consumed. Although evaluation of virus was not carried out in this experiment the 3 parameters measured in Fig. 10 would suggest that virus production would be adequate in this specially designed medium.
Acknowledgments
This work was supported by DID University of Chile, Project INI 06/04-2 and Fondecyt Grant 1061119. Support from the Millennium Scientific Initiative ICM P05-001F is also acknowl-edged.
References
Cohen, S.A., Michaud, D.P., 1993. Synthesis of a fluorescent derivatizing reagent, 6-aminoquinolyl-N-hydroxysuccinimidyl carbamate, and its application for the analysis of hydrolysate amino acids via high-performance liquid chroma-tography. Anal. Biochem. 211, 279–287.
Cote, J., Garnier, A., Massie, B., Kamen, A., 1998. Serum-free production of recombinant proteins and adenoviral vectors by 293SF-3F6 cells. Biotechnol. Bioeng. 59, 567–575.
Fields, B.N., 1996. Fields Virology. Lippincott Williams & Wilkins, Boston, MA. Graham, F.L., Smiley, J., Russell, W.C., Nairn, R., 1977. Characteristics of a human cell
line transformed by DNA from human adenovirus type 5. J. Gen. Virol. 36, 59–74.
Henry, O., Perrier, M., Kamen, A., 2005. Metabolic flux analysis of HEK-293 cells in perfusion cultures for the production of adenoviral vectors. Metab. Eng. 7, 467–476.
Hu, W.S., 2007. An Advanced Course in Cellular Bioprocess Technology: Funda-mentals and Frontiers. University of Minnesota, Minneapolis, MN.
Lee, Y.Y., Yap, M.G., Hu, W.S., Wong, K.T., 2003. Low-glutamine fed-batch cultures of 293-HEK serum-free suspension cells for adenovirus production. Biotechnol. Prog. 19, 501–509.
Nadeau, I., Jacob, D., Perrier, M., Kamen, A., 2000. 293SF metabolic flux analysis during cell growth and infection with an adenoviral vector. Biotechnol. Prog. 16, 872–884.
Nadeau, I., Kamen, A., 2003. Production of adenovirus vector for gene therapy. Biotechnol. Adv. 20, 475–489.
Ocaranza, P., Quintanilla, M.E., Tampier, L., Karahanian, E., Sapag, A., Israel, Y., 2008. Gene therapy reduces ethanol intake in an animal model of alcohol dependence. Alcohol Clin. Exp. Res. 32, 52–57.
Stephanopoulos, G., Aristidou, A., Nielsen, J., 1998. Metabolic Engineering— Principles and Metodologies. Academic Press.
Tsao, Y.S., Condon, R., Schaefer, E., Lio, P., Liu, Z., 2001. Development and improvement of a serum-free suspension process for the production of recombinant adenoviral vectors using HEK293 cells. Cytotechnology 37, 189–198.
Fig. 10.Adenovirus production in a suspension culture of HEK293 cells in serum-free media with initial low glucose concentration. Cells were infected and media replaced at 118 h. (A) Growth curve of fed-batch suspension culture. (B) Glucose and lactate concentrations vs. time. (C) Ratio of lactate specific production rate and glucose specific consumption rate vs. time for cell growth (dark) and virus producing (light) stages.