The Australian National University
Centre for Economic Policy Research
DISCUSSION PAPER
Parental Investment in Children:
Differential Pathways of Parental Education and
Mental Health
Chikako Yamauchi
DISCUSSION PAPER NO. 621
September 2009
ISSN: 1442-8636 ISBN: 978 1 921693-02-1
Chikako Yamauchi, Economics Program, Research School of Social Sciences, Australian National University, Email: chikako.yamauchi@anu.edu.au
Acknowledgements:
I thank the editor Paul Miller, two anonymous referees, and staff at the Department of Families, Housing, Community Services and Indigenous Affairs (FaHCSIA) for many useful comments on an earlier draft. I also acknowledge support from the Social Policy Evaluation, Analysis and Research centre at the Australian National University in preparing the first version of this paper. This paper uses unit record data from the Longitudinal Study of Australian Children (LSAC) Survey. The LSAC Project was initiated and is funded by the Australian Government Department of FaHCSIA and is managed by the Australian Institute of Family Studies (AIFS). The findings and views reported in this paper, however, are those of the author and should not be attributed to either FaHCSIA or AIFS.
Abstract
This paper examines pathways through which parental characteristics might affect children’s cognitive and behavioural outcomes. Using the 2004 LSAC, I show that more educated and mentally healthier parents are likely to have children with better outcomes. While educated parents are more frequently engaged in education-oriented activities with their children, mentally healthier parents exhibit more favourable parenting practices. To the extent that these results reflect causal relationships, they suggest that parental education and mental health affect children’s outcomes through different pathways.
JEL Codes: D1, I2, J2
Keywords: parental education, parental mental health, test score, behavioural outcome, parenting
1 Introduction
Children’s outcomes, such as their cognitive skills and social-emotional well-being, are important not only in their own right, but also because they can affect the child’s future educational and economic achievements (Robertson and Symons (1990) Currie and Thomas (1999), and Heckman, Stixrud and Urzua (2006)). Numerous studies find that parents with higher socio-economic status tend to have children with better outcomes. However, relatively little is known about the pathways through which parental characteristics affect children’s outcomes.
This study explores such pathways particularly focusing on parental educational attainment and their mental health. Educational attainment is an important indicator of parents’ socio-economic status. It has been found that educated parents spend more time with their children (Guryan, Hurst and Kearney (2008) and Kimmel and Connelly (2007) who used the wage rate instead of education). While Guryan et al. (2008) showed that the positive relationship between parental education and time spent with children held for broad categories of activities (basic care, educational, recreational, and travel), less is known about more specific sorts of activities that are more frequently undertaken by educated parents.
Roles played by parental mental health in determining investment in children have not been fully addressed. However, given that mental health affects individual interactions with others in general, it is possible that parents’ mental health influences the quality of interactions with their children – an aspect which has not been much addressed in the literature.1
My results drawn from the 2004 Longitudinal Study of Australian Children (LSAC) show that children of more educated parents and mentally healthier parents have better cognitive skills
1 It has been reported that a mentally healthy child can learn more effectively (Currie, 2009); however less attention
(measured by the scores obtained in the Peabody Picture Vocabulary Test (PPVT, which indicates hearing vocabulary) and the Who Am I? Test (WAIT, which indicates basic numeracy and literacy)) and non-cognitive skills (measured by the level of hyperactivity, conduct problems, peer problems, pro-social behaviour and emotional symptoms). The results reveal that educated parents more frequently engage in education-oriented activities with their children, including reading to children and taking them to a library, museum, swimming pool, or school event. On the other hand, mentally healthier parents are found to exhibit more disciplined and less irritable parenting practices. To the extent that these results reflect causal relationships, they suggest that parental education and mental health affect children’s outcomes through different pathways.
This study is the first attempt to combine the two strands of literature in Australia pertaining to early childhood development and parental time use. In particular, it departs from previous research by providing evidence on the relationships between parental education and parental investment, and between parental education and children’s outcomes, from the same set of children and their parents. Previous studies on time use have shown that mothers participating in the labour market tend to preserve their time spent on caring for children, particularly developmental care, despite the hours spent at work (Craig, 2007, Folbre and Yoon, 2007). However, since time use surveys do not tend to include information on children’s outcomes, the relationship between children’s outcomes and parental socioeconomic status has not been demonstrated for the same set of samples.2
The results of this study provide crucial links to previous findings on children’s outcomes. For instance, Leigh and Gong (2009) showed that the gap in the PPVT score between indigenous and non-indigenous children was reduced by one-third to two-thirds after controlling for the socioeconomic status of the family. My study provides evidence for a possible scenario for
2 Other studies have explored the correlation between parental work hours and children’s educational activities
(Brown, Bittman and Nicholson, 2007), and the sensitivity of the time use analysis against different ways of defining child care quality (Kalenkoski and Foster, 2008).
pathways through which the family’s socioeconomic status explains this score gap. Also, Bradbury (2007) found that indicators for children’s behavioural (or socio-emotional) outcomes were associated with factors such as parents’ perceptions of themselves as being poor and their experiences of financial hardship. My results suggest one pathway for this relationship is that parents with poor mental health (who are more likely to report these problems conditional on household income) are more likely to engage in parenting practices that are irritable and low in discipline.
The remainder of this paper is organised as follows: the next section illustrates the theoretical framework, followed by the description of the empirical method and data. I next discuss the results of children’s outcome equations, followed by the results for input demand functions. The final section provides my concluding remarks.
2 Conceptual Framework
A framework put forward by Becker (1965) has been utilised in the analysis of time allocation. This section overviews the framework and consider several channels which predict differential investment patterns between parents with varying levels of educational attainment and mental health. Suppose a household consists of parents and a child. The parents derive utility (or disutility) from a commodity, Zi, which include the child’s outcomes. Thus, u = U(Z1, Z2, …, Zn). In order to produce a unit of Zi, parents use a certain amount of their own time, Ti, and market goods, Xi. Genetic traits and other unobserved family endowments, ei, also affect a child’s outcome. That is,
Zi = h(Ti, Xi, ei) (1)3
3 Becker (1965) specified that a certain amount of each input is needed to produce a unit of Z
i. That is, Ti = tiZi and
Xi = biZi, where ti is the amount of parental time required to produce one unit of Zi, and bi is the amount of market
goods required to produce one unit of Zi. The introduction of unobserved traits follows Rosenzweig and Shultz
If Zi is a child’s cognitive skills, examples of market goods include books and preschool services, and examples of unobserved traits include IQ and diligence. Parental time inputs can be characterised by the frequency of educational and stimulating interactions with the child and the ‘type’ of interactions with the child. Using a set of questions on parenting practices which categorise parents into four groups, psychologists have found that ‘Authoritative’ parenting, characterised by high levels of warmth and discipline, is positively associated with children’s outcomes (Baumrind, 1973; Baumrind, 1991; Maccoby and Martin, 1983).4 Applying these findings to the conceptual framework, it may be assumed that Ti is differentiated by type of parenting practice; thus, parental time inputs of different types can have varied effects on children’s outcomes, conditional on the frequency of parental interactions with their child.
These inputs were chosen under the full income constraint, which combine budget and time constraints (pibi + witi)Zi = wiT, where pi and wi represent the price of market goods and the wage rate of the parents, respectively. Under this framework, the first order condition suggests that a commodity, Zi, is consumed at the level where its marginal utility equals the full price of Zi, or Ui = λ(pibi + witi), where λ is the lagrangian multiplier for the full income constraint.
This Beckerian framework provides a number of implications regarding the pattern of parental time allocation, which differs according to the wage rate. First, the substitution effect stemming from a higher wage rate discourages parents receiving higher wage rates to engage in activities that do not produce earnings (or to produce Z-goods that are not ‘work-related’), because forgone earnings associated with non-work commodities are greater. This suggests that parents likely to receive a higher wage rate, such as more educated parents, might spend less time
4 Conversely, ‘Authoritarian’ parenting, characterised by high control and low warmth, is negatively associated with
poor academic achievement and aggressiveness. ‘Permissive’ parenting, characterised by high warmth and low control, and ‘disengaged/neglectful’ parenting, characterised by low levels of warmth and control, have been associated with behavioural problems.
engaging in child care. This holds for mentally healthier parents as well, if they are more productive and face higher wage rates in the labour market.
This effect, however, may be offset by the income effect that also arises from a higher wage rate. Thus, the overall effect depends on the relative size of the two effects. In addition, income elasticity is likely to differ across different Z-goods. If parental interaction with children is a luxury good, then the income effect will induce a greater consumption of such interaction.5 Recent studies suggest this is the case; parental education (or wage rate) was positively associated with the time parents spent on child care (Kimmel and Connelly, 2007; Guryan et al., 2008), while it was negatively associated with time spent on home production and leisure (Aguiar and Hurst, 2007; Guryan et al., 2008).
This paper does not aim to disentangle the income and substitution effects; rather, it estimates the overall relationship between parental characteristics and parental investment (reduced-form demand function) and the relationship between parental characteristics and children’s outcomes (reduced-form outcome equations) based on the conceptual framework. Given the first order conditions, the equilibrium level of parental goods/time input depends on the price of market goods and parental wage rate. That is, the reduced form (input) demand functions for goods and time are:6
Xi* = f(pi, wi; ei) (2)
Ti* = g(pi, wi; ei) (3)
5 See Guryan et al. (2008) for a further discussion on alternative mechanisms which give rise to the positive
relationship between parental education and the time spent with their child.
6 Note that household income does not enter the functions f and g, because it is endogenously determined in the
model. Becker (1965) included unearned income as another exogenous factor in the budget constraint; however, to the extent that unearned income (such as interests on savings) reflects the parental labour supply decisions which had been made since the child’s birth, it is possible that the amount of savings is correlated with the child’s unobserved ability or attributes. Thus, unearned income was abstracted in this paper. This does not affect the implications concerning the effect of parental wage rate and the price of market goods.
By substituting the optimal input levels into the production function of Zi, the reduced-form outcome functions can be derived as:
Zi* = h(Xi*, Ti*; ei) = h(f(pi, wi; ei)¸ g(pi, wi; ei) ; ei) = h’(pi, wi; ei) (1’)
Suppose that educational attainment, EDi, and mental health, MHi, affect the wage rate parents would receive in the labour market (i.e., wi = w(EDi, MHi)). Also, suppose that the level of prices for market goods and the availability of services relevant for the production of children’s outcomes are fixed within a neighbourhood. This implies that pi can be replaced with a set of indicators for residential neighbourhood, µj, where j represents the neighbourhood in which household i is located. Under these assumptions, Equations (3) and (1’) can be rewritten as:
Ti* = g(µj, EDi, MHi; ei) (3’)
Zi* = h(µj, EDi, MHi; ei) (1’’)
The intuition behind this setup is that relatively distant factors (such as prices, parental education and their mental health) affect children’s outcomes through influencing more proximal factors, including parental time input, Ti. The relationship between the distant factors and proximal factors is represented by Eq.(3’), while the relationship between the distant factors and outcomes is summarised by Eq.(1’’).
Rosenzweig and Schultz (1983) showed that the consistent estimation of Eq.(1) is difficult due to the endogeneity of the inputs in the production function. That is, parents are likely to use their knowledge of unobserved traits of their child, ei, to decide the optimal level of Ti* and Xi*. For example, parents who know that their child has lower innate ability to develop language skills might read books to the child more often. In this case, the OLS estimation of Eq.(1) would underestimate the effect of the frequency of book reading. Using the instrumental variable
method, Rosenzweig and Schultz (1983) demonstrated that the OLS estimation of Eq.(1) is indeed biased. A bias could be substantial that it changes qualitative results (Cebu Study Team, 1991). Furthermore, the absence of data on potential inputs such as the quality of peers in the neighbourhood and at the preschool means that the estimation of Eq.(1) could suffer from an omitted variable bias as well (Todd and Wolpin, 2003).
On the other hand, while the estimation of Eq.(1’’) or Eq.(3’) faces a similar endogeneity issue, it is unlikely that pre-determined parental characteristics such as upbringing and education are determined as a function of the child’s unobserved traits. Also, even if some of the inputs are not observed in data, it is possible to estimate Eq.(3’) only for observed inputs. Based on these considerations, this paper focuses on the analysis of Eq.s (3’) and (1’’).7
3 Empirical Methodology
The LSAC provides information on the location of each household, which enables the use of the following postcode-level fixed effects model:
Zij = β0 + β1EDij + β2MHij + β3CHij + µj + eij (4) Tij = β0 + β1EDij + β2MHij + β3CHij + µj + eij (5)
Eq.s (4) and (5) are empirical analogues of Eq.s (1’’) and (3’), respectively, and they assume the linear specification for each covariate. The subscripts stand for a household (i) and the household’s postcode area (j). In order to focus on the correlations between the respective outcome and the two key parental characteristics (education and mental health), the basic characteristics of the principal parent and household, CHij, were controlled.8
7 If instruments for parental inputs or data on siblings had been available, they could have been used to estimate
Eq.(1).
8 The basic characteristics of the child included age, place of birth, indigenous status and language spoken at home.
The principal parent’s age, place of birth and language spoken at home were also controlled. The principal parent’s upbringing was controlled by the migration status of their father and mother as well as whether English was the first
As discussed in the previous section, the estimates for Eq.s (4) and (5) are not completely free from a possible bias due to the household-level unobserved heterogeneity. For example, educated parents may also have demonstrated higher IQ levels or a predisposition to being calm and patient (included in eij), which could have been transmitted to children.9 In these cases, even if the correlation between parental education and children’s outcomes could be identified, it would be difficult to determine how much of that correlation was due to parental education per se. Also, time-variant parental characteristics such as mental health could be affected by children’s outcomes, possibly creating a reverse causality. This is less likely for parental education, which is generally determined prior to the birth of their child. Nevertheless, to the extent that parents living in the same postcode area share similar unobserved traits, ability, and preference, the effects of these factors are controlled. Postcode-level fixed effects also control for effects of differing availabilities and quality of community resources across postcode areas.
Given the scarcity of Australian evidence on the relationship between parental attributes and children’s outcomes coupled with the relationship between parental attributes and their time inputs in their children’s outcome production, the results of this study makes important contributions to the literature.
4 Data
Out of the sample of 4983 children from 4 to 5 years of age, 4898 (98 percent) had non-missing values for the covariates included in the regression equations. This group of children was used as the main analysis sample. The sample size for each regression equation varied as a small number of observations also had missing values in the outcome variables.
language the principal parent spoke as a child. A set of dummies was included to indicate the marital status of the principal parent and the existence of a resident secondary parent. Demographic structure was measured using the numbers of siblings and other family members, except for the parents.
Outcome variables
Children’s cognitive skills were measured by scores obtained from the Who Am I? Test (WAIT) and the Peabody Picture Vocabulary Test (PPVT). The WAIT score assessed a child’s readiness for school by asking basic numeracy and literacy questions.10 The PPVT score measured listening comprehension ability for spoken words in standard English.11 Table 1 shows that both scores averaged 64. Children’s behavioural outcomes were indicated using the five subscales of the Strengths and Difficulty Questionnaire (SDQ). These scales indicate the tendency for a child to show pro-social behaviour (the higher the better) and four kinds of difficulties (the lower the better): hyperactivity, conduct problems, peer relationship problems and emotional symptoms (see Appendix 1 for details). All scores ranged from zero to 10. Based on the clinical thresholds (Goodman, 1997), 11 percent of children had scores falling within the abnormal range for hyperactivity, while 13 percent experienced peer problems and 7 percent emotional problems. Four percent of children indicated an abnormally low level of pro-social behaviour.12
Parental time input
Parental inputs were measured mainly by indicators of the parent’s involvement in educational activities and by their parenting practices. Table 2 indicates that, in the average household, someone had read to the child from a book and had involved the child in everyday activities on 3 to 5 days of the previous week [indicated by the average value of 2, in the range of 0 (none) to 3 (every day)]. Given that the parents themselves were the only adults living in 93 percent of the households, in most cases they carried out these activities. In the month prior to the data
10 The WAIT asks a child to copy objects, such as a circle, triangle and diamond; to write numbers, letters, words
and a sentence and to draw a picture of him/herself. The various levels assigned to a child’s responses were totalled to form the test score (De Lemos and Doig, 1999).
11 The PPVT asks a child to select the picture considered to best illustrate the meaning of a stimulus word presented
orally by the examiner (Dunn and Dunn 1997). A sample set of words includes ‘sawing, wrapping, cage, exercising, claw, fountain, nest, delivering, frame and envelope’.
12 Given that ‘approximately 10 percent of a community sample scored in the abnormal band on any given score’
(Goodman, 1997), these proportions appear to be reasonable. Since two of the questions used in the LSAC to measure conduct problems were different from Goodman (1997), his threshold was not applied to this symptom. The regression analysis shows the results based on the scores themselves. The results did not change substantively when dummy variables were used indicating children who exhibited scores falling within the abnormal ranges.
enumeration, most children had been taken to a playground or a swimming pool. One in two had been taken to a library and a school, cultural or community event. The average household contained 21 to 30 children’s books [indicated by the average value of 3.7 in the range of 0 (being none) to 4 (equating to more than 30)].
Parenting practices were measured using parents’ self-assessments and a set of indicators for warmth, control/discipline and irritability (see Appendix 3 for details). The average parent regarded themselves to be a better-than-average parent, indicated by the mean value of 3.9, ranging from 1 (not very good at being a parent) to 5 (a very good parent). Most parents considered the statements related to high warmth and good control/discipline to describe them (the indicators averaged around 4 on a scale from 1 to 5), while they did not identify with the statements related to irritable attitudes (the average here was 2).
Characteristics of the principal parent
Parental education was characterised by a set of dummy variables indicating the principal parent’s level of educational attainment.13 Twelve percent of the principal parents had completed a graduate diploma or postgraduate degree, while 16 percent had completed a Bachelor’s degree (Table 3). Fifteen percent had completed Year 12 only, while 17 percent had finished Year 12 and had a qualification (other than the qualifications already stipulated). The remaining 39 percent of the parents had not completed Year 12. Of these, 18 percent had a qualification, and 21 percent did not (omitted category).
Parental mental health was indicated by a vector of two variables: the principal parent’s score on the Kessler 6 (K6) scale for mental health and a dummy variable indicating whether this scale
13 Due to the lack of information on the parent’s number of work hours, the wage rate was not computable in the
LSAC. Even if these figures were available, a credible exclusion restriction, which is required for the identification of the wage rate with the correction for possible endogenous entry into the labour market, would have been unlikely. Also, since information on the secondary parent was not available for all the children, the focus was placed on the characteristics of the principal parent. The main results did not change when a secondary parent’s characteristics were included, together with the dummy variable indicating a household with a secondary parent.
was available in the data. The K6 scale assesses overall psychological condition in the past 4 weeks and is a widely used indicator for the likelihood of serious mental illness (Kessler et al., 2003).14 Based on this scale, 4 percent of parents were considered to have a serious mental illness. Other variables indicated that the average age of the principal parents was 35 years old, and that 97 percent were women. One in 5 was born outside of Australia, and 15 percent spoke a language other than English at home.15
5 Results
5.1 Children’s Outcomes and Parental Inputs
While it is known that the OLS estimates of Eq.(1) are likely to be biased, a descriptive analysis of the correlation between children’s outcomes and their parents’ time inputs provides an opportunity to consider underlying causal relationships. Appendix Table 1 shows the results, controlling for the postcode-area-level fixed effects. First, many indicators of parental involvement with children indicated positive associations with children’s outcomes. For example, the number of parental working hours was correlated with positive outcomes such as higher WAIT and PPVT test scores, more prosocial behaviour, and fewer behavioural problems. These associations may be partially due to, for example, the possibility that children of working parents have higher unobserved ability and a more favourable predisposition. Similarly, children from households with many books for children tended to show higher test scores and fewer behavioural problems. Certain kinds of parental interactions with children in the past week also showed positive associations with children’s outcomes such as reading to the child and doing art/craft activities. A clear pattern of positive correlation was also found between children’s outcomes and parental visits with the child to a library, live performance, school event, religious service, museum, and playground in the past month. Finally, parents who positively assessed
14 See Appendix 2 for the computation of the scale. The dummy variable was included because information on K6
scale was missing for 833 households (17 percent) in the data. Other indicators for stress and pressure are available in the LSAC; however the inclusion of those variables did not alter the results qualitatively. Thus, for simplicity, these variables were not included.
15 The indigenous status of the child and parent could not be separately examined due to the small sample size. Thus,
their parenting practices were less likely to have children with behavioural problems and more likely to have children with better cognitive skills.
However, some types of parental involvement were negatively correlated with children’s outcomes. For example, children of parents who told the child a story that was not from a book had lower WAIT and PPVT test scores and a higher probability of exhibiting peer problems. Also, irritable parenting was associated with many negative outcomes. Other types of parental involvement did not indicate a clear pattern of correlation with the child’s outcomes. For instance, children of parents who did musical activities with the child in the past week were more likely to have lower PPVT scores and to show some behavioural problems, but were also more likely to exhibit prosocial behaviours. The negative relationship could have arisen, for example, if parents whose children had exhibited behavioural problems tried to provide exposure to artistic activities.
While these results are subject to a possible bias, they provide an indication that parental inputs that are consistently associated with positive outcomes are likely to be better candidates for inputs that have positive effects on outcomes, compared to inputs that show negative correlation with some outcomes but positive correlations with others. Below, I focus on parental inputs that are consistently associated with positive outcomes.
The results also indicate that children’s outcomes exhibited no discernible difference across parenting styles differentiated by the level of warmth. In the psychological literature, the indicators of warmth and control/discipline have been used to categorise parents into the four groups of different parenting styles: Authoritative (high warmth and discipline), Authoritarian (low warmth and high discipline), Disengaged (low warmth and discipline) and Permissive (high warmth and high discipline). However, the results show that, compared to children whose parents engaged in Disengaged parenting, children whose parents engaged in Authoritative and
Authoritarian parenting exhibited a similarly lower probability of having behavioural problems.16 When the indicators for warmth and control were used instead of the three dummy variables indicating the four parenting styles, only the indicator for control exhibited clear correlations with better outcomes, while the level of warmth indicated positive correlations with some of the outcomes and negative correlations with other outcomes (not shown). These results suggest that the level of warmth might play a more limited role for this sample. Based on this observation, in the regression analysis below, I use the indicators for warmth and control as they are, in addition to a set of three dummy variables indicating the four parenting styles.
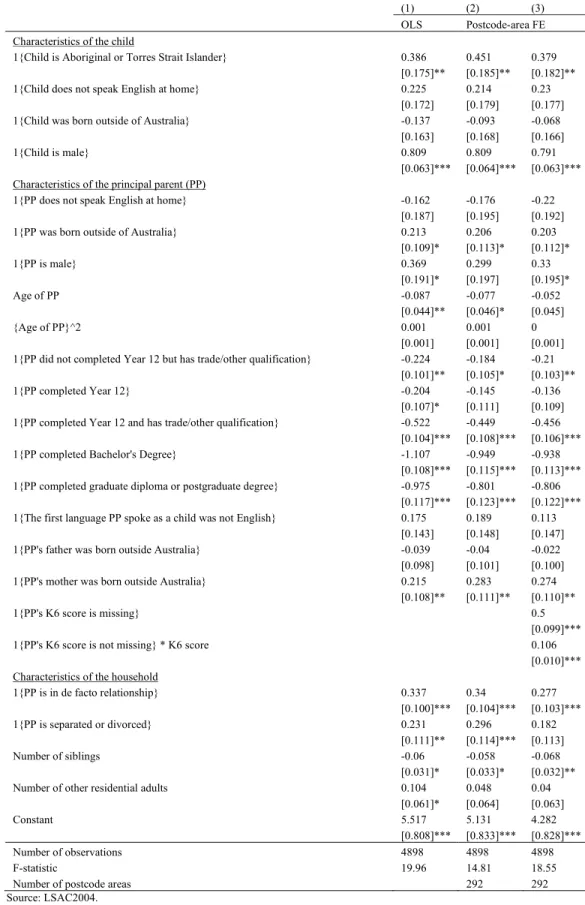
5.2 Cognitive and Social-Emotional Outcomes
Table 4 presents the results of estimating Eq.(4) for the hyperactivity score using the Ordinary Least Squares (OLS, Column 1) and Fixed Effects (FE, Columns 2 and 3) models. For comparison, the results in Columns 1 and 2 do not include the mental health variables. The results showed that educated parents and mentally healthier parents have children with lower hyperactivity scores. For example, the OLS results show that the score for children whose parents had completed a Bachelor’s degree was 1.107 units smaller than that for the omitted group of children whose parents had not completed Year 12, holding constant other characteristics of the child, principal parent and household.17 This is equivalent to 32 percent of the mean score. The results based on the Fixed Effects model (Column 2) suggest that part of the correlation arose because parents of similar education levels lived in the same postcode area. With the fixed effects, the size of the coefficient shrank by 19 percent on average across the 5 variables characterising parents’ education. For instance, the coefficient for parents with Bachelor’s degrees changed from -1.107 to -0.949, or from 32 to 27 percent of the average score.
16 Also, children whose parents engaged in Authoritarian parenting had higher test scores, while children whose
parents engaged in Authoritative parenting had similar scores to children whose parents engaged in Disengaged parenting. See Appendix 3 for the definition of the four parenting styles.
17 This set of control variables included a set of 5 dummy variables indicating the birth month of a child (at
two-monthly intervals) in order to capture a possible difference in cognitive and non-cognitive skills associated with the age of children. The oldest group was born in March or April of 1999, while the youngest was born in January or February of 2000. The results suggest that older children exhibited higher scores for the two cognitive tests, and lower scores for the peer problems scale.
The results in Column 3 included the mental health indicators. They show that hyperactivity scores were higher for children whose parents’ K6 scores were missing. Among households with K6 scores, hyperactivity scores were higher for children whose parents had higher K6 scores. The results also demonstrate that the estimated relationship between the outcome and the set of education variables is qualitatively similar to that found in Column 2. This suggests that mental health is not correlated with parental education, and that it might affect children’s hyperactivity score through an independent pathway. This finding was generally observed for other outcomes as well.18 In the following sections, I discuss the results based on this specification found in Column 3.
Table 5 presents the coefficients of parental education and mental health for all cognitive and behavioural outcomes. The first major finding was that parental educational attainment was significantly correlated with all of the outcomes, and the correlation was particularly strong for some behavioural outcomes. For example, the difference in the hyperactivity score between those children whose parents had only completed Year 12 and those children whose parents held a Bachelor’s degree was 0.802, or 23 percent of the average score (Column 3).19 The equivalent figure was 11 and 10 percent for conduct problem scores and peer problem scores, respectively. These differences were all statistically significant at the 10 percent level. On the other hand,
18 Results for other child outcomes show that indigenous and male children tend to exhibit lower levels of cognitive
and non-cognitive skills. Children whose principal parent was not married (in a de facto relationship, separated, divorced, or widowed) were also found to show lower cognitive and non-cognitive skill levels. Children who did not speak English at home, whose principal parent did not speak English at home or was born outside Australia, and whose grandfather (the father of the principal parent) was born outside Australia had lower PPVT scores.
19 This comparison is analogous to the change in the outcome variable associated with one standard deviation of a
continuous explanatory variable. Under the standard distribution, one standard deviation from the mean covers 34 percent of the distribution. In the case of education dummy variables, parents who had not completed Year 12, with or without qualifications, and parents whose highest attainment was Year 12, made up 53 percent of the parents. Thus, parents who had completed Year 12 were those with the median level of skill/educational attainment. Parents who had completed Year 12 and had qualifications, as well as parents who had completed Bachelor’s degrees, constituted another 35 percent. Thus, comparing parents with college degrees and parents with the median level of education was the analogue for a discrete variable to the one standard deviation increase in the case of a continuous variable.
relatively small (2-3 percent), but nonetheless significant differences were observed for the WAIT and PPVT scores (Columns 1 and 2).20
The second finding was that the mental health of the principal parent was strongly associated with children’s outcomes, particularly behavioural outcomes. A one standard deviation increase in the K6 scale was associated with a 3 to 24 percent rise in the scores relative to the means, with the size of the deterioration particularly large for emotional symptoms (24 percent), peer problems (17 percent) and conduct problems (17 percent). On the other hand, equivalent changes in cognitive test scores were less than or equal to 1 percent of their means.
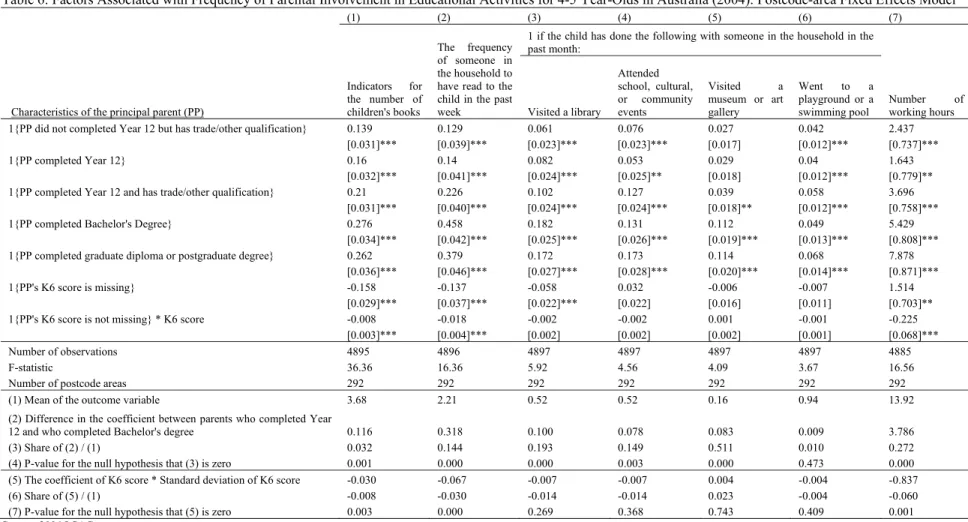
5.3 Educational activities and parenting practices as possible pathways
The results thus far suggest that parental education and mental health are significantly and substantially correlated with children’s social-emotional outcomes. Evidence that will be presented in this section indicates that these correlations arise through two differential pathways: engagement in learning activities by educated parents, and Authoritative (warmer and more disciplined) and less irritable parenting practices by parents with better mental health.21
First, the results of estimating the equation (5) (Table 6) show that educated parents engaged in educational activities more frequently with their children. For instance, children of educated parents had a larger number of children’s books, and their parents read to them more often (Columns 1 and 2).
The difference in the coefficient for the frequency of being read a book between the children of parents who had only completed Year 12 and those of parents who had attained a Bachelor’s
20 It is unclear which the higher attainment is: the completion of Year 12, or the attainment of a qualification. Thus,
the rest of the analysis focuses on the gradient of educational attainment for children whose parents at least completed Year 12.
21 Ermisch (2008) found similar results from the UK, suggesting that parental education and parenting style are
degree was 0.32. This indicates that, compared to the average of 2.2 (which falls between a response option of 2 (3 to 5 days) and 3 (6 to 7 days)), parents with a Bachelor’s degree were slightly more likely to read a book to their child every day. Furthermore, the children of parents who held a qualification or a Bachelor’s degree were more likely to have been taken to a library, a school/cultural/community event, playground/swimming pool, or museum/art gallery during the past month (Columns 3-6). They were, however, no more likely to have been taken to a movie.22 The results in Column 7 further indicate that more educated parents were engaged in longer hours of work.23 This suggests that parents with longer working hours do not necessarily limit learning opportunities provided to their children. This is consistent with recent findings (Craig, 2007 and Folbre and Yoon, 2007).
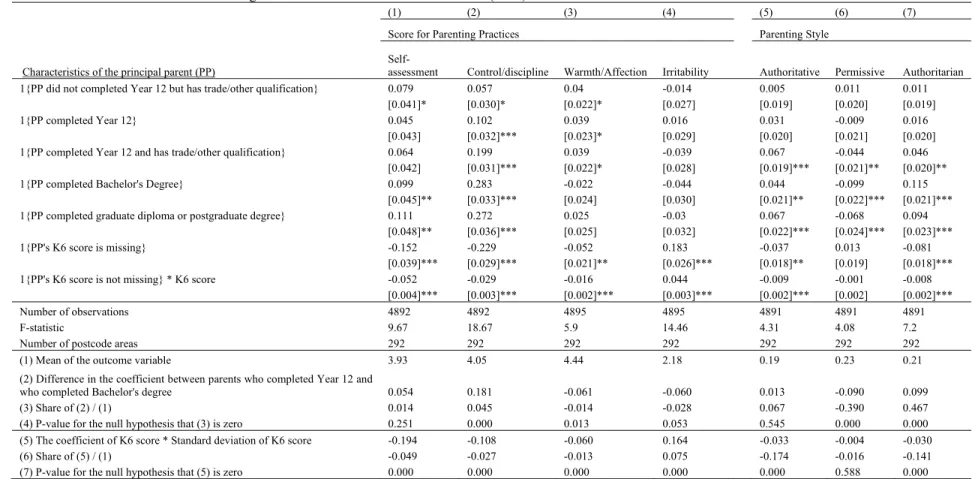
There was not, however, a straightforward association between educational attainment and parenting practices. For instance, Table 7 reveals that parents’ irritability scores were not associated with education levels, nor did scores on warmth or self-assessment of parental capability show systematic correlations with education levels. Only the score pertaining to control over children depicted a positive correlation with parental education. While a higher level of control might influence some of the outcomes of children of educated parents,24 the mixed evidence for the other parenting indicators suggests that better parenting is unlikely to be the dominant pathway which gave rise to the positive association between parental education and children’s outcomes.
Second, mentally healthier parents clearly had better parenting practices. A one standard deviation decrease in the K6 score was associated with a 3 percent increase in the score for discipline/control, a 4 percent decrease in the score for irritability, and a 17 (14) percent increase
22 Evidence has also been found that educated parents are more likely to tell a story to their child (rather than read it
from a book), engage in art/music activities with their child and play with toys with their child (Appendix Table 2).
23 The results based on Tobit specification indicate qualitatively similar results.
24 This implies that educated parents are more likely to have Authoritative or Authoritarian parenting styles, which
in the probability of being categorised in Authoritative (Authoritarian) parenting style. These parenting factors were shown to be associated with improved outcomes of children in the data used in this paper (Appendix Table 2). Mentally healthier parents also regarded themselves as better parents. A lower K6 score was also correlated with some, but not all, of the educational activities undertaken with the child, such as frequent reading (Table 6) and engaging in art activities (Appendix Table 2).
7 Conclusions
This study has examined the relationship between children’s cognitive and behavioural outcomes and parental characteristics. The results demonstrate that higher educational attainment and better mental health of parents are important correlates of children’s outcomes, particularly behavioural (socio-emotional) outcomes. This study has also identified possible pathways which produce these correlations. Firstly, educated parents were more often involved in activities such as reading books to their children and taking them to a library/museum/school event, even though they were found to work longer hours. Secondly, parents with better mental health reported being engaged in better parenting practices, characterised by more control/discipline and less irritability.
It is worth discussing the qualifications of these findings. It is beyond the scope of this study to establish a causal relationship. Unobserved family attributes might have inflated or deflated the estimated correlations. A possible reverse causality could have overestimated the associations between children’s outcomes and parental mental health. It would be fruitful for future research to investigate how much of the observed correlation reflected the causal impact of parental attributes. To the extent that the results in this paper reflect causal relationships, they suggest differential pathways through which parental education and mental health affect children’s outcomes.
References
Aguiar, M. and E. Hurst (2007) “Measuring trends in leisure: the allocation of time over five decades,” Quarterly Journal of Economics, 122(3), 969-1006.
Becker, G. (1965) “A Theory of the Allocation of Time,” Economic Journal, 75(299), 493-517.
Brown, J, M. Bittman and J. Nicholson (2007) “Time or money: the impact of parental employment on time that 4 to 5 year olds spend in language building activities,” Australian Journal of Labour Economics, 10(3), 149-165.
Baumrind, D. (1973) “The development of instrumental competence through socialization,” in Pick, A. ed. Minnesota Symposium on Child Psychology, University of Minnesota Press, 3-46.
Baumrind, D. (1991) “The influence of parenting style on adolescent competence and substance use,” Journal of Early Adolescence, 11(1), 56-94.
Bradbury, B. (2007) “Child Outcomes and Family Socio-Economic Characteristics,” Social Policy Research Centre, University of New South Wales.
Cebu Study Team (1991) “Underlying and proximate determinants of child health: The CEBU longitudinal health and nutrition study,” American Journal of Epidemiology, 133(2) 185-201.
Craig, L. (2007) “How employed mothers in Australia find time for both market work and childcare,” Journal of Family and Economic Issues, 28, 69-87.
Cunha, F. and J. Heckman (2008) “Symposium on Noncognitive Skills and Their Development: Formulating, Identifying and Estimating the Technology of Cognitive and Noncognitive Skill Formation,” Journal of Human Resources, 32(4), 738-82.
Currie, J. (2009) “Healthier, Wealthy, and Wise: Socioeconomic Status, Poor Health in Childhood and Human Capital Development,” Journal of Economic Perspectives, 47(1) 87-122.
Currie, J. and D. Thomas (1999) “Early Test Scores, Socioeconomic Status and Future Outcomes,” NBER Working Papers, 6943.
De Lemos, M. and Doig, B. (1999). Who Am I?: Developmental Assessment, Australian Council
for Educational Research, Melbourne.
Dunn, L.M. and L.M. Dunn (1997) Peabody Picture Vocabulary Test – Third Edition. Technical Specifications, Circle Pines, MN: American Guidance Services Inc.
Ermisch, J. (2008) “Origins of social immobility and inequality: parenting and early child development,” National Institute Economic Review 205, 62-71.
Folbre, N. and Yoon, J. (2007) “What is child care? Lessons from time-use surveys of major English-speaking countries,” Review of Economics of the Household, 5, 223-248.
Furukawa, T.A., Kessler, R.C., Slade, T., and Andrews, G. (2003) “The performance of the K6 and K10 screening scales for psychological distress in the Australian National Survey of Mental Health and Well-Being,” Psychological Medicine 33, 357-362.
Goodman, R (1997) “The Strengths and Difficulties Questionnaire: A Research Note,” Journal of Child Psychology and Psychiatry, 38 (5), 581-586.
Guryan, J., E. Hurst, M. Kearney (2008) “Symposia: Investment in Children: Parental Education and Parental Time with Children,” Journal of Economic Perspectives, 22(3), 23-46.
Heckman, J., J. Stixrud, and S. Urzua (2006) “The effects of cognitive and noncognitive abilities on labor market outcomes and social behavior,” Journal of Labor Economics, 24, 411-82.
Kessler, R.C., Barker, P.R., Colpe, L.J., Epstein, J.F., Gfroerer, J.C., Hiripi, E., Howes, M.J, Normand, S-L.T., Manderscheid, R.W., Walters, E.E., and Zaslavsky, A.M. (2003) “Screening for Serious Mental Illness in the General Population,” Archives of General Psychiatry, 60(2),
184-189.
Kalenkoski, C. and G. Foster (2008) “The quality of time spent with children in Australian households,” Review of Economics of the Household, 6, 243-266.
Kimmel J. and R. Connelly (2007) “Mothers’ time choices: caregiving, leisure, home production, and paid work,” Journal of Human Resources, 42(3), 643-61.
Kessler, R.C., Andrews, G., Colpe, L.J., Hiripi, E., Mroczek, D.K., Normand, S.-L.T., Walters, E.E., and Zaslavsky, A. (2002) “Short screening scales to monitor population prevalances and trends in nonspecific psychological distress,” Psychological Medicine, 32(6), 959-976.
Leigh, A. and Gong, X. (2009) “Estimating Cognitive Gaps Between Indigenous and Non-Indigenous Australians” Education Economics, 17(2), 239-261.
Maccoby, E. and Martin A. (1983) “Socialization in the context of the family: parent-child interaction,” in Hetherington, M. ed. Handbook of Child Psychology: Socialization, Personality, and Social Development, 4th ed., New York, Wiley, 1-101.
Robertson D. and J. Symons (1990) “The occupational choice of British children,” Economic Journal, 100(402), 828-41.
Rosenzweig, M. and P. Schultz (1983) “Estimating a household production function: heterogeneity, the demand for health inputs, and their effects on birth weight,” Journal of Political Economy, 91(5) 723-746.
Todd, P. and K. Wolpin (2003) “On the specification and estimation of the production function for cognitive achievement” Economic Journal, 113, F3-F33.
Wake M., J. Nicholson, P. Hardy and K. Smith (2007) “Preschooler Obesity and Parenting Styles of Mothers and Fathers: Australian National Population Study,” Pediatrics 120(6), 1520-1527.
Zubrick, SR, GJ Smith, JM Nicholson, AV Sanson, TA Jackiewicz (2007) for the LSAC Research Consortium. Parenting and Families in Australia [social policy research paper].
Canberra, Australia: Australian Government, Department of Family, Community Services and Indigenous Affairs.
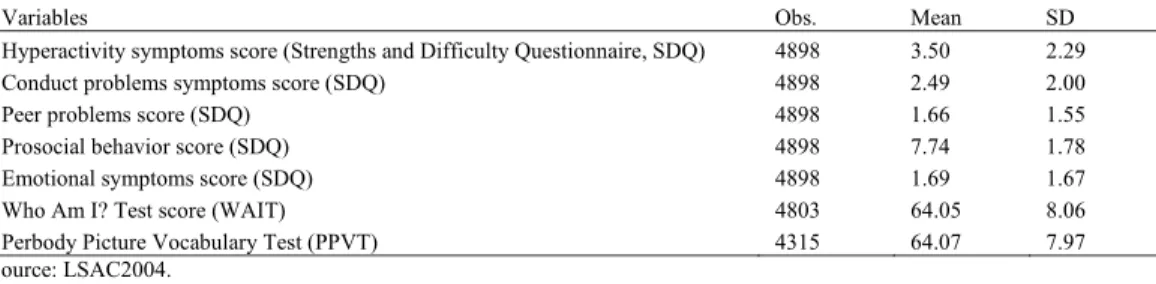
Table1: Summary Statistics for the Outcome Variables
Variables Obs. Mean SD
Hyperactivity symptoms score (Strengths and Difficulty Questionnaire, SDQ) 4898 3.50 2.29
Conduct problems symptoms score (SDQ) 4898 2.49 2.00
Peer problems score (SDQ) 4898 1.66 1.55
Prosocial behavior score (SDQ) 4898 7.74 1.78
Emotional symptoms score (SDQ) 4898 1.69 1.67
Who Am I? Test score (WAIT) 4803 64.05 8.06
Perbody Picture Vocabulary Test (PPVT) 4315 64.07 7.97 Source: LSAC2004.
Note: See Appendix 1 for the definition of the variables.
Table 2: Summary statistics for the inputs for children’s outcomes
Variables Obs. Mean SD
At least once Number of weekly working hours of the principal parent 4885 13.92 16.33
Indicator for the number of children's books in the home, including library books 4895 3.68 0.76 Indicator for the frequency in the past week of someone in the household to have done
the following:
read to the child 4896 2.21 0.87 0.96
told the child a story, not from a book, every day 4895 1.09 0.96 0.69 drew a picture or did other art or craft activities with the child 4892 1.69 0.91 0.90 played music, sang songs, danced or did other musical activities with the child 4892 1.78 0.95 0.91 played with toys or games indoors, like board or card games with the child 4895 1.57 1.01 0.83 involved the child in everyday activities at home, such as cooking or caring for pets 4894 2.01 1.01 0.90 played a game outdoors or exercised together like walking, swimming, cycling 4893 1.73 0.92 0.90
1{In the past month, the child has done the following with the principal parent or another family member:
visited a library} 4897 0.52 0.50
gone to a live performance for children, like a concert or play} 4895 0.25 0.43 attended a school, cultural or community event} 4897 0.52 0.50 attended a religious service, church, temple, synagogue or mosque} 4897 0.34 0.47
visited a museum or art gallery} 4897 0.16 0.37
gone to a playground or a swimming pool} 4897 0.94 0.24 gone to a sporting event in which the child was not a player} 4896 0.42 0.49
gone to a movie} 4897 0.38 0.49
Parenting indicator 4892 3.93 0.88
Indicator for warmth in parenting practices 4895 4.44 0.45 Indicator for irritability in parenting practices 4895 2.18 0.59 Indicator for control/discipline in parenting practices 4892 4.05 0.68
1 if parental practice is Authoritative 4891 0.19 0.39
1 if parental practice is Permissive 4891 0.23 0.42
1 if parental practice is Authoritarian 4891 0.21 0.41
Source: LSAC2004. Notes:
1. See Appendix 3 for the definition of parenting variables.
2. For parents who have irregular work hours, the number of average work hour in the past four weeks is reported. Work hours do not include travel time.
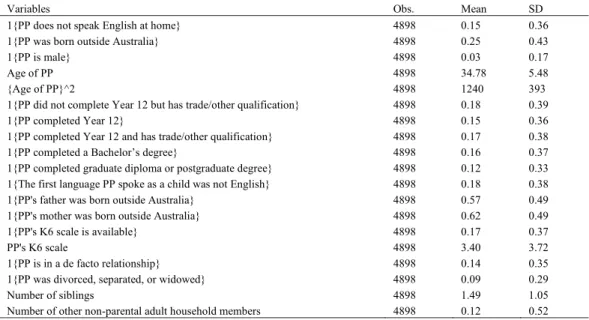
Table 3: Summary statistics for the characteristics of the principal parent (PP)
Variables Obs. Mean SD
1{PP does not speak English at home} 4898 0.15 0.36
1{PP was born outside Australia} 4898 0.25 0.43
1{PP is male} 4898 0.03 0.17
Age of PP 4898 34.78 5.48
{Age of PP}^2 4898 1240 393
1{PP did not complete Year 12 but has trade/other qualification} 4898 0.18 0.39
1{PP completed Year 12} 4898 0.15 0.36
1{PP completed Year 12 and has trade/other qualification} 4898 0.17 0.38
1{PP completed a Bachelor’s degree} 4898 0.16 0.37
1{PP completed graduate diploma or postgraduate degree} 4898 0.12 0.33 1{The first language PP spoke as a child was not English} 4898 0.18 0.38 1{PP's father was born outside Australia} 4898 0.57 0.49 1{PP's mother was born outside Australia} 4898 0.62 0.49
1{PP's K6 scale is available} 4898 0.17 0.37
PP's K6 scale 4898 3.40 3.72
1{PP is in a de facto relationship} 4898 0.14 0.35
1{PP was divorced, separated, or widowed} 4898 0.09 0.29
Number of siblings 4898 1.49 1.05
Number of other non-parental adult household members 4898 0.12 0.52 Source: LSAC2004.
Notes:
1. See Appendix 2 for the definition of the K6 scale, a measure of mental health.
2. A category of not completing Year 12 is omitted. Thus, one minus the sum of the mean values for the other levels of educational and skill attainment indicates the proportion of parents who fall in the omitted category.
Table 4: Factors Associated with Hyperactivity Score for 4-5 Year-Olds in Australia (2004)
(1) (2) (3)
OLS Postcode-area FE
Characteristics of the child
1{Child is Aboriginal or Torres Strait Islander} 0.386 0.451 0.379 [0.175]** [0.185]** [0.182]** 1{Child does not speak English at home} 0.225 0.214 0.23
[0.172] [0.179] [0.177] 1{Child was born outside of Australia} -0.137 -0.093 -0.068
[0.163] [0.168] [0.166]
1{Child is male} 0.809 0.809 0.791
[0.063]*** [0.064]*** [0.063]*** Characteristics of the principal parent (PP)
1{PP does not speak English at home} -0.162 -0.176 -0.22 [0.187] [0.195] [0.192]
1{PP was born outside of Australia} 0.213 0.206 0.203
[0.109]* [0.113]* [0.112]* 1{PP is male} 0.369 0.299 0.33 [0.191]* [0.197] [0.195]* Age of PP -0.087 -0.077 -0.052 [0.044]** [0.046]* [0.045] {Age of PP}^2 0.001 0.001 0 [0.001] [0.001] [0.001] 1{PP did not completed Year 12 but has trade/other qualification} -0.224 -0.184 -0.21
[0.101]** [0.105]* [0.103]**
1{PP completed Year 12} -0.204 -0.145 -0.136
[0.107]* [0.111] [0.109] 1{PP completed Year 12 and has trade/other qualification} -0.522 -0.449 -0.456
[0.104]*** [0.108]*** [0.106]***
1{PP completed Bachelor's Degree} -1.107 -0.949 -0.938
[0.108]*** [0.115]*** [0.113]*** 1{PP completed graduate diploma or postgraduate degree} -0.975 -0.801 -0.806
[0.117]*** [0.123]*** [0.122]***
1{The first language PP spoke as a child was not English} 0.175 0.189 0.113 [0.143] [0.148] [0.147] 1{PP's father was born outside Australia} -0.039 -0.04 -0.022
[0.098] [0.101] [0.100] 1{PP's mother was born outside Australia} 0.215 0.283 0.274
[0.108]** [0.111]** [0.110]**
1{PP's K6 score is missing} 0.5
[0.099]***
1{PP's K6 score is not missing} * K6 score 0.106
[0.010]*** Characteristics of the household
1{PP is in de facto relationship} 0.337 0.34 0.277 [0.100]*** [0.104]*** [0.103]*** 1{PP is separated or divorced} 0.231 0.296 0.182 [0.111]** [0.114]*** [0.113] Number of siblings -0.06 -0.058 -0.068 [0.031]* [0.033]* [0.032]**
Number of other residential adults 0.104 0.048 0.04
[0.061]* [0.064] [0.063]
Constant 5.517 5.131 4.282
[0.808]*** [0.833]*** [0.828]***
Number of observations 4898 4898 4898
F-statistic 19.96 14.81 18.55
Number of postcode areas 292 292
Source: LSAC2004.
Notes: 1. Standard errors in brackets, * significant at 10%; ** significant at 5%; *** significant at 1%. 2. F-statistic indicates the F-statistic based on the null hypothesis that all the coefficients are zero.
3. The equations also include five dummy variables for the child’s birth month (separated by each two months). 4. For comparison, Columns 1 and 2 do not include the two variables related to the K6 scores.
23
Table 5: Factors Associated with Cognitive and Behavioural Outcomes for 4-5 Year-Olds in Australia (2004): Postcode-area Fixed Effects Model
(1) (2) (3) (4) (5) (6) (7)
Characteristics of the principal parent (PP)
Who Am I?
Test score PPVT score Hyperactivity
Conduct
problems Peer problems Prosocial behaviours
Emotional symptoms 1{PP did not complete Year 12 but has trade/other qualification} 1.08 1.019 -0.202 -0.032 -0.162 0.235 -0.124
[0.336]*** [0.356]*** [0.102]** [0.091] [0.070]** [0.083]*** [0.076]
1{PP completed Year 12} 1.132 1.65 -0.113 -0.088 -0.243 0.147 -0.185
[0.358]*** [0.375]*** [0.108] [0.096] [0.074]*** [0.088]* [0.081]** 1{PP completed Year 12 and has trade/other qualification} 1.993 1.907 -0.443 -0.27 -0.257 0.184 -0.274
[0.347]*** [0.364]*** [0.105]*** [0.094]*** [0.072]*** [0.086]** [0.079]***
1{PP completed Bachelor's Degree} 2.339 3.371 -0.926 -0.375 -0.415 0.243 -0.275
[0.370]*** [0.387]*** [0.113]*** [0.100]*** [0.077]*** [0.091]*** [0.084]*** 1{PP completed graduate diploma or postgraduate degree} 2.424 3.167 -0.804 -0.259 -0.407 0.341 -0.256
[0.399]*** [0.420]*** [0.121]*** [0.107]** [0.083]*** [0.098]*** [0.090]***
1{PP's K6 score is missing} -0.461 -1.319 0.514 0.612 0.325 -0.319 0.527
[0.325] [0.348]*** [0.098]*** [0.087]*** [0.067]*** [0.079]*** [0.073]***
1{PP's K6 score is not missing} * K6 score -0.062 -0.18 0.108 0.115 0.076 -0.068 0.109
[0.031]** [0.033]*** [0.009]*** [0.008]*** [0.006]*** [0.008]*** [0.007]***
Number of observations 4858 4365 4957 4957 4957 4957 4957
F-statistic 47.56 30.25 21.02 17.35 14.71 9.94 15.6
Number of postcode areas 292 292 292 292 292 292 292
(1) Mean of the outcome variable 64.027 64.058 3.504 2.492 1.667 7.740 1.699
(2) Difference in the coefficient between parents who completed Year 12 and who
completed Bachelor's degree 1.207 1.721 -0.813 -0.287 -0.172 0.096 -0.090
(3) Share of (2) / (1) 0.019 0.027 -0.232 -0.115 -0.103 0.012 -0.053
(4) P-value for the null hypothesis that (2) is zero 0.002 0.000 0.000 0.006 0.031 0.312 0.301 (5) The coefficient of K6 score * Standard deviation of K6 score -0.231 -0.671 0.403 0.429 0.283 -0.254 0.407
(6) Share of (5) / (1) -0.004 -0.010 0.115 0.172 0.170 -0.033 0.239
(7) P-value for the null hypothesis that (5) is zero 0.046 0.000 0.000 0.000 0.000 0.000 0.000 Source: 2004 LSAC.
Notes: 1. Standard errors in brackets, * significant at 10%; ** significant at 5%; *** significant at 1%. 2. F-statistic indicates the F-statistic based on the null hypothesis that all the coefficients are zero. 3. The equations also include all the covariates included in Column 3 of Table 4.
24
Table 6: Factors Associated with Frequency of Parental Involvement in Educational Activities for 4-5 Year-Olds in Australia (2004): Postcode-area Fixed Effects Model (1) (2) (3) (4) (5) (6) (7)
Characteristics of the principal parent (PP)
Indicators for the number of children's books The frequency of someone in the household to have read to the child in the past week
1 if the child has done the following with someone in the household in the past month: Number of working hours Visited a library Attended school, cultural, or community events Visited a museum or art gallery Went to a playground or a swimming pool 1{PP did not completed Year 12 but has trade/other qualification} 0.139 0.129 0.061 0.076 0.027 0.042 2.437
[0.031]*** [0.039]*** [0.023]*** [0.023]*** [0.017] [0.012]*** [0.737]***
1{PP completed Year 12} 0.16 0.14 0.082 0.053 0.029 0.04 1.643
[0.032]*** [0.041]*** [0.024]*** [0.025]** [0.018] [0.012]*** [0.779]** 1{PP completed Year 12 and has trade/other qualification} 0.21 0.226 0.102 0.127 0.039 0.058 3.696
[0.031]*** [0.040]*** [0.024]*** [0.024]*** [0.018]** [0.012]*** [0.758]***
1{PP completed Bachelor's Degree} 0.276 0.458 0.182 0.131 0.112 0.049 5.429
[0.034]*** [0.042]*** [0.025]*** [0.026]*** [0.019]*** [0.013]*** [0.808]*** 1{PP completed graduate diploma or postgraduate degree} 0.262 0.379 0.172 0.173 0.114 0.068 7.878
[0.036]*** [0.046]*** [0.027]*** [0.028]*** [0.020]*** [0.014]*** [0.871]***
1{PP's K6 score is missing} -0.158 -0.137 -0.058 0.032 -0.006 -0.007 1.514
[0.029]*** [0.037]*** [0.022]*** [0.022] [0.016] [0.011] [0.703]**
1{PP's K6 score is not missing} * K6 score -0.008 -0.018 -0.002 -0.002 0.001 -0.001 -0.225
[0.003]*** [0.004]*** [0.002] [0.002] [0.002] [0.001] [0.068]***
Number of observations 4895 4896 4897 4897 4897 4897 4885
F-statistic 36.36 16.36 5.92 4.56 4.09 3.67 16.56
Number of postcode areas 292 292 292 292 292 292 292
(1) Mean of the outcome variable 3.68 2.21 0.52 0.52 0.16 0.94 13.92
(2) Difference in the coefficient between parents who completed Year
12 and who completed Bachelor's degree 0.116 0.318 0.100 0.078 0.083 0.009 3.786
(3) Share of (2) / (1) 0.032 0.144 0.193 0.149 0.511 0.010 0.272
(4) P-value for the null hypothesis that (3) is zero 0.001 0.000 0.000 0.003 0.000 0.473 0.000 (5) The coefficient of K6 score * Standard deviation of K6 score -0.030 -0.067 -0.007 -0.007 0.004 -0.004 -0.837
(6) Share of (5) / (1) -0.008 -0.030 -0.014 -0.014 0.023 -0.004 -0.060
(7) P-value for the null hypothesis that (5) is zero 0.003 0.000 0.269 0.368 0.743 0.409 0.001 Source: 2004 LSAC.
Notes: 1. Standard errors in brackets, * significant at 10%; ** significant at 5%; *** significant at 1%. 2. F-statistic indicates the F-statistic based on the null hypothesis that all the coefficients are zero. 3. The equations also include all the covariates included in Column 3 of Table 4.
25
Table 7: Factors Associated with Parenting Practices for 4-5 Year-Olds in Australia (2004): Postcode-area Fixed Effects Model
(1) (2) (3) (4) (5) (6) (7)
Score for Parenting Practices Parenting Style
Characteristics of the principal parent (PP) Self-assessment Control/discipline Warmth/Affection Irritability Authoritative Permissive Authoritarian 1{PP did not completed Year 12 but has trade/other qualification} 0.079 0.057 0.04 -0.014 0.005 0.011 0.011
[0.041]* [0.030]* [0.022]* [0.027] [0.019] [0.020] [0.019]
1{PP completed Year 12} 0.045 0.102 0.039 0.016 0.031 -0.009 0.016
[0.043] [0.032]*** [0.023]* [0.029] [0.020] [0.021] [0.020]
1{PP completed Year 12 and has trade/other qualification} 0.064 0.199 0.039 -0.039 0.067 -0.044 0.046
[0.042] [0.031]*** [0.022]* [0.028] [0.019]*** [0.021]** [0.020]**
1{PP completed Bachelor's Degree} 0.099 0.283 -0.022 -0.044 0.044 -0.099 0.115
[0.045]** [0.033]*** [0.024] [0.030] [0.021]** [0.022]*** [0.021]*** 1{PP completed graduate diploma or postgraduate degree} 0.111 0.272 0.025 -0.03 0.067 -0.068 0.094
[0.048]** [0.036]*** [0.025] [0.032] [0.022]*** [0.024]*** [0.023]***
1{PP's K6 score is missing} -0.152 -0.229 -0.052 0.183 -0.037 0.013 -0.081
[0.039]*** [0.029]*** [0.021]** [0.026]*** [0.018]** [0.019] [0.018]***
1{PP's K6 score is not missing} * K6 score -0.052 -0.029 -0.016 0.044 -0.009 -0.001 -0.008
[0.004]*** [0.003]*** [0.002]*** [0.003]*** [0.002]*** [0.002] [0.002]***
Number of observations 4892 4892 4895 4895 4891 4891 4891
F-statistic 9.67 18.67 5.9 14.46 4.31 4.08 7.2
Number of postcode areas 292 292 292 292 292 292 292
(1) Mean of the outcome variable 3.93 4.05 4.44 2.18 0.19 0.23 0.21
(2) Difference in the coefficient between parents who completed Year 12 and
who completed Bachelor's degree 0.054 0.181 -0.061 -0.060 0.013 -0.090 0.099
(3) Share of (2) / (1) 0.014 0.045 -0.014 -0.028 0.067 -0.390 0.467
(4) P-value for the null hypothesis that (3) is zero 0.251 0.000 0.013 0.053 0.545 0.000 0.000 (5) The coefficient of K6 score * Standard deviation of K6 score -0.194 -0.108 -0.060 0.164 -0.033 -0.004 -0.030
(6) Share of (5) / (1) -0.049 -0.027 -0.013 0.075 -0.174 -0.016 -0.141
(7) P-value for the null hypothesis that (5) is zero 0.000 0.000 0.000 0.000 0.000 0.588 0.000 Source: 2004 LSAC.
Notes: 1. Standard errors in brackets, * significant at 10%; ** significant at 5%; *** significant at 1%. 2. F-statistic indicates the F-statistic based on the null hypothesis that all the coefficients are zero. 3. The equations also include all the covariates included in Column 3 of Table 4.
Appendix 1: Behavioural (social-emotional) outcomes, measured by the Strengths and Difficulty Questionnaire
The Strengths and Difficulty Questionnaire (SDQ) included 25 descriptions which were associated with 4 difficulties (emotional symptoms, conduct problems, hyperactivity and peer problems) and pro-social behaviour. The parent who was the main carer, or the principal parent, answered whether the description was ‘certainly true’, ‘somewhat true’ or ‘not true’. Following Goodman (1997), the values were recoded by assigning the numbers 0, 1 or 2 (instead of 1, 2 or 3) to depict ‘not true’, ‘somewhat true’ or ‘certainly true.’ When descriptions were positive, 2, 1 and 0 were assigned to these responses, respectively. Higher values therefore indicated more negative symptoms, except for the scores indicating pro-social behaviour, for which higher values indicated more positive behaviour. If all 5 questions per symptom were answered, the sum of the values associated with the answers was computed. The score was not computed for children who answered less than 3 questions. For children who answered 3 or 4 questions, the sum of the values associated with the responses was computed, and then inflated by 5/3 or 5/4, respectively. According to Goodlman’s (1997) rough cut-off values, a child is likely to develop a mental health disorder if the scores for emotional symptoms, hyperactivity and peer problems fall within 5-10, 7-10, 4-10 and 0-4. Based on these cut-offs, I defined a dummy variable for a child to take the place of one of the ‘abnormal’ values. The questions asked in the SDQ were based on the following scales:
Hyperactivity Scale
- restless, overactive, cannot stay still for long - constantly fidgeting or squirming
- easily distracted, concentration wanders - thinks things out before acting
- sees tasks through to the end, good attention span
Conduct Problems Scale
- often has temper tantrums or hot tempers - generally obedient, usually does what adults
request
- often fights with other children or bullies them - often argumentative with adults
- can be spiteful to others Peer Problems Scale
- rather solitary, tends to play alone - has at least one good friend - generally liked by other children - picked on or bullied by other children - gets on better with adults than with other
children
Pro-social Scale
- considerate of other people’s feelings
- shares readily with other children (treats, toys, pencils etc.)
- helpful if someone is hurt, upset or feeling ill - kind to younger children
- often volunteers to help others (parents, teachers, other children)
Emotional Symptoms Scale
- often complains of headaches, stomach aches, or sickness
- many worries, often seems worried - often unhappy, down-hearted or tearful - nervous or clingy in new situations, easily
loses confidence
- many fears;, easily scared
Appendix 2: Parental mental health, measured by the K6 Scale
The scale was based on 6 questions relating to the psychological conditions experienced during the past 4 weeks: how often the parent felt nervous, hopeless, restless/fidgety; felt that everything was an effort; felt so sad that nothing could cheer him/her up; felt worthless. Parents answered either ‘all of the time’ ‘most of the time’ ‘some of the time’ ‘a little of the time’ or ‘none of the time’ and were assigned the score of 4, 3, 2, 1 or 0, respectively, for each question. Parents were defined to have a serious mental illness if the total of the six scores was equal to or greater than 13 [(Kessler et al., 2003) see Furukawa et al. (2003) and Kessler et al. (2002) for details on the performance of the K6 scale and other screening scales].
Appendix 3: Parenting practice indicators
Overall self-assessment as a parent and indicators of parenting style (warmth, irritability and control/discipline) were used. The overall indicator was based on the question, ‘Overall, as a parent, do you feel that you are: not very good at being a parent (assigned the value of 1), a person who has some trouble being a parent (2), an average parent (3), a better-than-average parent (4), a very good parent (5)?’
The parenting style indicators were created as the average value or questions relating to parents’ affectionate interactions with their children (warmth), their tendency to be irritated and angry with their children (irritability) and the degree to which they disciplined and controlled their children (control).25
Parents were asked to answer how often they, or their child, did the following, by selecting never/almost never (assigned the value of 1), rarely (2), sometimes (3), often (4) and always/almost always (5).26
Warmth
The indicator for warm parenting was based on the following 6 questions. The average was computed for parents who answered more than 4 questions:
[1] How often do you express affection by hugging, kissing, and holding this child? [2] How often do you hug or hold this child for no particular reason?
[3] How often do you tell this child how happy he/she makes you? [4] How often do you have warm, close times together with this child? [5] How often do you enjoy doing things with this child?
[6] How often do you feel close to this child both when he/she is happy and when he/she is upset?
Irritability
The indicator for irritability was based on the following 4 questions. The average was computed for parents who answered more than 2 questions, and answers to questions [1] were assigned reversed values:
[1] Of all the times that you talk to this child about his/her behaviour, how often is this praise? [2] Of all the times that you talk to this child about his/her behaviour, how often is this disapproval?
[3] How often are you angry when you punish this child?
[4] How often do you feel you are having problems managing this child in general?
Control/discipline
The indicator for control/discipline was based on the following 5 questions. The average was computed for parents who answered more than 3 questions, and answers to questions [3], [4] and [5] were assigned reversed values:
[1] When you give this child an instruction or make a request to do something, how often do you make sure that he/she does it?
[2] If you tell this child he/she will get punished if he/she doesn’t stop doing something, but he/she keeps doing it, how often will you punish him/her?
[3] How often does this child get away with things that you feel should have been punished? [4] How often is this child able to get out of punishment when he/she really sets his/her mind to it?
[5] When you discipline this child, how often does he/she ignore the punishment?
Following Wake et al. (2007), parents were categorised into four parenting style groups based on the indicators for control/discipline and warmth. In order to maintain a similar sample size in each category, I used the median value of the indicators to separate parents into those with a low and high level of warmth and those with a low and high level of control/discipline. Parenting with a high level of warmth and control were called Authoritative (19 percent, Table 2), a low level of warmth and a high level of control were called Authoritarian (21 percent), a high level of warmth and a low level of control were called Permissive (23 percent), and a low level of warmth and control were called Disengaged (omitted category) (Baumrind, 1973).
25 Wake et al. (2007) used the same indicators to construct categories of parenting style. Zubrick et al.
(2007) explored how these indicators were related to a wide range of family characteristics.
26 The items related to warmth were derived from the Child Rearing Questionnaire, which is not
formally published but has been widely used. The items related to irritability and control/discipline were derived from Canada’s National Longitudinal Survey of Children and Youth.