Rationalising the Interaction ofTax and Social Security: PartI: Specific Problem Areas.
40
0
0
Full text
(2) ii CONTENTS Page Abstract 1. iii. INTRODUCTION. 1. 1.1. Some Basic Parameters. 2. 1.2. Means test tapers and effective marginal tax rates (EMTRs). 3. 2. IMPACT OF TH E GO VERNM ENT’S NE W TAX SYSTEM (NTS). 4. 2.1. How extensive is the high EMTR problem?. 9. 2.2. Free area for family payment. 10. 2.3. Two-step or one-step taper?. 12. 2.4. Youth Allowance and family payment overlaps. 13. 2.4.1. Option for integrating Youth Allowance and family payment income tests. 16. 2.4.2. Conclusion: Youth Allowance reform. 16. 2.5. Stacking between FTP(A), FTP(B) and Parenting Payment (Partnered). 18. 2.6. Childcare assistance. 21. 2.7. Keating/Lambert proposals. 22. 2.8. Reduce allowance tapers?. 23. 2.9. What should be done with Rent Assistance. 27. 2.10. Conclusion: the NTS and associated reforms. 29. 3. Appendix A: The NTS changes to assistance for families. 31. 4. Appendix B: Youth Allowance unstacking proposal. 35. 5. BIBLIOGRAPHY. 37.
(3) iii. ABSTRACT The Government’s Tax Package (hereafter referred to as "NTS": a New Tax System for Australia) addresses a number of issues for families raised in Ingles’ 1997 CEPR Discussion Paper “Low Income Traps for Working Families”, but leaves others unresolved and falls short of full-scale structural reform. For example, it reduces family payment tapers, but the new tapers continue to overlap with those under the Youth Allowance scheme. It reduces the many different family payments to two (three, counting childcare), but allows these payments to abate simultaneously in some situations, which will particularly impact on the work decisions of a spouse. This paper proposes measures that address these specific problem areas. However another approach is a full-scale structural reform. The measures herein are all forms of harmonisation of the tax and social security systems; but ultimately more radical options (integration or full separation) might yield a system that is more rational and can produce a designed structure of effective tax rates. These options – along with the option of a Negative Income Tax - are canvassed in a separate paper – Part II (Discussion Paper 424)..
(4) 1. 1. INTRODUCTION. This paper considers options for addressing problems in the way the tax and social security systems interact. These include •. complexity (in both systems), with associated lack of clarity, loss of client understanding, possibilities of poor take-up, and lack of equity (see eg Harding 1997, Dawkins et al 1998);. •. high effective marginal tax rates (EMTRs) over some income ranges due to tax and 1 means test interactions, with associated "low income traps" (Ingles 1997, Beer 1998);. •. "notches", where there is a 'sudden death' loss of benefit at some point;. •. means test "stacking" – ie, where two or more means tested benefits are withdrawn over the same range of income;. •. "churning", meaning that some clients both receive benefits and pay tax at the same time; and. •. lack of support for many low wage earners just outside the boundaries of the transfer system, with pressures for yet more targeted payments for low-income earners (Dawkins and Freebairn 1997). These problems are sufficiently extensive to create the likelihood of perverse effects on work and savings, particularly for those at the margin of the labour force. In addition, the fact that the two systems overlap widely, such that many clients are liable to tax and means testing on the same income, implies that administrative and compliance costs are likely to be unnecessarily high. The starting point for this paper is the social security reforms – the simplification of family payments and reduction in tapers - contained in the Government’s New Tax System (NTS – Costello 1998). These reforms substantially reduce “Low income traps for working families” as described in Ingles 1997. This paper argues that while these reforms are very positive they could have gone further. Particular problem areas remaining include: • “stacking” of means tests for the new Family Tax Benefit (FTB) and Youth Allowances, which creates high effective tax rates (ETRs); •. “stacking” of means tests for FTB parts (A) and (B), causing disincentives for working wives in particular;. •. high ETRs for couples on the allowance margins (ie on single incomes just above the minimum wage). These problems are detailed below, and some remedies suggested. However it must be recognised at the outset that dealing with ETR problems is like dealing with a rubber ball that bulges in places: pushing in the bulge at one spot inevitably causes it to bulge somewhere else. High ETRs can be levelled down only by raising tax rates for others, or taxes in general. Ultimately the question becomes one of the optimal structure of tax rates on both the beneficiary and the non-beneficiary populations (discussed in Ingles 1998a). That article concludes that the case for a linear structure of marginal tax rates is not unambiguous, and 1. A term which I will use in preference to "poverty traps", since not all areas of high EMTRs are confined to those in poverty..
(5) 2 that there may be merit in the current approach of high effective taxes on low incomes – at least until better information is available on the effects of changing tax/taper rates. The NTS provides for a sweeping reform of the family payment system (details in Appendix A). One part of this is a substantial increase in family payment thresholds, to avoid "sudden death" losses for some people coming off benefit. Further, there is a cut in the taper 2 on family payment from the present 50 per cent to 30 per cent. I will show that this keeps ETRs below 75-85 per cent over the relevant taper zones, a substantial improvement on existing ETRs. Reform of family assistance raises a number of issues. The means test for the new “Family Tax Benefit” Part A — FTB(A) — overlaps with that for the old Austudy cum new Youth Allowance. These interactions are potentially quite serious. There is therefore a case for action in relation to Youth Allowance thresholds and tapers in multiple child families. The specific proposal contained here could be implemented for a comparatively modest cost of around $200-300m pa. Further, stacking between the means tests for FTB (A), FTB (B), and Parenting Payment (Partnered) has the potential to be a problem in terms of the work incentives facing spouses with young children. This can be addressed for little or no net cost provided we are willing to accept some redistribution within the family payment system. The specific option proposed is that FTB(B) be added to the base rate for FTB(A), and abolished as a separate payment. This means that there would no longer be any circumstances where the two payments could abate simultaneously. The Keating and Lambert (1998a and b) proposal for aggregating all family payments and tapering them sequentially would be one means of rationalising means test interactions. This apepr argues however that it could be substantially implemented by the strategy outlined here of unstacking FTB, Youth Allowance and possibly Rent Allowance by provision of appropriate disregards in the relevant means tests. Nonetheless it provides a useful concept for guiding further reform. Outside of the families area, another set of reform options involves reductions in tapers on basic income support payments, notably the allowance taper which remains at 50 per cent cum 70 per cent under the NTS (the pension taper reduces to 40 per cent). However there are problems with reducing the allowance taper; it is expensive, and it extends assistance further up the income scale to people whom many might not consider to be "in need". It can thus exacerbate inequities between those in, and those outside of, the categorically eligible population. Finally, it can create problems for the family payment system, given that family payments cannot sensibly commence to taper until after basic income support is fully abated. To conclude, while a single taper of 60 per cent might be a useful short-term reform goal, priority needs to be given to reducing taxes on all low-income families, irrespective of whether they are working or in the allowance system. 1.1 Some Basic Parameters Social security terminology is not always clear. In this paper pensions are defined as all those benefits having a pension-like means test — ie a $53/$94 pw free area and 40 per cent taper (including the aged, Disability Support pensioners and sole parents who are now receiving "Parenting Payment - Unpartnered" – PPU). Allowances are those benefits having an 2. Family payment is a generic term covering the old minimum and base rate family allowance, and the new “family tax benefit” under the NTS..
(6) 3 allowance income test: ie a smaller $31 pw free area and 50/70 per cent taper (see below). Benefits is a generic term covering both pensions and allowances. The pension withdrawal rate on income in excess of the free areas has reduced from 50 to 40 per cent under the NTS. By contrast the allowance system parameters are almost unchanged, apart from small increases in thresholds. The free area for the main allowancetype benefits (Newstart Allowance (NSA), Parenting Payment (Partnered) (PPP) etc) is $31 pw, for each adult. The initial taper is 50 per cent but this rises to 70 per cent beyond $72 pw, except in the case of a Parenting Payment (Partnered) Allowee for whom the second step now occurs at $121.50 pw. For pension the income unit is the couple; for Newstart Allowance/PPP couples it is an amalgam of individual and combined income unit. The personal income test applies to each of a married couple. However, once the high-income earner ceases to receive Newstart Allowance/PPP any additional income received by them tapers the partner’s payment at 70 per cent. By contrast the tax unit is predominantly the individual, although this is modified by the dependent spouse rebate (DSR) and the Medicare levy. The interaction of the individual tax unit and the couple unit mainly used in the social security system is the cause of some of the problems in social security and tax interactions, an issue addressed explicitly in Discussion Paper 424 (Part 2 of this set). Most basic pensions and allowances are taxable, Disability Support Pension (DSP) being a notable exception. However a system of rebates operates to protect full-rate beneficiaries from being subject to tax. Family payments and Rent Allowance are not subject to taxation. The reason for this is that to assess these as taxable income would lower the effective tax threshold for families, and therefore undermine the adequacy of these payments unless they were grossed up considerably – thereby increasing the apparent level of welfare outlays without having any effect on the actual adequacy of the payments themselves. If a benefit is not taxable the taper rate and tax rate can be added to give the EMTR applying. If it is taxable, the interactive effect means that the EMTR is less than the sum of those two rates, since tax applies to the increment to private income less the loss of benefit. A similar procedure applies when two means tests are "stacked": ie, it is not always appropriate to simply add their taper rates in order to calculate the EMTR. 1.2 Means test tapers and effective marginal tax rates (EMTRs) The effective tax rate which applies at any level of income needs to be calculated by reference to both the tax and social security systems. In practice, quite complicated computer models are used to do this; the results are often shown graphically by plotting the effective marginal tax rate (EMTR) against private income. It is usual to also plot disposable income on the 3 same graph, since the two are closely related. Chart 1 shows an example, for an allowee couple as at July 2000. It must be stressed that these sorts of calculations necessarily embody a range of simplifying assumptions, such that the EMTRs shown are somewhat theoretical and may not reflect the actual incentives facing a family at a point in time. For example, in the case of Youth Allowance the income tests normally relate to a prior financial year, whereas the calculations assume that all income tests operate on a current annual basis – or, equivalently, 3. Mathematically, the derivative of the disposable income graph with respect to private income gives the effective marginal gain, which equals 1-EMTR..
(7) 4 that income is spread evenly over and within years, such that the exact definition of the income period makes no difference to the outcome. This is one reason for uncertainty about the behavioural impact of high EMTRs.. Chart 1: EMTRs and disposable income NSA/PPP Allowee couple - rates at July 2000 No children, paying private rent of $200.00pw, 100% of private income to head. $900. 12. 4. $700 5. $600. 10 11. 6. 80%. 8 7. 3. 60%. $500 $400. EMTR. $800 Weekly Disposable Income. 100%. 9. 14 40%. $300. 13. $200. 20%. 2. $100 $0. 0%. 1 $0. $200. $400. $600. $800. $1,000. $1,200. Weekly Private Income. Weekly Disposable Income. EMTR. High EMTRs show as dips or plateaus in the disposable income line. People find it difficult or impossible to improve their net income position by earning more over such ranges. Chart 1 shows that an allowee couple gains relatively little from earnings between $50 and $500 pw. High EMTRs affect most basic allowance payments, notwithstanding the 1994 reforms to Newstart Allowance and related payments reducing the maximum rate of taper from 100 per cent to 70 per cent and introducing a partly individual basis of assessment.. 2. IMPACT OF THE GOVERNMENT’S NEW TAX SYSTEM (NTS). EMTR graphs can conveniently be reduced to summary measures of effective average tax rates (EATRs), calculated over a given range of income. This is the basis of Table 1, which summarises effective tax rates affecting a range of client family types in $100 bands up to $1,000. This table illustrates that there are some bands of income where families either gain marginally by earning extra income, or in some cases may go backwards. This Table shows two "hotspots" where very high ETRs (over 85 per cent) continue to occur even after the implementation of the NTS. The first set relates to allowee couples with an income of between $400 and $500 a week. In this income range loss of allowance (taper = 70 per cent) co-exists with income tax of up to 30 per cent, resulting in ETRs over 90 per cent.
(8) 5 and hence very small net gains. Another problem area concerns spouses of low wage earners in the income range $100 to $200 a week. This is where the loss of family payments can become a serious work disincentive (ETRs exceed 85 per cent), especially if childcare costs were to be taken into account. Table 2 summarises effective average tax rates for a range of families, and the impact that the NTS package has had. It has four columns. Col 1 shows EATRs calculated over the range from the benefit free area to the cutout point; Col 2 shows EATRs over the family payment threshold to the cutout; Col 3 combines Cols 1 and 2; and Col 4 calculates the EATR from nil income – ie, taking account of the impact of the free areas..
(9) TABLE 1. NET INCOME GAIN TO FAMILY UNIT FROM INCREASING EARNINGS BY $100 INCREMENTS FOR VARIOUS FAMILY TYPES AT JULY 2000. Basic Allowances and Family Tax Benefits Rent Maximum Family/Income Assistance Benefit pw Status Single NSA, no without RA $175.20 children with RA $215.90 NSA/PA couple, no without RA $316.20 children with RA $354.70 NSA/PP (partnered) without RA $388.17 couple, 1 child with RA $435.77 NSA/PP (partnered) without RA $446.83 couple, 2 children with RA $494.43 Min. wage/PP without RA $576.07 (partnered) couple, with RA $623.67 without RA $310.21 SPP (single), 1 child with RA $357.81 SPP (single), 2 without RA $368.87 children with RA $416.47. Net Gains Made Over $100 per week Gross Private Income Ranges $0-100 $45.58 $45.58 $45.58 $45.58 $45.58 $45.58 $45.58 $45.58 $41.79 $41.79 $79.23 $79.23 $82.70 $82.70. $101-200 $201-300 $301-400 $401-500 $501-600 $601-700 $701-800 $801-900 $901-1001 $78.89 $66.23 $68.50 $68.50 $68.50 $68.50 $64.65 $21.58 $24.63 $43.29 $66.23 $68.50 $68.50 $68.50 $68.50 $64.65 $21.58 $19.53 $10.85 $68.50 $68.50 $68.50 $68.50 $64.65 $24.49 $21.13 $21.29 $6.75 $34.10 $68.50 $68.50 $68.50 $64.65 $24.49 $21.13 $21.29 $31.39 $12.28 $52.69 $47.61 $70.00 $70.00 $66.15 $24.49 $27.79 $31.39 $11.15 $44.82 $38.50 $38.50 $58.51 $64.65 $24.49 $27.79 $31.39 $12.28 $43.69 $38.50 $38.50 $38.50 $44.96 $24.49 $27.79 $31.39 $12.28 $43.69 $38.50 $38.50 $38.50 $44.96 $24.49 $27.79 $47.76 $48.89 $64.14 $68.50 $68.50 $68.50 $68.50 $48.50 $17.27 $47.76 $48.89 $36.23 $48.81 $68.50 $68.50 $68.50 $48.50 $17.27 $42.30 $39.10 $36.07 $36.18 $30.29 $46.11 $68.50 $68.50 $64.65 $42.30 $39.10 $36.07 $36.18 $30.29 $38.50 $38.50 $58.51 $64.65 $42.30 $38.26 $36.88 $42.00 $38.50 $38.50 $66.41 $64.65 $21.03 $42.30 $38.26 $36.88 $42.00 $38.50 $38.50 $38.50 $44.96 $21.03. Source: FACS Modelling Unit, 'A New Tax System' (ANTS) model.. NOTES: * The Federal minimum wage is $400 pw in July 2000. Calculations for the one child scenarios assume that the child is under 5 years of age and for the two children scenarios, that 1 is under 5 years and 1 is between 5 and 12 years of age. Where both partners are on income support, calculations assume private income is received by NSA partner. Where one partner is on a minimum wage, calculations assume private income is received by their spouse. The following is a guide to the colour codes: italics. Net Gains of between less than $15 per week. bold. Net Gains of between $15-30 per week.
(10) 7. Table 2: COMPARISON OF EFFECTIVE TAX RATES: PRE- AND POST- the NTS (JULY 2000) pre ANTS. postANTS. pre ANTS. FAMILY TYPE 1 sole parent, I child, RA. pension ETR 0.62 0.61. 2 sole parent, 2 children, RA. 0.64. 0.62. 0.89. 3 sole parent, 3 children, RA. 0.65. 0.61. 4 sole parent, 2 children. 0.63. 5 NSA/PPP couple, I child, RA 100:0 income split 6 NSA/PPP couple, 2 children, RA 50% split 7 NSA/PPP couple, 2 children, RA 100 split 8 single NSA, no children, RA. postANTS. AFP ETR FTB ETR 0.89 0.61. pre ANTS. postANTS. pre ANTS. postANTS. combined ETR 0.71 0.62. ETR from zero 0.64 0.57. 0.65. 0.74. 0.63. 0.66. 0.58. 0.91. 0.69. 0.78. 0.66. 0.70. 0.61. 0.62. 0.89. 0.67. 0.72. 0.63. 0.63. 0.57. 0.81. 0.76. 0.90. 0.62. 0.81. 0.69. 0.77. 0.66. 0.78. 0.76. 0.75. 0.58. 0.80. 0.67. 0.74. 0.64. 0.81. 0.76. 0.88. 0.63. 0.80. 0.68. 0.77. 0.66. 0.82. 0.80. 0.76. 0.73. 0.79. 0.78. 0.72. 0.70. 0.85. 0.83. 0.80. 0.78. 0.80. 0.79. 0.73. 0.71. 0.73. 0.63. 0.65. 0.57. 0.68. 0.61. 0.60. 0.55. 14 Age pension couple, RA, 100 split. 0.76. 0.65. 0.68. 0.59. 15 Age pension couple, no children 100 split. 0.74. 0.63. 0.65. 0.57. 9 single NSA, no children 10 NSA couple, no children, RA 100 split 11 NSA couple, no children RA, 50% split 12 single age pensioner, no children RA 13 single age pensioner, no children. 1 child - under 5; 2 children; 1 under 5 and 1 5-12; 3 children add child 13-15. NOTES ETR: effective tax rate RA - receives maximum Rent Allowance AFP: additional family payment PPP - Parenting payment (partnered) FTB: family tax benefit NSA - Newstart Allowance. Although Col 4 shows lower EATRs than do the other columns, it is interesting that the EATRs so calculated are still all over 57 per cent, and as high as 80 per cent. Table 3 shows the percentage point reduction due to the NTS for each of these family types. The NTS will have a marked impact on family payment ETRs, reducing them by between 12 and 30 percentage points. The "low income trap" for families, described in Ingles (1997), can therefore be regarded as pretty well resolved except for the specific problems which will be discussed..
(11) 8. Table 3: reduction in Effective Tax Rates (ETRs) under the NTS pension ETR 0.01. AFP ETR 0.28. combined ETR 0.09. ETR from zero 0.07. 2 sole parent, 2 children, RA. 0.02. 0.24. 0.11. 0.08. 3 sole parent, 3 children, RA. 0.04. 0.22. 0.12. 0.09. 4 sole parent, 2 children. 0.01. 0.22. 0.09. 0.06. 5 NSA/PgA couple, I child, RA 100:0 income split 6 NSA/PgA couple, 2 children, RA 50% split 7 NSA/PgA couple, 2 children, RA 100 split 8 single NSA, no children, RA. 0.05. 0.28. 0.12. 0.11. 0.02. 0.17. 0.13. 0.10. 0.05. 0.25. 0.12. 0.11. 0.02. 0.03. 9 single NSA, no children. 0.01. 0.02. 0.02. 0.02. 0.01. 0.02. 0.10. 0.08. 0.07. 0.05. 14 Age pension couple, RA, 100 split. 0.11. 0.09. 15 Age pension couple, no children 100 split. 0.11. 0.08. FAMILY TYPE 1 sole parent, I child, RA. 10 NSA/PgA couple, no children, RA 100 split 11 NSA/PgA couple, no children RA, 50% split 12 single age pensioner, no children RA 13 single age pensioner, no children. Source: calculated form Table 2 NOTES: see notes to Table 2. It is interesting to note that ETRs for sole parents do not fall by much, despite the 10 percentage point reduction in their taper. This appears to be due, in part, to the ‘cashing out’ of the sole parent rebate in an expanded Family Tax Benefit Part B. As such, the benefit no longer reduces sole parent EMTRs over the initial range of taxable income. Prima facie, it would be desirable if the range of EATRs between client types and across income cells were such that all clients had a continuous incentive to increase their declared income. Whether it is optimal to have a single marginal rate across all these cells, or a high/low/medium rate structure like that under the current system is an issue discussed in Ingles 1998a. This paper will propose reforms on the assumption that the current structure of effective tax burdens will not be too radically changed in the short term: that is, that a.
(12) 9 high/low/ medium rate structure will continue to prevail, and that allowances will be ‘taxed back’ more quickly than pensions. This assumption is not critical, however, and the major policy options proposed in Part two provide the flexibility to move the overall rate structure in any desired direction. One final point deserves some attention. The typical EMTR graph for social security 4 recipients looks like a high rise city block with peaks, troughs, protuberances and spikes . Is this a problem that needs attention? Policy analysts find this sort of thing aesthetically displeasing. Whether it constitutes an actual problem, however, is another question. Certainly clients are unlikely to be fully aware of how this affects them, and in my view the important thing is the average ETR calculated over some sufficiently wide range of income, such as shown in Tables 1 and 2. The other important thing is that the graph of disposable income should rise fairly smoothly with income; if anomalies in the EMTR schedule cause marked dips and hollows in the disposable income line then they should be regarded as a policy problem. One aim of the options presented here will be to smooth out such anomalies. 2.1 How extensive is the high EMTR problem? Work on the distribution of EMTRs by income class (eg Harding and Polette 1995, Beer 1998) suggests that "only 6 per cent of the population, just over half a million people, face EMTRs in excess of 60 per cent" (Beer 1998 p266). Beer and Harding (1999) put this figure at 7 per cent. On these figures, EMTRs may not be a burning issue. However, Beer also notes that the figures are likely to be underestimates due to certain 5 exclusions. These include childcare, HECS , and state housing rental rebates (p265). She observes: "...individuals with very high incomes are escaping high EMTRs while those with low-middle incomes ... are most likely to face high EMTRs" (p268). Further, she notes a high proportion of individuals with children in the high EMTR ranges (pp268). Beer and Harding (1999) indicate that the NTS reforms, while lowering the family payment tapers and reducing the peaks in EMTRs, spreads them across a wider range of family incomes: “...potentially about 85,000 single income families with children have been newly drawn into the shade-out range for Family Tax Benefit Part A –…and will for the first time face EMTRs above 60 per cent” (p21). This is of course an inevitable result of “levelling down” peak EMTRs by shading tapers into other income ranges. This paper also notes that the “vast majority of those who face high EMTRs also have wage and salary income” (p10). A particular problem in interpreting work on the distribution of EMTRs is that we really do not know the extent to which the existing income distribution is already influenced by the EMTR schedule. For example, among the pensioner population we find a very high incidence of individuals with incomes below the free area who, on the Harding/Polette and Beer measures, face an EMTR of zero. But would they have such low incomes if there were no pension means test?. 4 In some cases, the EMTR spikes are of infinite height, as reflected in the “sudden death” losses (notches) in the disposable income line. These spikes are not shown on the graphs.. 5 Higher Education Contribution Scheme, under which payment of tertiary charges is a percentage of income above a threshold..
(13) 10 Another problem is that EMTR studies don’t pick up the effect of losing various allowances and concessions if income exceeds relevant thresholds. Cowling (1998) notes that the loss of these “- most notably the Health Care Card, Rent Assistance and State Government concessions on energy, water, sewage, municipal rates and transport …– was much more significant in the decision-making process than any consideration of payment thresholds and taper rates” (p28). The argument for fixing up high EMTRs is not really founded in empirical studies of their current impact. Rather, it is based on the notion that: • high EMTRs are unfair to the affected clients; •. we don’t know how much damage they are doing, although it is likely they are equally as damaging in the social security system as they are in the direct tax system (where a lot of effort has gone into reducing them); and. •. it's not necessary to take the risk. The problem is fixable; technical solutions are available which don’t necessarily cost a lot and have other advantages in terms of income redistribution objectives, so why live with it?. That is not to deny that it would be extremely useful if more were known about how high EMTRs actually affect behaviour. 2.2 Free area for family payment The full rate of Additional Family Payment and Rent Allowance is paid automatically to those receiving any basic income support payment (called ‘auto’-AFP). Thus, when clients cease to be eligible for such a payment, they receive only the part-rate applicable to their new income situation. Hence, there can be "sudden death" losses for clients on reaching the cutout 6. points (This is also referred to in the literature as a “notch” problem.) The NTS increased the threshold for the new integrated family payment (Family Tax Benefit Part A) to $28,200. This almost addresses the “sudden death” problem for allowees, and indeed would have done so fully but for the 1999 Budget decision to expand the range of the initial 50 per cent taper for the Parenting Payment (Partnered) from $62-142 to $62-245 a fortnight. This has again introduced a notch problem (depending on how the couple’s income is split). This could be addressed by lifting the new FTB(A) threshold slightly. In a similar manner some pensioner couples, who also receive the full rate of family payment automatically, can suffer a "sudden death" loss if their income exceeds the pension 7. cutouts Single pensioners (sole parents) are not affected by the notch problem, since their pension cuts out below the family payment threshold. Such problems are exacerbated for pensioners after July 1, due to the lower pension taper of 40 per cent. The following table shows the extent of the notch on the assumption that the couples’ income is split 100:0 (in the case of pensioners the results are not very sensitive to the income split).. 6. For allowee couples with incomes split anywhere between 86/14 per cent to 14/86 per cent, the loss is currently $24.10 pw with one child and $18 pw with two. The loss decreases with number of children, due to the impact of the child disregard in the family payment means test. There is no loss if there are 6 or more children.. 7. For pensioner couples, this loss was $ 36.50 pw with one child; $72.60 pw with two, and $87.05 pw with a third child aged 13-15, pre-NTS. The loss for a pensioner/allowee couple was similar. Post NTS notches are shown in the Table..
(14) 11. Table 4 “sudden death loss” ($ pw) on exceeding pension cutout: July 2000 DSP/PPP couple. No RA. With RA. 1 child under 5. 41.10. 88.70. 2 children (<5, 5-12). 80.80. 128.40. 134.20. 134.20. 3 children (<5, 5-12, 13-15). Chart 2 shows how the disposable income of a DSP/PPP couple falls markedly at this notch point (numbered 8 on the graph). The result, in this 3-child example, is that the couple gains almost no income from earnings in the range $500 to $1,000 pw. One ameliorating feature is there are not many pensioners in the relevant income ranges with children. Chart 2: DSP/PPP couple at July 2000 Children under 5 = 1, children 5-12 = 1, children 13-15 = 1, Paying no rent, 100% of private income to head. $1,200. 100% 12 11. $1,000. $800. 16. 13. 8. 5 6. 80%. 15 10. 60% 4. $600. 9 7. 17 14. 40%. 3. $400. 20%. 2. $200. $0. 0%. 1 $0. $200. $400. $600. $800. $1,000. $1,200. $1,400. $1,600. Weekly Private Income. Weekly Disposable Income. EMTR. It would be expensive to push out the family payment thresholds to levels approaching the new pension cutouts which, for a couple, are well in excess of average weekly earnings. One solution here might involve the abolition of pension type payments for those under pension age, and the creation of a "single workforce age payment" means tested closer to allowance lines. Only those aged 65 or over would be entitled to the more generous pension means test. Age pensioners would not be eligible for FTB, although they could apply for a workforce age payment if this was to their advantage. Very few age pensioners have dependent children..
(15) 12. 2.3 Two-step or one-step taper? The Government's Tax Package combines •. Minimum Family Payment. •. Family Allowance Supplement, and. • Family Tax Payment (FTP) part A into a single Family Tax Benefit (FTB) Part A with a maximum rate slightly higher 8 than the current combination of payments, and lower taper of 30 per cent . The new FTB(A) continues to have the same two-part taper as the current system, albeit that sudden death losses of basic family payment around the $70,000 annual family income level no longer occur, these being replaced by another 30 per cent taper on incomes exceeding $73,000 pa. The problem with the two-part taper – which admittedly is an established part of the family payment system – is that it makes the system into a hybrid which is not consistently directed towards either poverty alleviation or horizontal equity. In terms of welfare, such a two-part taper can usually be improved upon by a single, lower taper that costs the same. The reason is that the single taper redistributes from higher income to middle income families, and is thus unequivocally redistributive, and does so with very little or no net cost in terms of incentives, since all those now subject to the first tier of the taper and most of those subject to the second tier face a lower EMTR. Only those families between the first-tier cutouts and the second tier thresholds face an increased EMTR. Ingles (1997) and Keating and Lambert (1998a) propose a similar reform. Ingles suggested that a single 25 per cent taper would be approximately cost-neutral compared with the (then) current system; Keating and Lambert suggested a 30 per cent taper (theirs is higher due to other changes involved in their proposal, as described later in this Paper). However, there would be some losers on medium to high incomes (around $35-65,000), notably those with only one or two children.9 Such families do not gain sufficiently from the lower taper to compensate them for the loss of minimum FTB(A). Following the NTS changes, a lower single taper of around 20 per cent might be cost neutral. Specifically, minimum FTB(A) of $18.50 a week would be abolished, and FTB(A) grossed up to $57.85 pw (ages 0-12) and $73.30 pw (13-15). A single taper of, say, 20 per cent would apply. The impact of the proposal on a family with three children is shown in Chart 3. It can be seen that families earning between $600 and $1200 pw gain; there are some losers on family incomes between $1200 and $1400 pw. The pattern of gains and losses varies with family size, but is basically redistributive in favour of low and middle incomes.. 8. It is a pity it does not take the opportunity to abolish the large family element of FA, which has no consistent rationale in the current system.. 9. An option would be to "grandfather" current entitlements so that there were no current losers (although there would be prospective ones)..
(16) 13. Chart 3 ANTS vs proposed 20% single FTB(A) taper, Couple with 3 children and 100:0 income split $1,200. 120%. $1,000. 100%. $800. 80%. $600. 60%. $400. 40%. $200. 20%. $0. 0% $0. $200. $400. $600. $800. $1,000. $1,200. $1,400. $1,600. Private Income. ANTS. proposal. ANTS. proposal. 2.4 Youth Allowance and family payment overlaps Quite severe ETRs can be experienced by those families with a Youth Allowance child in addition to family payment children. The Youth Allowance threshold was not raised under the NTS, leaving it, at $23,400, well below the new $28,200 threshold for FTB(A). While there are additional disregards for other children under Youth Allowance, they are not always sufficiently high to prevent overlapping tapers. In consequence, for many families the presence of a Youth Allowance child in addition to other dependent children will result in there being some income range where ETRs exceed 100 per cent – ie, where disposable income actually falls as private income rises. This problem, illustrated in Table 5, is recognised in the Report of the Reference Group Welfare Reform (2000b p30), (McClure Report), and a recommendation was made that it be fixed..
(17) Table 5. NET INCOME GAIN TO FAMILY UNIT FROM INCREASING EARNINGS BY $100. INCREMENTS FOR VARIOUS FAMILY TYPES AT JULY 2000 Youth Allowance and Family Tax Benefit Interaction Family Income Status Rent Maximum Net Gains Made Over $100 per week Gross Private Income Ranges Assistance Benefit pw $0-100 $101-200 $201-300 $301-400 $401-500 $501-600 $601-700 $701-800 $801-900 $901-1,000 NSA/PP (partnered) with without RA $418.15 $45.38 $24.22 $21.39 $37.13 $43.50 $46.32 $68.50 $64.65 ($10.08) $10.39 1 YA recipient with RA $438.27 $45.38 $24.22 $21.39 $40.69 $46.32 $68.50 $64.65 ($10.08) $10.39 $19.82 NSA/PP (partnered) with 2 without RA $528.15 $45.38 $24.22 $24.54 $31.39 $33.04 $53.53 $64.65 $9.95 $9.47 $18.38 children and 1 YA recipient with RA $576.29 $45.38 $24.22 $24.54 $31.39 $33.04 $23.53 $51.40 $9.95 $9.47 $13.50 NSA/PP (partnered) with 1 without RA $567.07 $45.38 $24.22 $24.54 $31.39 $29.91 $22.76 $52.82 ($2.60) $9.95 $18.50 child and 2 YA recipients with RA $615.21 $45.38 $24.22 $24.54 $31.39 $29.91 $52.82 ($15.53) ($11.50) $9.95 $17.55 Source: FACS Modelling Unit, 'A New Tax System' (ANTS) model.. NOTES: It is assumed that 100 per cent of private income accrues to the head (ie. main earner). Calculations for the single YA recipient only scenario assumes NSA/Parenting Payment (partnered) parents with the YA child aged 16-17 years of age. Calculations for the one YA recipient scenarios assumes NSA/Parenting Payment (partnered) parents with the YA child aged 16-17 years and two FTB children - one 5-12 years and one 13-15 years of age. Calculations for the two YA recipients scenarios assumes NSA/Parenting Payment (partnered) parents with one YA child aged 16-17 years, the other aged 18-25 years and one FTB child 13-15 years of age. The following is a guide to the colour codes:. (bold itals) bold. Net Losses Net Gains of between $0 and $20 per week Net Gains of between $20 and $30 per week.
(18) The extension of the parental income test to the young unemployed has greatly increased the numbers subject to stacking. Keating and Lambert estimated that up to 40,000 families will be affected by stacking between FTB and Youth Allowance (1998b p287). However, it should be noted that, notwithstanding such problems, these families are still better off under the NTS. Chart 4 shows EMTRs for a couple with two Youth Allowance and two other children. The very wide range of private incomes where disposable income gains are extremely small ($50-800 pw) is quite apparent.. Chart 4: NSA/PPP couple with YA children at July 2000 Ch.< 5 = 0, Ch. 5-12 = 1, Ch. 13-15 = 1 Pay no rent, 100% of priv. Inc. to head, Student YA's = 2, Unemployed YA's = 0. 160% 12. $1,200. 140%. $1,000. 120% 7. 100%. $800 4. 6 10 5. $600. 14. 80% 17 16. 3 15. 60%. 2. $400. 18** 19 8. 20. 40% 9. $200. 20%. $0. 0%. 1 $0. $200. $400. $600. $800. $1,000. $1,200. $1,400. $1,600. Weekly Private Income. Weekly Disposable Income. EMTR. There are other problems with Youth Allowance. One is that a family coming off allowance (and receiving auto-max Youth Allowance) can suffer a “sudden death” loss of Youth Allowance. A further concern is that certain additional benefits are lost when a dependent child moves onto Youth Allowance – notably Guardian’s Allowance and Rent Allowance. Thus, the family may be better off on FTB(A) than Youth Allowance, notwithstanding the higher maximum rates under the latter. The second problem has been partially addressed by extending the age limit for FTB(A). However, giving families a choice as to which benefit to receive is not really a long-term solution to such problems. First, a rational choice requires a high degree of knowledge as to the relevant provisions. Second, the system fails to discriminate between families on the basis of relative need. It is well established in equivalence scale research that costs of. EMTR. Weekly Disposable Income. 11 13.
(19) 16 children rise with age, whereas the system fails to consistently direct extra assistance to some families with older dependent children. A fuller resolution would need to involve incorporating Youth Allowance into an integrated family payment system for all children up to, say age twenty-one. 2.4.1. O pt ion for integr ating Youth Allowanc e and family paym ent income tests. This ‘unstacking’ option, described in detail in Appendix B, addresses three issues: 1.. stacking between the allowance means test and the Youth Allowance taper over the income range $23,400 and $28,200 pa (this can give rise to a “sudden death” loss of up to $1200 pa in “auto” Youth Allowance);. 2.. stacking between the taper on the new FTB(A) and Youth Allowance (the 30 per cent and 25 per cent tapers are additive once the Youth Allowance disregard of $1200 for the first sibling under 16 is used up, causing EMTRs of over 85 per cent). This could cause a significant work disincentive for families in the income range $30,000- $40,000 (the exact range depends on number and age of Youth Allowance and non-Youth Allowance children); and. 3.. the Youth Allowance income test stacks on itself if there is more than one Youth Allowance child, since existing disregards of $3,400 per Youth Allowance sibling are insufficient to prevent this occurring. Such stacking can lead to EMTRs of over 80 per cent, or higher if there are also non-Youth Allowance dependent children.. Unstacking the whole system will be costly. A possible cost offset would be to raise the Youth Allowance taper from 25 to 30 per cent; this would appear to be a logical move in any case, assuming the family payment taper remains at 30 per cent. 2.4.2. Conc lusion: Youth Allowanc e r efor m. The effect of the three options in Appendix B, taken together, would be to create a situation where (apart from Rent Allowance), Youth Allowance and FTB(A) were very close to an integrated system. Except for renters, no family would lose more than 30 cents in the dollar of welfare benefits as private income rises. Combined with the standard income tax rate of 30 per cent, EMTRs would be close to 60 per cent for most affected families (except Rent Allowance recipients also receiving Youth Allowance). Although this is still high, it is probably sustainable. This is shown in Table 6 and Chart 5..
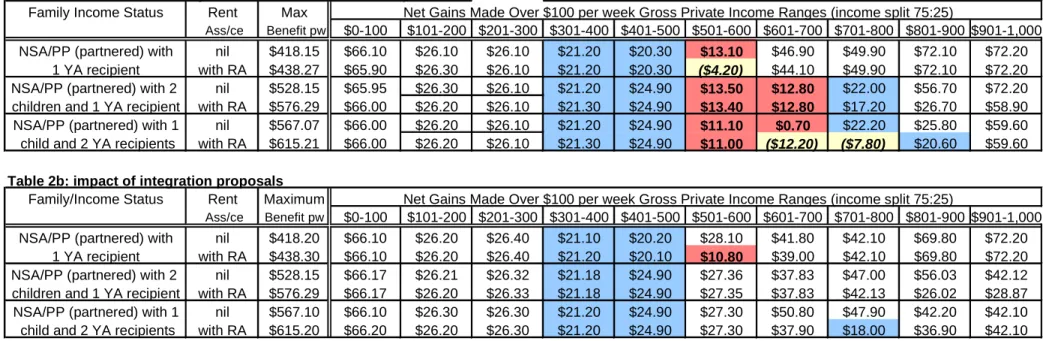
(20) Table 6: Impact of proposed YA integration scheme relative to July 2000 (ANTS) Youth Allowance and Family Tax Benefit Interaction at July 2000 Family Income Status Rent Max Net Gains Made Over $100 per week Gross Private Income Ranges (income split 75:25) Ass/ce Benefit pw $0-100 $101-200 $201-300 $301-400 $401-500 $501-600 $601-700 $701-800 $801-900 $901-1,000 NSA/PP (partnered) with nil $418.15 $66.10 $26.10 $26.10 $21.20 $20.30 $46.90 $49.90 $72.10 $72.20 $13.10 1 YA recipient with RA $438.27 $65.90 $26.30 $26.10 $21.20 $20.30 $44.10 $49.90 $72.10 $72.20 ($4.20) NSA/PP (partnered) with 2 nil $528.15 $65.95 $26.30 $26.10 $21.20 $24.90 $22.00 $56.70 $72.20 $13.50 $12.80 children and 1 YA recipient with RA $576.29 $66.00 $26.20 $26.10 $21.30 $24.90 $17.20 $26.70 $58.90 $13.40 $12.80 NSA/PP (partnered) with 1 nil $567.07 $66.00 $26.20 $26.10 $21.20 $24.90 $22.20 $25.80 $59.60 $11.10 $0.70 child and 2 YA recipients with RA $615.21 $66.00 $26.20 $26.10 $21.30 $24.90 $20.60 $59.60 ($12.20) ($7.80) $11.00 Table 2b: impact of integration proposals Family/Income Status Rent Maximum NSA/PP (partnered) with 1 YA recipient NSA/PP (partnered) with 2 children and 1 YA recipient NSA/PP (partnered) with 1 child and 2 YA recipients. Ass/ce. Benefit pw. nil with RA nil with RA nil with RA. $418.20 $438.30 $528.15 $576.29 $567.10 $615.20. $0-100 $66.10 $66.10 $66.17 $66.17 $66.10 $66.20. Net Gains Made Over $100 per week Gross Private Income Ranges (income split 75:25) $101-200 $201-300 $301-400 $401-500 $501-600 $601-700 $701-800 $801-900 $901-1,000 $26.20 $26.40 $21.10 $20.20 $28.10 $41.80 $42.10 $69.80 $72.20 $26.20 $26.40 $21.20 $20.10 $39.00 $42.10 $69.80 $72.20 $10.80 $26.21 $26.32 $21.18 $24.90 $27.36 $37.83 $47.00 $56.03 $42.12 $26.20 $26.33 $21.18 $24.90 $27.35 $37.83 $42.13 $26.02 $28.87 $26.30 $26.30 $21.20 $24.90 $27.30 $50.80 $47.90 $42.20 $42.10 $26.20 $26.30 $21.20 $24.90 $27.30 $37.90 $18.00 $36.90 $42.10. NOTES: It is assumed that 75 per cent of private income accrues to the head (ie. main earner). Calculations for the single YA recipient only scenario assumes NSA/Parenting Payment (partnered) parents with the YA child aged 16-17 years of age. Calculations for the one YA recipient scenarios assumes NSA/Parenting Payment (partnered) parents with the YA child aged 16-17 years and two FTB children - one 5-12 years and one 13-15 years of age. Calculations for the two YA recipients scenarios assumes NSA/Parenting Payment (partnered) parents with one YA child aged 16-17 years, the other aged 18-25 years and one FTB child 13-15 years of age. The following is a guide to the cell formats. bold italics. Net gain is negative. bold. Net Gains of between $0 and $15 per week. plain. Net Gains of between $15 and $25 per week.
(21) 18 Chart 5: impact of integration on disposable income: couple with one child 13-15 plus two YA children 1150. 1050. disposable income $pw. 950. integration, RA. 850. integration: no RA 750. Current (ANTS) system. 650. 550. 450. 350 1. 2. 3. 4. 5. 6. 7. 8. 9. 10. 11. 12. 13. 14. 15. private income ($100 pw). The total cost of the “unstacking” package comes to an estimated $200-300 million pa (the higher cost applies if the taper is left at 25 per cent). There would be few if any losers from the package, with the higher thresholds overcompensating for the slightly higher (30 per cent) taper. An estimated 40 per cent of families currently receiving part-rate Youth Allowance would benefit. Stacking will continue to be an issue for those receiving Youth Allowance and Rent Allowance, and for those receiving FTB(B). It may be appropriate to allow Rent Allowance to stack with Youth Allowance, as is now done. Alternatively, tapering of Youth Allowance could be held off until Rent Allowance is exhausted (an option consistent with Keating and Lambert’s proposals (see below). Full integration of Rent Allowance and Youth Allowance requires that Youth Allowance disregards be set sufficiently high such that all Rent Allowance is lost before Youth Allowance starts to taper (or visa versa). For larger families, these thresholds could be very high indeed: see the discussion of Rent Allowance options below.. 2.5. Stacking between FTP(A), FTP(B) and Parenting Payment (Partnered) Parenting Payment (Partnered) tapers after the spousal income exceeds $32 pw, at the rate of 50/70 per cent. The FTB(B) tapers at 30 per cent on spousal income in excess of $32 pw, up.
(22) 19. to a cut-out of either $8,750 pa (child 5-15) or $10,500 pa (child 0-4). The two tests will stack, implying high effective tax rates on spousal income, especially where the partner is a low wage earner. This is illustrated in Chart 6, which shows that EMTRs for a spouse of a minimum wage earner (2 children, pay rent) are very high between $40 and $200 pw.. Chart 6 - spouse incentives: ANTS - NSA/PgA couple with 2 children at July 2000 Ch.< 5 = 1, Ch. 5-12 = 1, Ch. 13-15 = 0 Pay priv. rent of $200 pw, head earns min wage. 100%. $900 7 4 3. $700 $600. 2. 80%. 8 10. 6. 12 13. 60% EMTR. Weekly Disposable Income. $800. $500 5. $400. 11. 9. 40% $300. 14. 1. $200. 20%. $100 $0. 0% $0. $100. $200. $300. $400. $500. $600. Weekly Private Income. Weekly Disposable Income. EMTR. If the spouse is considering a job, and her husband’s income is $28,200 pa, FTB (B) will stack with FTB (A), with the two payments tapering away simultaneously at the rate of 30 per cent each. With childcare costs, this could result in a substantial disincentive to her working. The fact that Childcare Assistance also commences to taper above $28,200 (at the rate of 10 per cent, one child or 15 per cent, if two or more) does not help this situation. It should be noted that these stacking problems are not new. Partly they are due to the loss 10 of the couple’s residual allowance over the income range between the husband’s earnings and $28,200 and, prior to the NTS, FTB(B) had a “sudden death” spousal income limit of $4,777 pa. 10 It is not easy to totally obliterate sexist assumptions without making the meaning incomprehensible. For this reason I have persevered with the traditional male breadwinner model in explaining the current system, although it is technically no longer applicable..
(23) 20. Clearly, it is preferable to have a more gradual taper as under the NTS, despite stacking problems. However it would be even more preferable to get rid of such problems entirely. The basic issue here is that the social security system has moved beyond its traditional poverty-alleviation function and, through FTB(B), taken on the additional role of compensating for some of the indirect costs of young children – notwithstanding that it is paying this assistance to many people who are entirely outside of the workforce and for whom indirect costs are therefore a somewhat tenuous concept. Since this assistance then has, for cost reasons, to be withdrawn as family income rises, the necessary implication is that there must be high EMTRs on working mothers. One solution is to get compensation for indirect costs out of the social security system and back into the tax system – eg, as a reinvigorated dependent spouse rebate. However this view is totally at odds with developments in the social security system during the 1990s. The other possible solution is to cash out compensation for indirect costs as a supplement to existing basic rates. This would result in a single FTB system replacing FTB(A) and (B); the maximum rates would be as follows: Age 0-4 5-12 13-15. $pa 5,618 4,835 5,638.. The above table makes explicit another of the problems introduced into the system once it starts compensating for the indirect costs of children. That is, the maximum rates of assistance first fall, then rise, with increasing age of the child. This is contrary to the results of research on the relative (direct) costs of children. However, the option of a single FTB with such a rate structure does at least make the system transparent. There may indeed be a case for providing some childcare assistance as a direct payment to mothers of young children, although the appropriate balance between cash assistance and fee reimbursement is itself a difficult issue. A neat compromise is perhaps to make assistance for children independent of the age of the child, a structure now being pursued in the UK and which would not be very different to the NTS-based system proposed above. Chart 7 shows one example of the consequences of this option for EMTRs and disposable income. In general the ‘front loading” of EMTRs for the spouse is reduced, but at the possible cost of backloading them higher up the income scale. Another important consequence is that the disposable income curve rises more smoothly over the important income range of $150 to $400 pw..
(24) 21. Chart 7: comparison of ANTS vs FTB(B) unstacking option: spouse incentive, couple with one child 0-4, receiving RA 1200. 0.9. 1100 0.8 1000 0.7 900. proposal. Allowance Payable (Total). 800. 0.6. 700. ANTS. 0.5. 600 0.4 500 400. 0.3. 300 0.2 200 0.1 100 0 0. 100. 200. 300. 400. Option 1. 500. 600. 0 700. Option 2. Cashing out FTB(B) as a supplement to FTB(A) payments has two main consequences (apart from easing EMTRs on working mothers). First, it provides substantial additional assistance to low income families where the mother is working. In this example she is a net gainer on any personal income between nil and $600 pw. Second, it reduces assistance to high11. income families where the mother is not working The incentive effects are likely to be favourable, on balance, to the workforce participation of low-income mothers. 2.6 Childcare assistance It would be highly desirable if the taper on childcare assistance could be reformed to avoid stacking problems with means tests on other payments. In the UK system, for example, childcare 12 assistance is part of the total Working Families Tax Credit, and abates sequentially. This would also be possible in Australia and indeed this is the treatment suggested by Keating and Lambert. 11 Assuming that access to the DSR is also restricted for such families. This proposal would suggest that the DSR for those without children be abolished.. 12 Strangely enough, this is not true of housing assistance in the UK, which is a separate scheme and can stack quite severely with other tapers. In Australia this is only true of state housing rental rebates, and Commonwealth RA does not stack. Hence the Australian and UK systems are opposite. Since secondary incomes are found to be more sensitive to incentives than primary ones, it may be the UK solution is a better one..
(25) 22. (see below), although they were unable to cost it because of data limitations. An implication of treating childcare in this manner is that the cutout point for combined family payments, rent assistance and childcare assistance could be very high indeed, more so if the FTB taper were further reduced. With four children, for example, the cutout would be well over $70,000 pa. The issue is, should this be regarded as a problem? There is good reason for suggesting that it should not. Childcare assistance could validly be regarded as a horizontal equity-type payment, and indeed a logical alternative to our current means tested system would be a straightforward tax deduction for childcare costs. Thus there is no need for concern about a system which allows childcare assistance to flow to quite highincome earners, particularly those with several children. Equivalence scale research tells us that such a family, on $70,000 pa, would not be better off than a childless couple on, say, $35,000 pa. Another argument in support of such an approach is that research on comparative fertility has suggested that fertility is higher, other things equal, in those countries that actively support working mothers’ labour force participation (McDonald 1997). In this manner having children should not need to become an enormous sacrifice, in terms of foregone earnings. Family policy in Australia will increasingly have to consider fertility as an important aim, in the context of 13. sharply falling fertility rates and an ageing population 2.7 Keating/Lambert proposals The Keating and Lambert proposals, briefly described earlier, are designed to rationalise means tests for families. The method is to first establish a family's potential entitlement for assistance, and then establish their actual entitlement on the basis of their assessed means. For pragmatic reasons pensions and benefits would continue to have different free areas. However, all tapers 14. would become 50 per cent At the family payment threshold of $542 pw ($28,200 pa), "second tier" payments would start to abate at a rate of 30 per cent. This tier includes FTB(A) and (B), Youth Allowance and Rent Assistance , "and would have included childcare assistance if that had been possible [ie amenable to costing using NATSEM’s (Stinmod) microsimulation model]" (Keating and Lambert 1998b p283). Part of the proposal is financed by abolition of the quasi-universal component of FTB(A), and also of FTB(B). In general the Keating and Lambert proposal is a sensible one, albeit that the administrative details need elucidation. My main comment is that the objectives can be achieved more simply and directly by the options set out above (single taper for FTB(A), Youth Allowance unstacking and FTB(A) and (B) integration), which combined have a very similar effect to the Keating and Lambert plan but a simple set of pre-defined thresholds and sequential tapers. The other outstanding issues relate to allowance tapers and Rent Allowance, as discussed below.. 13 Singapore, with a serious fertility problem, has recently announced a substantial ‘baby bonus’ for second and subsequent children.. 14 Note that this proposal pre-dates the 40 per cent pension taper in the NTS..
(26) 23. 2.8. Reduce allowance tapers? Keating and Lambert propose an allowance taper of 50 per cent. A 20 percentage point 15. taper cut results in a net decrease in EMTRs of 16 percentage points (Chart 8) This would address the ‘hot spots’ found among the allowance ETRs, but at the cost of blowing out the cutouts and exacerbating the notch problem unless the FTB(A) threshold were further raised.. Chart 8: allowee couple: ANTS vs 50% allowance taper ( income split 100:0; max RA) 1000. 1.2. 900 1 800. 700 0.8 50% taper. 600. 500. 0.6 ANTS. 400 0.4 300. 200 0.2 100. 0. 0 0. 100. 200. 300. 400. 500. 600. 700. 800. One advantage of reducing allowance tapers is that it reduces horizontal inequities as between allowees and pensioners. At the moment, for example, there is a very substantial incentive for clients to apply for a Disability Support Pension, for example, rather than Newstart or Sickness Allowance. While the higher basic rate for singles is one aspect of this, so too are the much more lenient means test conditions. This is illustrated in Chart 9, comparing single Newstart Allowees with single Disability Support Pension recipients (both receiving Rent Allowance). The Chart shows that an initial 15 Reducing tapers will reduce EMTRs, but not quite to the same extent. If the allowance is taxable, the extra tax payable will offset some of the benefit of the taper reduction. If a 70 per cent taper is reduced to 50 per cent, and the tax rate applicable is 20 per cent, then the old EMTR is (70 + .2*30) = 76 per cent, and the new EMTR is (50 + .2*50) = 60 per cent..
(27) 24. differential of $25 pw in favour of the Disability Support Pension recipient becomes as high as $213 pw at around $350 pw of private income. This is caused by the large difference in free areas and tapers for the different clients (the non-taxation of Disability Support Pension also contributes to this). Rate and taper differences may also be manifested in the increasing rate of take-up of Disability Support Pension among the older working age population (see Ingles 1998b). Chart 9: Newstart allowance vs DSP, single with RA. $900. 100%. $800. 90% 80%. $700. 70%. $600. 60% $500 50% $400 40% $300. 30%. $200. 20%. $100. 10% 0%. $0 $0. $100. $200. $300. $400. $500. $600. $700. $800. Private Income. newstart. Disability support pension. newstart. Disability support pension. A similar issue arises for sole parents as opposed to mothers who are in a couple. In the case of a 2 child family, the initial rate differential in favour of the couple, already quite low at $416 vs $494 pw (a ratio of .84), actually reverses at higher income levels and at a private income of $494 becomes negative, at up to $24 a week extra for the sole parent, before the two disposable income lines ultimately converge. The superimposed EMTR graph in Chart 10 shows that this reversal is due to the lower (40 per cent) NTS taper on Parenting Payment for sole parents. It is difficult to believe that the Government had this result in mind when it designed the NTS measures. Such anomalies can be addressed either by reducing allowance tapers or tightening pension ones. Reducing tapers can be quite expensive, and extends benefits to relatively high-income levels — compared, for example, to low full-time wages. For example, reducing the pension taper from 50 to 40 per cent in the NTS moved the age pension cut-out points from $21,320 pa.
(28) 25. Chart 10: sole parent vs couple, 2 chn + RA. 120%. $1,200. 100%. $1,000. Disposable Income. 80%. $800 60%. $600 40%. $400 20%. $200. 0%. -20%. $0 $0. $100. $200. $300. $400. $500. $600. $700. $800. $900. $1,000. Private Income. NSA/PPP couple, 2 chn + RA. sole parent, 2 chn + RA. NSA/PPP couple, 2 chn + RA. sole parent, 2 chn + RA. (singles) and $35,620 pa (couple), to $25,649 and $43,030 pa, respectively.. Currently, there are many full-time workers who have income below the allowance cut-outs but are ineligible for allowance because of the work test. It would cost some $3 billion pa to extend eligibility to them. It is difficult to argue for this because it implies a role for unemployment payments quite different to the current philosophy, and also because of the difficulty in measuring the incomes of the self-employed. But it is not difficult to argue that further extension of the allowance cutouts may not be a high priority; rather, priority should be 16. placed on reducing tax on low-income families whether or not they are in the allowance system While this will be more costly it will help to preserve work incentives and maintain horizontal equity. The cost of fully aligning the allowance with the pension means test (including $3 billion 16 An earned income tax credit would be one instrument for reducing tax on the low paid, but Ingles (forthcoming) argues that there are problems with this, and alternative tax instruments are available. There is also a range of ‘return to work’ payments such as the participation supplement favoured in the McClure Report (Reference Group On Welfare Reform pp28-30)..
(29) 26. from extension of eligibility to full-time workers) is estimated to be as high as $14 billion pa, with a further $2 billion flow-on from the necessary increase in the FTB(A) threshold. Instead, pension tapers for those of working age could be dragged back more into line with those already applying to allowances, possibly with some small adjustment to iron out EMTR “hotspots”. The ultimate aim might be a “single workforce age payment” with a simple common taper of, say, 60 per cent and utilising the existing allowance free areas of $31 pw per adult. This would blow out the benefit cutout to about $30,400 pa for a couple (income split 50:50 – see Chart 11) with a consequent need to raise the family payment threshold by $2,200 pa, but overall the cost would be relatively containable. The concept of a single workforce age payment has been endorsed in the interim report of the Reference Group On Welfare Reform (2000a and b), albeit that the report is rather light on detail. The basic problem is that a common payment based on pension conditions is probably not affordable unless the behavioural response were very large; whereas one based on allowance conditions would result in significant losses among some Disability Support Pension and sole parent (Parenting Payment) recipients.. Chart 11 Allowee couple (income split 50:50): ANTS vs single 60% taper. 100%. $900. 90%. $800. 80% $700 70% $600 60% $500. 50%. $400. 40% 30%. $300 20% $200 10% $100. 0% -10%. $0 $0. $100. $200. $300. $400. $500. $600. Private Income ANTS. 60% common taper. ANTS. 60% common taper. $700. $800.
(30) 27. Basic rates could be standardised among the workforce aged, bringing the allowance rate up to the pension rate (possibly with some reduction for those under say 25), but could be supplemented by special allowances such as for costs associated with disability. Raising all allowance rates to the pension maxima would cost some $700m in a full year, but this cost will escalate progressively if the allowances were — like pensions — indexed to Male Total Average Weekly Earnings (MTAWE). There would be further costs associated with any easing of means test parameters for allowances, and some savings from pulling back Disability Support Pension and sole parent means test parameters towards those prevailing in the allowance regime. There would also need to be abolition of the “sudden death’ asset test now 17 applying to allowances. The bottom line is that the social security measures in the government’s Tax Package have undercut what should arguably be the ultimate aim of commonality in rates and tapers across the workforce age population, and compounded serious horizontal inequities which already exist within the system. The lower pension taper could have been restricted to the aged, where different considerations (notably relating to savings incentives and interaction with superannuation tax) apply. 2.9 What should be done with Rent Assistance There are a number of anomalies in the current system of rent assistance, State and federal. Commonwealth Rent Assistance for those without children tapers beyond the pension or allowance cutout points, and at the same rate – ie, 50 per cent for pensioners and 70 per cent for allowees. However assistance for those with children tapers out beyond the cutout points at the same 30 per cent rate as for basic family payments. State public housing rent assistance phases out at around 20-25 per cent for a family income of around $20,000 (depending on family size), and thus stacks extensively with family payments and even allowance tapers. As shown in Ingles 1997, this can cause serious disincentives. Because of the large differences between the Commonwealth and State schemes, the Industry Commission (1993) recommended moving Commonwealth rental assistance to a State housing- type formula. Such a move was not then desirable in the case of families because it would, at the time, have caused very serious stacking problems with the 50 per cent family payment means test taper. There are several options for Rent Allowance. The most generous is that Rent Allowance not taper until all maximum family payments are lost. This is the solution envisaged in the NTS, and also by Keating and Lambert — who extend the principal to Youth Allowance payments as well, and wished to extend it to childcare payments. One obvious problem is that family payment cutouts rise significantly as the taper rate is reduced, with a corresponding rise in the costs of Rent Allowance. A less generous option (at least for families) is that Rent Allowance be de-coupled from the family payment system and, as recommended by the Industry Commission, be paid on similar. 17 One option is its replacement with a single graduated deeming regime applying to all financial and non-financial assets. This need not necessarily imply a net cost if the deeming rate were high enough.
(31) 28. lines to State Housing Rental Rebates (SHRRs), meaning that Rent Allowance would be allowed to stack with other means tests in the family payments system. With the family payment taper reducing to 30 per cent under NTS, or even 20 per cent under the proposals in this paper, this stacking problem could perhaps be lived with. Stacking with basic allowance tapers could be resolved by indexing the Rent Allowance and SHRR thresholds to the allowance cutout points. This option creates the potential for savings that could be redirected to other parts of the Rent Allowance system. If, for example, Rent Allowance were de-coupled from benefit payments to non-family couples and individuals and the taper reduced to that applying to families, RA would be transformed from an out-of work benefit mainly restricted to clients, to an 18 in-work benefit that tapers only moderately with rising income. Current inequities as between state housing clients and Commonwealth social security clients would be substantially ameliorated. There is a horizontal equity argument for allowing Rent Allowance to flow to quite high income households, since renters at all income levels have fewer resources than homeowners (but not necessarily homebuyers). On this argument Rent Allowance is a sort of rough compensation for the non-taxation of imputed rent. This argument supports the “long-tail” Rent Allowance taper. There is, conversely, a horizontal equity argument for making Commonwealth and State rent assistance more similar, one that supports allowing the tapers to stack. This argument is somewhat weakened, however, by the very large differences in maximum assistance provided by 19 the two systems. It ought to be the ultimate goal that the two systems converge. There is also the issue of horizontal equity between homeowners, homebuyers, and renters. The first best solution to this is simply to gross up all payments in the system to include an adequate component for housing costs, (including supplements for high cost areas like Sydney), and then tax back imputed income from wealth including housing wealth. Since this is unlikely to obtain political support in the near (or even the distant) future, the second best solution is to support the regular payments made by renters and also homebuyers with small amounts of equity in their homes. In the UK, for example, an extensive system of Housing Assistance helps home purchasers as well as renters. The government, in the GST compensation package, has chosen to revive the approach of a lump sum $7,000 subsidy for first homebuyers. Very few people mourned the passing of the original First Home Owners Scheme in the 1980s. One option is that this subsidy should ultimately be abolished and be replaced by an extension of Commonwealth Rent Assistance to homebuyers based on means testing comprehensive assets — ie including housing equity. Only in this manner can a comprehensive and neutral system of low income housing assistance be achieved.. 18 Currently , where there are no dependent children RA tapers as a continuation of the allowance or pension taper applicable; ie, at 70 or 40 per cent. 19 The value of state rental assistance typically exceeds Commonwealth Rent Allowance by a substantial margin - see Industry Commission 1993..
(32) 29. Whether such a system of housing assistance should be tapered sequentially with other family and Youth Allowance payments, or allowed to stack, should be decided at the time by reference to the tapers ultimately decided on. If, for example, the family payment taper were reduced to 20 per cent (as proposed herein), a stacked housing assistance taper of say 20 per cent could perhaps be tolerated.. 2.10 Conclusion: the NTS and associated reforms The measures discussed here are essentially alternative means of implementing the Keating/Lambert proposal for a single, sequential tapering of all Commonwealth income support payments. This, in turn, is not all that different from the Dawkins et al (1998) proposal for a negative income tax system with a three-part rate structure and an initial 60 per cent marginal rate. It is shown here however, that it is possible to iron out the worst of current anomalies and ETR ‘hotspots’ by relatively simple changes to existing policy parameters. Moreover, the required measures are relatively inexpensive, in the case of Youth Allowance adding up to no more than $200-300m in a full year (note that this is a small amount in the context of the whole social security budget). Furthermore, as Keating and Lambert have shown, it is possible to offset part and perhaps all of the other “unstacking” costs by relatively modest adjustments which phase out the remaining quasi-universal payments in the system, payments which have no clear rationale in the context of the main poverty alleviation aims of the Australian system. The question here, however, is whether the Government is willing to abolish those bits of “middle class welfare” remaining in the family payment system. Although there is no reason to 20 oppose universal family assistance as such, the existing two-part taper might be regarded as a half-baked compromise between poverty alleviation and horizontal equity objectives, and it is also noted that a substantial measure of horizontal equity is achieved by low tapers which allow means-tested assistance to flow into the mid-ranges of the (equivalent) income distribution. Apart from the single 20 per cent family payment taper proposal, it seems highly desirable that the main parts of the Youth Allowance and FTB(A) unstacking exercise should proceed. Whether Newstart Allowance and Parenting Payment (Partnered) tapers should be reduced is a difficult issue however. The main problem is that this would exacerbate horizontal inequities vis-à-vis low income earners not in the categorical system, such as the self-employed. I conclude that a single taper of 60 per cent, with the current thresholds, may be as far as can sensibly be gone in the absence of more fundamental structural changes. Ingles’ ‘unstacking” agenda, Keating and Lambert “family accounts” and the Dawkins et al modified negative income tax all end up looking quite similar in terms of their ultimate effects on financial incentives and families’ disposable incomes.. 20 From an economic efficiency perspective it may not matter much whether family benefits are taxed back more severely, or taxed back less and general tax rates raised to finance this. See the relevant discussion in Ingles 1997..
(33) 30. The Australian income support system is very close — certainly the closest in all the OECD area — to academic views of a pure NIT system, except for some aberrations around the edges, and the presence of activity tests. Further and more fundamental reforms aimed at enhancing the operation of this system are discussed in Discussion Paper 424 (Part 2 of this set)..
(34) 31. 3. Appendix A: The NTS changes to assistance for families. 21. To accompany the changes to the personal income tax system, the Government will introduce substantial reforms to the various forms of assistance provided to families through the income tax and social security systems. These reforms will boost the amount of the income tax cuts that families receive, substantially improve work incentives for low and middle income families and simplify the complex array of assistance provided currently to families. Extra assistance is provided to families by extending the Family Tax Initiative (FTI), introduced by the Government in January 1997, at a cost of over $2 billion in 2000–01. The FTI currently provides an increase in the tax-free threshold of $1,000 for each dependent child, plus an extra $2,500 for single income families with a child aged under 5 years. From 1 July 2000, these thresholds will be doubled to $2,000 and $5,000 respectively. The effect of this is that all single income families (including sole parents) with a child under 5 years will have an effective tax-free threshold of $13,000. This is made up of the new $6,000 tax-free threshold plus $2,000 for one dependent child and the further $5,000 provided to single income families with young children. Overall, such families have a tax-free threshold that is more than double the general $6,000 threshold. For families, the doubling of the FTI means: • an increase in assistance of $140 a year (a 70 per cent increase) for each dependent child; and •. an extra $350 a year (a 70 per cent increase) for single income families with a child aged under 5 years.. Other elements of the families package. Impr ov ing inc entiv es for families to wor k , inc luding the unemploy ed.. The current system of assistance for families, particularly the overlap between the various income tests for benefits, results in disincentives for low and moderate-income families to work. Many families face an effective marginal tax rate of 85.5 per cent or more if they increase their income. To remove these overlaps and disincentives, the Government will, from July 2000, ease substantially the income test for Family Allowance by: • increasing the level of income at which it begins to be income tested from $24,350 a year (for one child) to $28,200 a year; and •. reducing the income test taper rate from 50 per cent to 30 per cent.. These measures provide substantial extra income to help lower income families raise their children and improve work incentives. They ensure that unemployed families will not incur a sudden drop in Family Allowance (and hence income) when they leave the income support system, improving incentives for them to obtain a full-time job. 21 This is an edited version of the Governments Tax package summary as released on the Treasury Website See also Costello 1998..
Figure

Related documents
In this project, we have utilized the versatility of Active RFID in implementing automatic student’s attendance recording system that enables the filling of attendance when the
Neither can we em- bed graphs with loops containing odd numbers of spins (those that we expect to be frustrated) nor an arbitrary number of even-spin loops. We therefore consider
Hardware Overview Side Alignment Bracket Elevation Adjustment Azimuth Adjustment Ground Bonding Point Lock Bolts Lock Bolts... Back Lock Bolts Lock Bolts Azimuth Adjustment
The results of CRA, when compared to usual care: there is strong evidence that CRA is more effective with regard to number of drinking days, and conflicting evidence with regard
Decriminalization or legalization has majority support right across the country, even among Conservative voters, and there appears to be little downside to this issue for
These systems, however, require that dispatchers manually identify any discrepancies between the actual data available in the fleet telematics system and the planned data in
Survey on Evidence of Retrievability Schemes of Cloud Storage Services for Resource-Strained Devices
Since clients' information is stored in the cloud storage service, it brings clients' information security issues. In the public auditability model, clients can
The Commission will support Member States in promoting a permanent dialogue and peer evaluation at European level on issues such as labour market gaps,
