MPRA
Munich Personal RePEc Archive
The Dynamics of Government Debt and
Economic Growth
Vighneswara Swamy
Institute of Economic Growth
16. April 2015
Online at
http://mpra.ub.uni-muenchen.de/63693/
1
The Dynamics of Government Debt and Economic Growth
Vighneswara Swamy
vs@iegindia.org
Abstract
The dynamics of government debt and economic growth, once a subject of interest mostly to very few macroeconomists is suddenly of immense attention for many researchers in the backdrop of Euro zone sovereign debt crisis and Reinhart & Rogoff‘s related research. This study investigates the government debt – growth relationship and contributes to literature in the following ways: First, we extend the horizon of analysis to several country groupings and make the study inclusive of economic, political and regional diversities based on a sizeable dataset. Second, we provide evidence for the presence of a causal link going from debt to growth with the use of ‗instrumental variables approach‘ unlike the RR approach. Third, we overcome the issues related to data adequacy, coverage of countries, heterogeneity, endogeneity, and non-linearities by conducting a battery of robustness tests. We find that a 10-percentage point increase in the debt-to-GDP ratio is associated with 2 to 23 basis point reduction in average growth. Our results establish the nonlinear relationship between debt and growth.
Keywords: Government Debt, economic growth, panel data, nonlinearity, country groupings
2
1. Introduction
Do sovereign countries with high government debt tend to grow slowly? - has been an important policy question in the recent times. As the current debt trajectories in several economies around the world are not sustainable, there is a growing concern among the policymakers, central banks, and international policy organizations to understand the effects of government debt on economic growth. Many of the countries in the euro zone and more particularly Greece are struggling with a combination of high levels of indebtedness, budget deficits and frail growth. This has necessitated the revival of the academic and policy debate on the impact of rising levels of government debt on economic growth.
A growing empirical literature shows that there is a negative correlation between government debt and economic growth. This correlation becomes particularly strong when
government debt approaches 100% of GDP (Reinhart and Rogoff 2010a; 2010b; Kumar and
Woo 2010; Cecchetti et al. 2011). Reinhart and Rogoff (RR), in some of their influential articles, argue that higher levels of government debt are negatively correlated with economic growth, but that there is no link between debt and growth when government debt is below
90% of GDP (Reinhart and Rogoff, 2010a; Reinhart, Reinhart and Rogoff 2012). They deftly
state that their results did not prove the existence of a causal relationship going from debt to growth. RR‘s findings have kindled a new literature seeking to assess whether their results were robust to allow for non-arbitrary debt brackets, control variables in a multivariate regression setup, reverse causality, and cross-country heterogeneity. After the publication of
the (critique) article by Herndon, Ash, and Pollin (2014) challenging some of RR‘s findings,
the discussion on the relationship between debt and growth in advanced economies has
become more animated. Krugman (2010), citing the case of Japan, argues that the link
between debt and growth could be driven by the fact that it is low economic growth that leads to high levels of government debt.
Empirical research, of late, has begun to focus on possibilities of non-linearities within the debt-growth nexus, with specific attention to high government debt levels. The empirical literature on this issue remains sparse as very few studies employ non-linear impact analysis.
Studies by Chang and Chiang (2009), Cecchetti et al., (2011), and Baum et al., (2013)
provide some contribution in this direction. Chang and Chiang (2009) and Cecchetti et al.,
3
We notice three inadequacies in the empirical literature on debt-growth nexus. First, none of the studies has focused on the different groupings of economies based on their political structures, income levels, regional geographies and debt regimes. Second, we do not find studies emphasising the need for establishing the presence of a causal link going from debt to growth that requires finding what economists call an ‗instrumental variable‘. Third, there is a need to expand the horizon of the data sample, as averaging across OECD / advanced countries alone would make such inferences difficult.
Our study is unique as it overcomes the issues related to data adequacy, coverage of countries, heterogeneity, endogeneity, and non-linearities. We contribute to the current strand of literature on government debt and economic growth by extending the horizon of analysis to several country groupings and make the study inclusive of economic, political and regional diversities. We provide a thorough econometric analysis of countries with large sample drawn from diverse groupings that allows for non-linearity estimation. Our data-intensive approach offers stylized facts, well beyond selective anecdotal evidence. We offer to provide evidence for the presence of a causal link going from debt to growth with the use of ‗instrumental variables approach‘ unlike the RR approach. This paper makes a distinct contribution to the debate by offering new empirical evidence based on a sizeable dataset.
The paper is organised as follows. We present our data in section 2. In section 3, we analyse the government debt-economic growth nexus. Section 4 describes our estimation strategy. In section 5, we provide the detailed discussion on results. Section 6 concludes.
2. Data
Our dataset comprises annual macroeconomic data on 252 countries, over the period 1960-2009. To maintain homogeneity in as much as it is for a large sample of countries over the course of five decades, we employ as a primarily source – World Development Indicators (WDI) database 2014 of World Bank. We strengthen our data with the use of supplementary data sourced from International Monetary Fund, World Economic Outlook 2014 database, International Financial Statistics and data files, and Reinhart and Rogoff dataset on Debt-to-GDP ratios.
We arrange our sample data into five broad categories: (i) debt regimes, (ii) economy
groupings, (iii) income groupings, (iv) political governance groupings, and (v) regional groupings. We place each of the 252 countries in the WDI list into its relevant category of our
4
country groupings. However, each country‘s entry into the group is dependent on the data adequacy. Exclusion of any country of the WDI list from our sampling is solely due to data considerations (either non-availability or inadequacy of data). Further, for lack of complete data for the stated variables for all the required time period in executing the panel GMM IV approach based regressions, some of the countries could not make into the detailed econometric analyses of debt-growth nexus. The list of countries covered in detail under
different groupings and sub-groupings are provided in annexure 1 to 5.
Debt regime groupings
We group our sample countries into five debt regime groupings: 0-30%, 31-60%,
61-90%, 91-150%, and >151% comparable to RR groupings based on the average debt/GDP
levels (Table 1).
Table 1: Sample description for debt regimes Panel A: Sample frame for debt regime groupings
Period DR 0-30% DR 31-60% DR 61-90% DR 91 & above DR 151 & above Total
1960-2009 29 56 18 14 5 122
1970-2009 32 52 20 14 4 122
1980-2009 24 53 24 16 5 122
1990-2009 24 51 24 18 5 122
2000-2009 24 45 20 13 5 107
Panel B: Government Debt and GDP Growth in debt regimes
Countries observations Debt Regime GDP Growth Government Debt
Mean Median Mean Median
8 160 0-30% 5.06% 4.83% 27.15 27.79 31 620 31-60% 3.79% 3.68% 58.29 45.00 20 400 61-90% 2.71% 2.70% 80.08 82.87 13 260 91-150% 1.86% 1.88% 115.50 116.51 4 80 >151% -1.08% -1.32% 176.75 160.99 Total=76 1520 Economy Groupings
The World Economic Outlook April 2011 of IMF1guides our classification of countries
into advanced, emerging and developing economies. We consider two more broad groupings:
BRICS (Brazil, Russia, India, China and South Africa) and OECD2 (Organisation for
1
World Economic Outlook April 2011 of IMF (Table 4.1: Economy groupings) is available at http://www.imf.org/external/pubs/ft/weo/2011/01/pdf/text.pdf
2
The details about OECD members are available at http://www.oecd.org/about/membersandpartners/list-oecd-member-countries.htm
5
Economic Co-operation and Development). Table 2 provides sample description for economy
groupings.
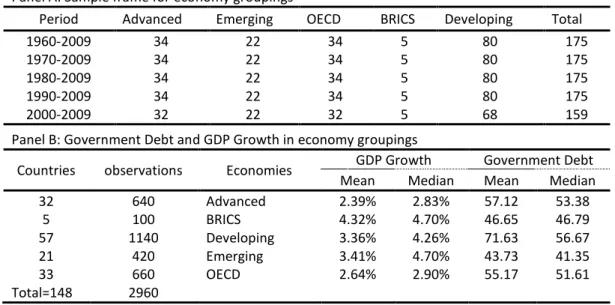
Table 2: Sample description for economy groupings Panel A: Sample frame for economy groupings
Period Advanced Emerging OECD BRICS Developing Total
1960-2009 34 22 34 5 80 175
1970-2009 34 22 34 5 80 175
1980-2009 34 22 34 5 80 175
1990-2009 34 22 34 5 80 175
2000-2009 32 22 32 5 68 159
Panel B: Government Debt and GDP Growth in economy groupings
Countries observations Economies GDP Growth Government Debt Mean Median Mean Median
32 640 Advanced 2.39% 2.83% 57.12 53.38 5 100 BRICS 4.32% 4.70% 46.65 46.79 57 1140 Developing 3.36% 4.26% 71.63 56.67 21 420 Emerging 3.41% 4.70% 43.73 41.35 33 660 OECD 2.64% 2.90% 55.17 51.61 Total=148 2960
Table 3: Sample description for income groupings Panel A: Sample frame for income groupings
Period Low-income (LIC) Middle-income (MIC) High-income (HIC) Heavily indebted poor (HPC) Least developed (LDC) Total 1960-2009 15 63 44 18 17 220 1970-2009 16 62 44 19 18 221 1980-2009 16 62 44 19 18 221 1990-2009 16 62 44 19 18 221 2000-2009 10 54 43 11 9 181
Panel B. Government Debt and GDP Growth in Income groupings
Countries Observations Economies GDP Growth Government Debt
Mean Median Mean Median
38 760 High-income countries (HIC) 2.62% 3.10% 49.99 45.89
16 320 Heavily indebted poor countries
(HPC) 3.12% 3.95% 124.10 103.87
12 240 Least developed countries (LDC) 3.76% 4.78% 100.86 81.39
11 220 Low-income countries (LIC) 2.92% 4.17% 91.37 87.06
34 680 Middle-income countries (MIC) 3.72% 4.56% 52.17 42.73 Total=111 2220
Income Groupings
In arranging the data for income groupings, we follow the World Bank classification of
economies3updated for the fiscal year 2015. We consider high-income economies (HIC),
3 World Bank country classification is available at http://data.worldbank.org/about/country-and-lending-groups Accordingly,
low income countries are those with gross national income (GNI) per capita of $1,045 or less; middle income countries, $1,046–12,745; high-income countries, $12,746 or more. The least developed countries (LDC) are classified as per the criteria set by the United Nations Economic and Social Council.
6
heavily indebted poor countries (HPC), least developed countries (LDC), low-income
economies (LIC), and middle-income economies (MIC). Table 3 provides the description of
our sample based on income groupings.
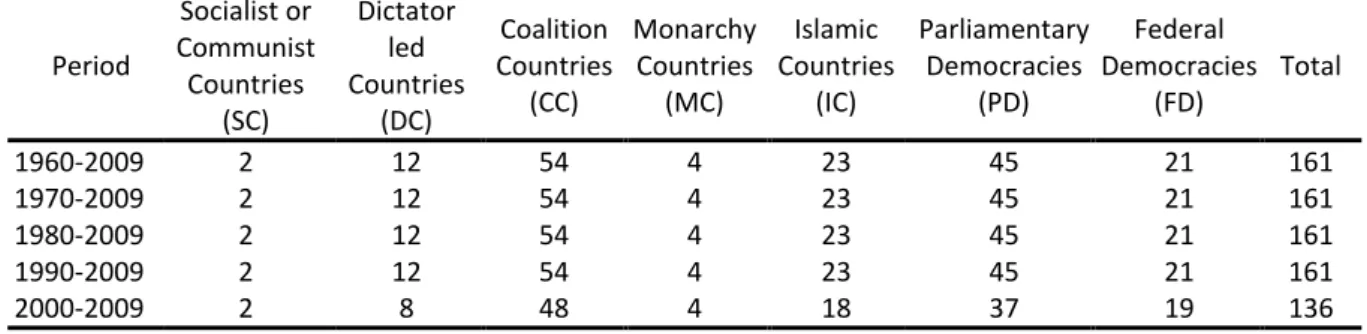
Political governance groupings
We consider seven well acknowledged types of political governance systems; coalition-governments countries (CC), dictator-led countries (DC), federal democracies (FD), Islamic countries (IC), monarchy countries (MC), parliamentary democracies (PD), and socialist/communist countries (SC). In doing so, we are guided by the World Factbook of
CIA4 and Encyclopedia Britannica. Table 4 provides the description of our sample based on
political economy considerations.
Table 4: Sample description for political governance groupings Panel A: Sample frame for political governance groupings
Period Socialist or Communist Countries (SC) Dictator led Countries (DC) Coalition Countries (CC) Monarchy Countries (MC) Islamic Countries (IC) Parliamentary Democracies (PD) Federal Democracies (FD) Total 1960-2009 2 12 54 4 23 45 21 161 1970-2009 2 12 54 4 23 45 21 161 1980-2009 2 12 54 4 23 45 21 161 1990-2009 2 12 54 4 23 45 21 161 2000-2009 2 8 48 4 18 37 19 136
Panel B: Government Debt and GDP Growth in political governance groupings
Countries Observations Countries GDP Growth Government Debt
Mean Median Mean Median
31 620 Coalition Countries (CC) 3.10% 3.24% 66.24 61.59
10 180 Dictator led Countries (DC) 3.85% 4.45% 87.63 69.63
14 280 Federal Democracies (FD) 3.11% 3.36% 54.26 54.83
23 440 Islamic Countries (IC) 4.16% 4.90% 72.76 64.76
4 80 Monarchy Countries (MC) 4.92% 4.86% 40.31 23.61
16 320 Parliamentary Democracies (PD) 3.03% 3.15% 67.81 65.12 2 40 Socialist/Communist Countries (SC) 6.32% 5.75% 36.44 18.74 Total=98 1960
Heavily indebted poor countries (HIPC) are classified according to the World Bank and IMF as part of their debt-relief initiative. These classifications are detailed in the World Economic Situation and Prospects (WESP) 2014 of the United Nations employed to delineate trends in various dimensions of the world economy. Also, refer Handbook on the Least Developed Country Category: Inclusion, Graduation and Special Support Measures (United Nations publication). Available from http://www.un.org/esa/analysis/devplan/cdppublications/2008cdphandbook.pdf
4
The World Factbook of The Central Intelligence Agency of United States provides information on the history, people, government, economy, geography, communications, transportation, military, and transnational issues for 267 world entities. Available at https://www.cia.gov/library/publications/the-world-factbook/
7
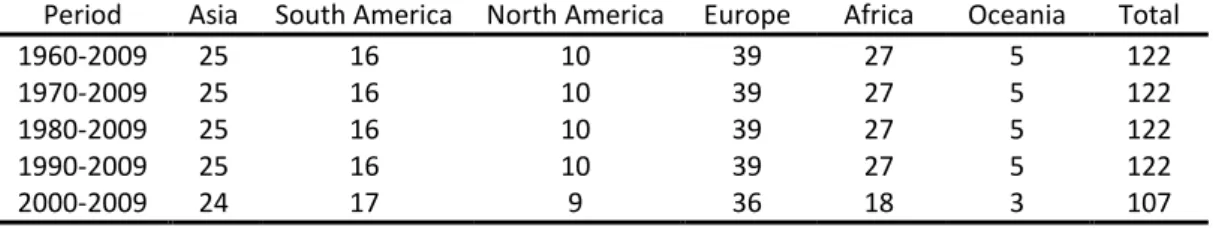
Regional groupings
The fifth of our groupings is based on geographical considerations. We consider six broad classifications - Africa, Asia, Europe, North America, Oceania and South America. In doing so, we follow the classifications detailed in the publication of United Nations Statistics
Division5. Table 5 provides the description of our sample based on regional groupings.
Table 5: Sample description for regional groupings Panel A: Sample frame for regional groupings
Period Asia South America North America Europe Africa Oceania Total
1960-2009 25 16 10 39 27 5 122
1970-2009 25 16 10 39 27 5 122
1980-2009 25 16 10 39 27 5 122
1990-2009 25 16 10 39 27 5 122
2000-2009 24 17 9 36 18 3 107
Panel B: Sample description for regional groupings
Countries Observations Regions GDP Growth Government Debt
Mean Median Mean Median
21 420 Africa 3.35% 3.92% 91.94 80.08 19 380 Asia 4.49% 5.18% 57.36 52.23 34 680 Europe 1.99% 2.92% 55.04 51.47 7 140 North America 3.50% 3.47% 57.45 54.85 4 80 Oceania 2.92% 3.14% 42.39 43.87 15 300 South America 3.66% 3.96% 69.25 45.66 Total=100 2000 Subsampling
We explore the dimension of historical specificity by examining real GDP growth by government debt category for subsampled periods of the data: 1960-2009, 1970-2009, 1980-2009, 1990-1980-2009, and 2000-2009. We do not extend our dataset beyond 1980-2009, in view of the sudden and significant rise in government debt levels consequent to the government interventions in response to global financial crisis6.
5
United Nations Statistics Division - Standard Country and Area Codes Classifications (M49). Details available at http://unstats.un.org/unsd/methods/m49/m49regin.htm
6 In industrial countries, government debt has risen significantly. In 2009, the net sovereign borrowing needs of the United
Kingdom and the United States were five times larger than the average of the preceding five years (2002–07). The huge stimulus and bailout package adopted by the US government to deal with the crisis delivered by irresponsible financial agents in 2009 took the net government debt to GDP ratio in the U.S. from 42.6 in 2007 to 72.4 percent in 2011. In advanced economies as a whole, government debt to GDP ratios are expected to reach 110 percent by 2015—an increase of almost 40 percentage points over pre-crisis levels (IMF 2010). Many middle-income countries also witnessed a deterioration of their debt positions, although the trends are not as dramatic as those of advanced economies are. In low-income countries, in 2009–10 the present value of the government debt to GDP ratio has deteriorated by 5–7 percentage points compared with pre-crisis projections (IDA and IMF 2010).
8
Figure 1: Debt in debt regimes
This figure illustrates the trend of government debt in debt regimes (0-30; 31-60; 61-90; 91-150; 151 and above). We notice a rising trend of debt with a median of 27.79 percent of GDP in DR 0-30. We find a flat trend with a median at 45 in DR 31-60. A decreasing trend is noticed in DR 61-90 with the median level at 82.87. DR 91-150 has a declining trend with a median of116.51. In DR 151 & above, we notice the trend like an inverted crescent shape with a median of 160.99.
0 .0 0 2 0 .0 0 4 0 .0 0 6 0 .0 0 8 0 .0 0 1960 1970 1980 1990 2000 2010 year Debt in DR 0-30 0 .0 0 5 0 .0 0 1 0 0 .0 0 1 5 0 .0 0 2 0 0 .0 0 1990 1995 2000 2005 2010 year Debt in DR 31-60 0 .0 0 5 0 .0 0 1 0 0 .0 0 1 5 0 .0 0 2 0 0 .0 0 1990 1995 2000 2005 2010 year Debt in DR 61-90 0 .0 0 5 0 .0 0 1 0 0 .0 0 1 5 0 .0 0 2 0 0 .0 0 1990 1995 2000 2005 2010 year Debt in DR 91-150 0 .0 0 1 0 0 .0 0 2 0 0 .0 0 3 0 0 .0 0 1990 1995 2000 2005 2010 year Debt in DR 151 above
9
Figure 2: Debt in economy groupings
This figure presents the trend of debt in the economy groupings of sovereign countries. Debt in advanced economies (with a median 53.38) and BRICS economies (46.79) is rising. Developing countries (56.67) and emerging economies (41.35) do not experience a rising trend of debt. However, the trend of debt in OECD countries (51.61) appears to be flat since 1990.
0 50 1 0 0 1 5 0 2 0 0 2 5 0 1990 1995 2000 2005 2010 year
Debt in Advanced Economies
0 .0 0 2 0 .0 0 4 0 .0 0 6 0 .0 0 8 0 .0 0 1 0 0 .0 0 1960 1970 1980 1990 2000 2010 year
Debt in BRICS economies
0 2 0 0 4 0 0 6 0 0 8 0 0 1 0 0 0 1990 1995 2000 2005 2010 year
Debt in Developing Economies
0 2 0 0 3 0 0 30 60 1 0 0 1990 1995 2000 2005 2010 year
Debt in Emerging Economies
0 50 1 0 0 1 5 0 2 0 0 1990 1995 2000 2005 2010 year
10
Figure 3: Debt in income groupings
This figure presents the trend of debt in the income groupings of sovereign countries. Debt in High-income countries (HIC) (with a median 45.89) is very slowly rising. Heavily indebted poor countries (HPC) (103.87) group is experiencing a declining trend. Least developed countries (LDC) (81.39) show a gentle decline since 2005. Low-income countries (LIC) (87.06) show the trend like an inverted crescent shape. Middle-income countries (MIC) (42.73) confirm a mild declining trend.
0 1 0 0 30 50 1 5 0 2 0 0 2 5 0 1990 1995 2000 2005 2010 year Debt in HIC 0 2 0 0 4 0 0 6 0 0 8 0 0 1 0 0 0 1990 1995 2000 2005 2010 year Debt in HPC 0 1 0 0 2 0 0 3 0 0 4 0 0 5 0 0 1990 1995 2000 year 2005 2010 Debt in LDC 0 1 0 0 2 0 0 3 0 0 1990 1995 2000 2005 2010 year Debt in LIC 0 1 0 0 2 0 0 3 0 0 4 0 0 5 0 0 1990 1995 2000 2005 2010 year Debt in MIC
11
Figure 4: Debt in political governance groupings
This figure presents the trend of debt in the political governance groupings of sovereign countries. The trend of debt in coalition countries (CC) (with a median 61.59) is almost flat. Dictator led countries (DC) (69.63) show a declining trend. Federal democracies (FD) (54.83) and parliamentary democracies (PD) (65.12) display almost a plane trend of debt. Islamic countries (IC) (64.76), monarchy countries (MC) (23.61), and socialist/communist countries (SC) (18.74) show a declining trend of debt. 0 1 0 0 2 0 0 3 0 0 50 1990 1995 2000 2005 2010 year Debt in CC 0 1 0 0 2 0 0 3 0 0 4 0 0 5 0 0 1990 1995 2000 2005 2010 year Debt in DC 0 50 1 0 0 1 5 0 1990 1995 2000 2005 2010 year Debt in FD 0 1 0 0 2 0 0 3 0 0 4 0 0 5 0 0 1990 1995 2000 year 2005 2010 Debt in IC 0 50 1 0 0 1 5 0 2 0 0 1990 1995 year 2000 2005 2010 Debt in MC 0 50 1 0 0 1 5 0 1990 1995 year 2000 2005 2010 Debt in PD -5 0 0 50 1 0 0 1 5 0 1990 1995 2000 2005 2010 year Debt in SC
12
Figure 5: Debt in Regional groupings
This figure presents the trend of debt in the regional groupings of sovereign countries based on their geographies. Africa (median 80.08) with higher levels of debt shows a declining trend. Asia (52.23) and Europe (51.47) show a mildly growing trend of debt. The trend of debt in North America (54.85) appears to be flat. Oceania (43.87) with fewer countries shows a smoothly rising trend of debt. South America (45.66) with few of its countries experiencing very high debt levels displays decreasing trend. 0 1 0 0 2 0 0 3 0 0 4 0 0 5 0 0 1990 1995 2000 2005 2010 year Debt in Africa 0 50 1 0 0 1 5 0 2 0 0 1990 1995 2000 2005 2010 year Debt in Asia 0 1 0 0 2 0 0 3 0 0 1990 1995 2000 2005 2010 year Debt in Europe 20 40 60 80 1 0 0 1 2 0 1990 1995 2000 2005 2010 year
Debt in North America
0 20 40 60 80 1990 1995 2000 2005 2010 year Debt in Oceania 0 2 0 0 4 0 0 6 0 0 1 0 0 0 8 0 0 1 0 0 1990 1995 2000 2005 2010 year
13
Variables
We provide in Table 6 the description of variables and data sources.
Table 6: Description of variables and data sources
Variable Description
adr
Age dependency ratio (% of working-age population)
Age dependency ratio is the ratio of dependents--people younger than 15 or older than 64--to the working-age population--those ages 15-64. Data are shown as the proportion of dependents per 100 working-age population. Source: World Development Indicators (WDI)
fce
Final consumption expenditure (% of GDP)
Final consumption expenditure is the sum of household final consumption expenditure (private consumption) and general government final consumption expenditure (general government consumption). Source: WDI
fdi
Foreign direct investment, net inflows (% of GDP)
Foreign direct investments are the net inflows of investment to acquire a lasting management interest (10 percent or more of voting stock) in an enterprise operating in an economy other than that of the investor.
Source: WDI
gdpgr (GDPgrowth)
Real GDP growth (annual %)
Annual percentage growth rate of GDP at market prices based on constant local currency. Source: WDI
gfc
General government final consumption expenditure (annual % growth)
Annual percentage growth of general government final consumption expenditure based on constant local currency. Source: WDI
gfcf
Gross fixed capital formation (annual % growth)
Average annual growth of gross fixed capital formation based on constant local currency. Source: WDI
ggd (debt)
General government gross debt
Gross debt consists of all liabilities that require payment or payments of interest and/or principal by the debtor to the creditor at a date or dates in the future. This includes debt liabilities in the form of SDRs, currency and deposits, debt securities, loans, insurance, pensions and standardized guarantee schemes, and other accounts payable.
Source: World Economic Outlook (WEO) April 2012; Reinhart and Rogoff (RR) data set
infl
Inflation (annual %)
Inflation as measured by the annual growth rate of the GDP implicit deflator shows the rate of price change in the economy as a whole. Source: WDI
pg
Population growth (annual %)
Annual population growth rate for year t is the exponential rate of growth of midyear population from year t-1 to t, expressed as a percentage. Source: WDI
rir
Real interest rate (%)
Real interest rate is the lending interest rate adjusted for inflation as measured by the GDP deflator.
Source: WDI
tgdp (openness) Trade (% of GDP)
Trade is the sum of exports and imports of goods and services measured as a share of gross domestic product. Source: WDI
ulf
Unemployed labour force
Unemployment, total (% of total labor force) (national estimate). Unemployment refers to the share of the labor force that is without work but available for and seeking employment. Definitions of labor force and unemployment differ by country. Source: WDI
3. The Debt – Growth nexus
In economic theory, at moderate levels of government debt, following a typical Keynesian behaviour, fiscal policy may induce growth. The classical economic view is that government debt (manifesting deficit financing) can induce growth by stimulating aggregate
14
demand and output in the short run. Moderate levels of debt are found to have a positive impact on economic growth through a range of channels: improved monetary policy, strengthened institutions, enhanced private savings, and deepened financial intermediation (Abbas and Christensen, 2007). On the other hand, it is argued that government debt crowds
out capital and leads to slowdown of output in the long-run (Elmendorf and Mankiw, 1999).
Historically, the theoretical literature argues that growth models amplified with governments issuing debt to fund consumption or capital goods tend to exhibit a negative relationship
between government debt and economic growth. Modigliani (1961) argues that government
debt is a burden for the posterity that results in waning flow of income from a reduced stock of private capital.
Both the neoclassical and endogenous growth models inform the negative effect of government debt on long-term growth. Government debt could have a substantial adverse
effect on economic outcomes if it affects the productivity of public expenditures (Teles and
Cesar Mussolini, 2014). Analyzing the impact of fiscal policy, proxied inter alia by the level
of government debt, in endogenous growth models, Aizenman et al., (2007) find a negative
relationship. Standard growth theory advocates that an increase in government debt (due to a fiscal deficit) leads to slower growth. On the other hand, the neoclassical growth theory suggests a temporary decline in growth along the transition path to a new steady state. However, the endogenous growth theory suggests a permanent decline in growth as the debt increases (Saint-Paul, 1992).
Government debt could be used to smoothen distortionary taxation over time (Barro,
1979). Barro‘s model predicts that debt responds to the temporary deviation in income or
government expenditure and hence, in the absence of aggregate uncertainty, debt would be constant and equal to its ‗initial‘ level. Though appealing as a normative theory, Barro‘s model is incompatible to two situations: (i) debt to GDP levels in U.S display mean-reversion, which implies the existence of a fundamental long-term level of debt; (ii) evidence from war episodes suggests temporary increases in expenditure are financed with a mix of instruments, including taxes. Expansionary fiscal policies that lead to debt accumulation are
argued to have a positive effect on both short and long-term growth (DeLong and Summers,
2012). In a theoretical model integrating the government budget constraint and debt
15
observe interaction effects between deficits and debt stocks, with high debt stocks exacerbating the adverse consequence of high deficits.
Empirical literature on this topic is yet growing (for e.g. Reinhart and Rogoff, 2010; Kumar and Woo, 2010; Cecchetti et al., 2011; and Baum et al., 2013). Several studies report a negative non-linear correlation between public debt and economic growth in advanced and
emerging market economies (Reinhart and Rogoff, 2010; Reinhart et al., 2012; Kumar and
Woo, 2010; Cecchetti et al., 2011; Checherita-Westphal and Rother, 2012). Though, there is growing evidence that government debt is negatively correlated with economic growth, very few studies make a strong case for a causal relationship going from debt to growth. Some
authors (for e.g. Panizza and Presbitero, 2014) offer a causal interpretation to their findings
and use the debt-growth link as an argument in support of fiscal consolidation. Lof and
Malinen (2014) using data on 20 developed countries, estimate panel vector auto regressions to analyze the relationship between government debt and economic growth and find no evidence for a robust effect of debt on growth, even for higher levels of debt. However, they observe significant negative correlation due to reverse effect of growth on debt. This study intends to provide a thorough analysis based on diverse countries groups and wider dataset.
4. Estimation Strategy
We embark on a multi-step approach to explore our secular dataset covering the period from 1960 to 2009 and thoroughly investigate the nexus between government debt and
growth. We employ both the descriptive statistics approach (as relied by Reinhart and Rogoff
(2010) in their influential paper) and econometric approach to illustrate the debt – growth nexus.
1. Testing the bivariate relationship
In our econometric approach to address the topic, we begin by probing the bivariate linear relationship between debt and growth with the following specification:
j t t j tdebt
GDPgrowth
--- Eqn (1) Where GDPgrowthj tis the annual GDP growth and
debt
jt is the outstanding gross
government debt to GDP ratio for country ‗j‘ in year‗t‘. We estimate the Eqn (1) with a
16
2. Testing the linear relationship
We probe the linear relationship with an econometric specification based on the
empirical growth literature (e.g. Barro and Sala-i-Martin, 2004). We introduce other
significant macroeconomic variables in order to account their simultaneity of impact. In estimating our panel data growth regressions with country-specific and time-specific fixed
effects, we are motivated by Islam (1995), which allows us to estimate the impact of a change
in any one factor on growth within a country in the data panel.
t jt j j t j t j t j t j t j t jt
GDP
debt
gfcf
fce
tgdp
gfc
fdi
GDPgrowth
( j, , , , ) t 1
--- Eqn (2) Where µjis country fixed effects; νt is time fixed effects; εjt is the error term.
3. The augmented Solow growth regression model
We extend our econometric specification using a Solow growth model. Following this model, our specification assumes that the structural growth for country ‗j‘ conforms to a
linear relationship over a period‗t‘ and is common across the panel of countries.
j t jt j t j tX
GDPgrowth
t jt j j t j S j tS
debt
GDPgrowth
^ --- Eqn (3)Where Sj is a vector of Solow regressors including gfcf, gfc, tgdp, fce, fdi, infl, lagged GDP,
pg, and adr. It also includes the constant. µj is country-specific fixed effects; νt is time-fixed
effects; εjt is the unobservable error term. Given the strong potential for endogeneity of the
debt variable, we use instrumental variable (IV) estimation technique. In our instrumental
variables model, we use Solow instruments in their lagged variables. As Easterly and Rebelo
(1993) observe, one of the most likely sources of simultaneity is business cycle effects and the tendency of government expenditure to be positively correlated with the level of GDP per capita. Many studies on growth regressions exploring panel data have made use of IV
approach to deal with the issue of simultaneity bias (see Hiebert et al. 2002). With the use of
GMM estimator, we seek to correct for the possible heteroskedasticity and autocorrelation in the error structure by using the consistent estimator. The two-step GMM provides some efficiency gains over the traditional IV/2-SLS estimator derived from the use of the optimal weighting matrix (Baum et al., 2013).
4. Testing for nonlinearity
In the debt-growth dynamics literature, the nonlinearity of the impact of debt on economic
17
correlations between debt and growth. On the other hand, Kumar and Woo (2012) and Egert
(2015) study the relationship using the growth framework. While many empirical papers identify non-linearities in the relationship between debt and growth, very few studies make a
clear theoretical argument for the presence of such non-linearities (Greiner, 2013).
We investigate the nonlinearity of the debt-growth relationship (in view of the negative correlations at higher levels of debt with growth) by considering a specification that accounts for the polynomial trend of the debt variable. To introduce the smooth transition around a turning point in debt level, in its impact on economic growth, we transform the Eqn (3) to formulate the following specification by introducing a square term of the debt to GDP ratio as an additional regressor:
t jt j j t j S j t j tdebt
debt
S
GDPgrowth
^ 2
--- Eqn (4) Robustness checksIn order to ensure that the outliers do not influence the results, we identify the outliers by drawing the scatterplot of the partial correlation between debt and growth obtained with the IV regression and estimate the models by dropping them. We also employ robust least squares (RLS) regression method designed to be robust, or less sensitive to outliers. We use M-estimation method of RLS. Using the Huber–White sandwich correction, serially correlated residuals are dealt with in the context of the presence of within-country time dependence and heteroscedacity of unknown form. An alternative approach of using the Newey and West estimator that allows modeling the autocorrelation process in the error term is also employed. The method of PCSEs (suggested by Beck and Katz) is very robust when there is little or no correlation between unit effects and explanatory variables. It is argued that its performance declines as the correlation strengthens. We use the fixed effects estimator with robust standard errors that appears to do better in these situations (Kristensen and Wawro, 2003).
5. Results and discussion
We begin our discussion on results with the descriptive statistics approach (as relied by
RR (2010) in their influential paper). In Figure 6.1, we first provide a comparative analysis of the growth in different debt regimes comparable to those of RR. It is interesting to note that as the debt regimes rise there is a decrease in the growth levels. We notice a higher growth (mean 5.06 and median 4.83) in the debt regime of 0-30 percent of GDP and gradually
18
decreasing in subsequent higher debt regimes. Growth levels in terms of both mean (1.86) and median (1.88) are abysmally low in the debt regime of 91-150 percent of GDP. Especially, in very high debt regime of above 151 percent of debt to GDP, the growth is negative (mean -1.08 and median -1.32).
RR observe that the difference in median growth rates of GDP between low debt (below 30 percent of GDP) and high debt (above 90 percent of GDP) groups is 2.6 percentage points in advanced economies over the period. On a similar comparison, we find that for our full sample, the difference in the median growth rates of GDP between low debt regime (below 30 percent of GDP) and high debt regime (91-150 percent of GDP) is 2.95 percentage points. The difference in the median growth rates of GDP between low debt regime (below 30 percent of GDP) and very high debt regime (above 151 percent of GDP) is 6.15 percentage points. RR state that the difference in average growth rates between low and high debt is even larger (4.2 percentage points) for the advanced economies. Our study finds that the difference in average growth rates between low debt (below 30 percent of GDP) and high debt (91-150 percent of GDP) groups is 3.2 percentage points. The difference in average growth rates between low debt (below 30 percent of GDP) and very high debt (above 151 percent of GDP) groups is 6.14 percentage points.
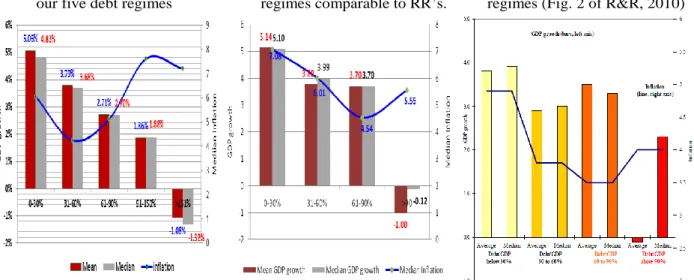
Figure 6: Growth in Debt Regimes
We present in Figure 6.1 the GDP growth and median inflation in the debt regimes comparable to that of RR‘s categories. The number of observations in our sample (in RR sample) in the first four regimes is 160 (443), 620 (442), 400 (199) and 260 (96), for a total of 1440 (1180) observations. Our fifth debt regime of >151% is having 80 observations. In Figure 6.2 we present summary relationship of GDP growth and median inflation in the four groupings out of the full sample comparable to RR‘s four categories. In Fig. 3 we present the RR‘s results.
1. Growth and inflation in 2. Growth and inflation in debt 3. Growth and inflation in RR debt our five debt regimes regimes comparable to RR‘s. regimes (Fig. 2 of R&R, 2010)
19
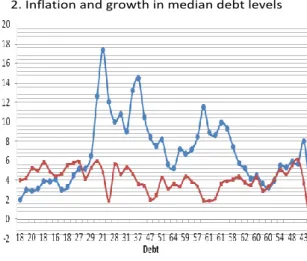
Figure 7: Debt, Inflation and Growth
1. Debt, inflation and growth: 1960–2009 2. Inflation and growth in median debt levels
-10 0 10 20 30 40 50 60 70 80 1960 1964 1968 1972 1976 1980 1984 1988 1992 1996 2000 2004 2008
Debt Inflation GDPgrowth
We find inflation not necessarily influencing high debt levels across countries (Figure
7). The median debt levels have soared particularly during 1980-2000. However, the inflation
levels have not experienced drastic and noticeable rise during the corresponding period. Median inflation and median GDP growth have mostly moved in tandem during the
corresponding debt levels during 1960-2009 (Figure 7.2). The interaction of government debt
with growth in the full sample suggesting the negative relationship is presented in Figure 8.
Figure 8: Government debt and economic growth
-5 0 0 50 1 0 0 10 20 30 G D P g ro w th 050100 200 300 400500 1000 1500 Debt
Government Debt and Economic Growth
We provide in Figure 9, a discrete graphical analysis of the correlation between debt and growth in the debt regimes. In the debt regimes – 0-30%, 31-60% and 61-90%, the GDP growth hovers in the positive level and tends to fall into the negative zone in the debt regime – 91-150%. In the debt regime >151%, the GDP growth runs in the negative zone demonstrating debt intolerance.
20
Figure 9: Government Debt and Growth in debt Regimes
This figure presents the dynamics of government debt and economic growth in debt regimes: 0-30; 31-60; 61-90; 91-150; 151 % above for the period from 1960-2009.
-1 0 -5 0 5 10 15 G ro w th 0 20 40 60 80 Debt 0-30 -2 0 .0 0 -1 0 .0 0 0 .0 0 1 0 .0 0 2 0 .0 0 G ro w th 0.00 50.00 100.00 150.00 200.00 Debt 31-60 -5 .0 0 0 .0 0 5 .0 0 1 0 .0 0 1 5 .0 0 G ro w th 0.00 50.00 100.00 150.00 200.00 Debt 61-90 -4 0 .0 0 -2 0 .0 0 0 .0 0 2 0 .0 0 4 0 .0 0 G ro w th 0.00 50.00 100.00 150.00 200.00 Debt 91-150 -1 5 .0 0 -1 0 .0 0 -5 .0 0 0 .0 0 5 .0 0 1 0 .0 0 G ro w th 0.00 100.00 200.00 300.00 Debt >151% Debt level
21
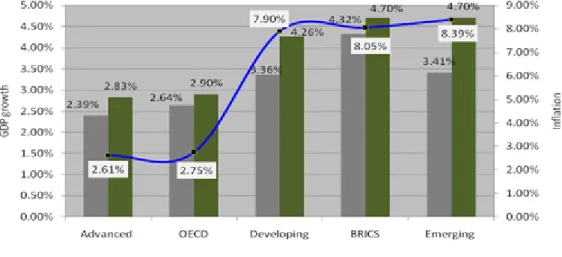
Analysis of inflation–growth nexus in the economy groupings reveals highest growth (mean 4.32 and median 4.70) in BRICS economies with mean debt 46.65 and median debt
46.79 (Figure 10). Further, a higher growth (mean 3.41 and median 4.70) is observed in
emerging economies with (mean debt 43.73 and median debt 41.35). Developing economies experience average growth 3.36% (median growth 4.26%) with mean debt level 71.63 (median debt 56.67). OECD economies experience average growth 2.64% (median growth 2.90%) with mean debt level 55.17 (median debt 51.61). We notice advanced economies experiencing average growth 2.39% (median growth 2.83%) with mean debt 57.12 (median debt 53.38).
Figure 10: Inflation and Growth in Economy groupings
We notice that the difference in median growth rates of GDP between low debt group (emerging economies) and high debt group (advanced economies) is 1.87 percentage points. On a similar comparison, the difference in the median growth rates of GDP between emerging economies and BRICS economies is 0.01, between emerging economies and OECD economies, it is 1.81, and between emerging economies and developing economies it is 0.45 percentage points.
We present our analysis of the correlation between debt and growth in our five broad
economy groupings more discretely in Figure 11. Advanced and OECD economies
experience growth that shows positive correlation in contrast to the negative correlation observed in developing and emerging economies. BRICs economies exhibit unique behaviour and need greater attention for analysis.
22
Figure 11: Government debt and growth in economy groups
This figure presents the dynamics of government debt and economic growth in economy groupings: advanced countries, BRICS, developing countries, emerging countries, and OECD countries during the period 1960-2009.
-4 0 -3 0 -2 0 -1 0 0 10 G ro w th 0 50 100 150 200 250 Debt Advanced Countries -2 0 -1 0 0 10 20 G ro w th 0 20 40 60 80 100 Debt BRICS Countries -6 0 .0 0 -4 0 .0 0 -2 0 .0 0 0 .0 0 2 0 .0 0 4 0 .0 0 G ro w th 0.00 200.00 400.00 600.00 800.00 1000.00 Debt Developing Countries -2 0 .0 0 -1 0 .0 0 0 .0 0 1 0 .0 0 2 0 .0 0 G ro w th 0.00 100.00 200.00 300.00 Debt Emerging Countries -1 5 -1 0 -5 0 5 10 G ro w th 0 50 100 150 200 Debt OECD countries
23
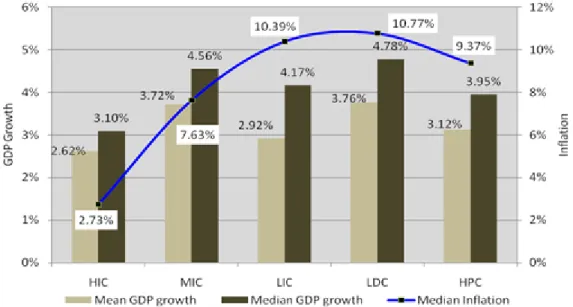
Analysis of inflation–growth nexus in the Income groupings is provided in Figure 12.
We notice highest growth (mean 3.76 and median 4.78) in LDC group (mean debt 100.86 and median debt 81.39) associated with a median inflation of 10.77. Further, higher growth (mean 3.72 and median 4.56) is observed in MIC group (mean debt 52.17 and median debt 42.73) associated with a median inflation of 7.63. HPC group experiences average growth 3.12% (median growth 3.95%) with mean debt 124.10 (median debt 103.87) and median inflation 9.37%. LIC group experiences average growth 2.92% (median growth 4.17%) with mean debt 91.37 (median debt 87.06). We notice HIC group experiencing average growth 2.62% (median growth 3.10%) with mean debt 49.99 (median debt 45.89) and median inflation 2.73%. The difference in median growth rates of GDP between low debt group (HIC) and high debt group (HPC) is 0.85 percentage point. Median inflation for the different debt groupings based on incomes suggests an apparent pattern – inflation levels move upward from high-income countries to low income countries.
Figure 12: Inflation and Growth in Income groupings
We illustrate in Figure 13, the interplay between debt and growth in our income
groupings. HIC and LDC groups experience growth that hovers much in the positive levels in contrast to that in LIC and HPC groups where the growth tends to slide into the negative zone demonstrating the debt intolerance as they go through high debt levels. LDC group displays a distinct behaviour, which deserves in depth analysis.
24
Figure 13: Government debt and growth in income groups
This figure presents the dynamics of government debt and economic growth in income groupings: high-income countries (HIC), highly indebted poor countries (HPC), least developed countries (LDC), low-income countries (LIC), and middle-income countries (MIC) during the period 1960-2009.
-3 0 .0 0 -2 0 .0 0 -1 0 .0 0 0 .0 0 1 0 .0 0 2 0 .0 0 G R O W T H 0.00 50.00 100.00 150.00 200.00 250.00 DEBT HIC -6 0 -4 0 -2 0 0 20 40 G ro w th 0 200 400 600 800 1000 DEBT HPC -6 0 -4 0 -2 0 0 20 40 G ro w th 0 100 200 300 400 500 DEBT LDC -6 0 -4 0 -2 0 0 20 40 G ro w th 0 100 200 300 DEBT LIC -4 0 -2 0 0 20 40 G ro w th 0 100 200 300 400 500 DEBT MIC
25
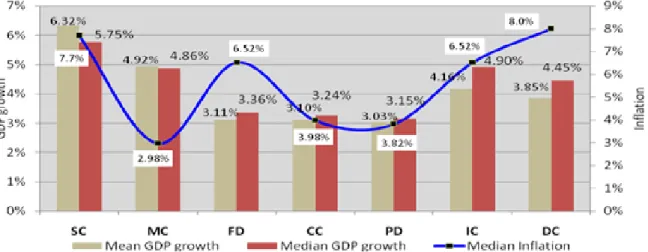
Figure 14 illustrates the interesting facts of the dynamics of government debt, inflation and growth in different political economies. Socialist/communist (SC) countries with highest growth rates (mean 6.32 and median 5.75) and lowest debt level (mean debt 36.44 and median 18.74) among the compared categories experience median inflation of 7.7 percent. On the contrary, parliamentary democracies (PD) experience lowest growth rate (mean 3.03 and 3.15) with mean debt 67.81 (median debt 65.12) are associated with lowest median inflation of 3.82 percent. Monarchy countries (MC) experience lowest debt level (mean debt 40.31 and median debt 23.61) experience mean GDP growth 4.92 (median 4.86) and lowest median inflation 2.98 percent. In contrast, dictatorship countries (DC) experience highest debt level (mean debt 87.63 and median debt 69.63) with mean growth 3.85 (median 4.45) and highest median inflation 8 percent. Apparently, we do not notice a specific pattern.
Figure 14: Debt, Inflation and Growth in Political governance groupings
Islamic countries (IC) experience average growth 4.16% (median growth 4.90%) with mean debt 72.76 (median debt 64.76) and median inflation 6.52%. Coalition-governments countries (CC) with median inflation 3.98% are found to be associated with mean debt 66.24 (median debt 61.59) and mean growth rate 3.10% (median growth 3.24%). Federal democracies (FD) experience average growth 3.11% (median growth 3.36%) with mean debt 54.26 (median debt 54.83) associated with median inflation of 6.52%. The difference in median growth rates of SC (low debt group) and DC (high debt group) is 1.3-percentage point. We provide in Figure 15, the correlation between debt and growth in the political governance based groupings in detail. DC, MC, SC and IC political economies experience growth that hovers much in the positive levels in contrast to that in PD, CC and FD political economies where the growth tends to glide into the negative zone indicating debt intolerance as they go through higher debt/GDP levels.
26
Figure 15: Government debt and growth in political governance groupings
This figure presents the dynamics of government debt and economic growth in political governance groupings: Islamic countries (IC); coalition countries (CC); dictator led countries (DC); federal democracies (FD); monarchy countries (MC); parliamentary democracies (PD); and socialist countries (SC) during the period 1960-2009.
-4 0 -2 0 0 20 40 G ro w t h 0 100 200 300 400 500 DEBT IC -2 0 . 0 0 -1 0 . 0 0 0 .0 0 1 0 . 0 0 G ro w th 0.00 100.00 200.00 300.00 DEBT CC -6 0 -4 0 -2 0 0 20 40 G ro w th 0 100 200 300 400 500 DEBT DC -1 0 0 10 20 G ro w th 0 50 100 150 DEBT FD -5 .0 0 0 .0 0 5 .0 0 1 0 . 0 0 1 5 . 0 0 2 0 . 0 0 G ro w th 0.00 50.00 100.00100.00 150.00 200.00 DEBT MC -1 0 -5 0 5 10 G ro w th 0 50 100 150 DEBT PD -5 .0 0 0 .0 0 5 .0 0 1 0 . 0 0 1 5 . 0 0 G ro w th 0.00 50.00 100.00 150.00 DEBT SC
27
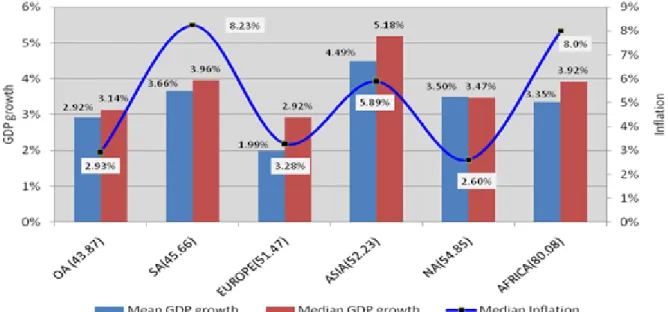
Figure 16 illustrates the dynamics of government debt, inflation and growth in different regional economies. Asia with highest mean growth rate 4.49 (median 5.18) and mean debt 57.36 (median 52.23) experiences median inflation 5.89 percent. On the contrary, Europe experiences lowest mean growth rate 1.99 (median 2.92) with mean debt 55.04 (median debt 51.47) and median inflation 3.28 percent. Oceania with lowest debt level (mean debt 42.39 and median debt 43.87) experiences mean growth 2.92 (median 3.14) and lowest median inflation 2.93 percent. On the contrary, Africa with highest debt level (mean debt 91.94 and median debt 80.08) experience mean growth 3.35 (median 3.92) and median inflation of 8 percent.
Figure 16: Inflation and growth in regional groupings
South America (SA) experiences average growth 3.66 (median growth 3.96) with mean debt 49.25 (median debt 45.66) and highest median inflation 8.23 percent. On the contrary, North America (NA) with lowest median inflation 2.60 experiences a mean growth 3.50 (median growth 3.47) associated with mean debt 57.45 (median debt 54.85). The difference in median growth rates of GDP between OA (low debt group) and Africa (high debt group) is 0.78 percentage point.
We provide in Figure 17, the correlation between debt and growth in regional
groupings. Oceania and North America experience growth that hovers much in the positive levels in contrast to that in Asia, Africa, Europe and south America where the growth tends to drift smoothly into the negative zone demonstrating the negative correlation as they experience higher debt levels.
28
Figure 17: Government debt and growth in regional groupings
This figure presents the dynamics of government debt and economic growth in regional groupings: Africa, Asia, Europe, North America, Oceania, and South America during the period 1960-2009.
-6 0 .0 0 -4 0 .0 0 -2 0 .0 0 0 .0 0 2 0 .0 0 4 0 .0 0 G ro w th 0.00 100.00 200.00 300.00 400.00 500.00 DEBT AFRICA -3 0 -2 0 -1 0 0 10 20 G ro w th 0 50 100 150 200 DEBT ASIA -3 0 .0 0 -2 0 .0 0 -1 0 .0 0 0 .0 0 1 0 .0 0 G ro w th 0.00 100.00 200.00 300.00 DEBT EUROPE -5 .0 0 0 .0 0 5 .0 0 1 0 .0 0 1 5 .0 0 G ro w th 20.00 40.00 60.00 80.00 100.00 120.00 DEBT NORTH AMERICA -5 0 5 10 15 20 G ro w th 0 20 40 60 80 DEBT OCEANIA -1 0 .0 0 -5 .0 0 0 .0 0 5 .0 0 1 0 .0 0 1 5 .0 0 G ro w th 0.00 200.00 400.00 600.00 800.00 1000.00 DEBT SOUTH AMERICA
29
Table 7: Government debt and Economic Growth - Regression Results
This table presents the results of the regressions for understanding the effect of debt on the long-term growth of countries. Our dependent variable is the GDP growth. Columns (1), (2) and (5) present the results of the Panel Least Squares (PLS). Columns (3) and (6) present the results of the Panel Generalized Method of Moments (PGMM) (Cross-section weights (PCSE) standard errors & covariance). Columns (4), (5) and (7) present the results of Robust Least Squares. We report the coefficient values marked with significance levels in the first row followed by the standard errors (in the parenthesis) in the second row. Asterisks ***, ** indicate levels of significance at 1%, and 5% respectively.
Dep. Variable: GDP growth (1) (2) (3) (4) (5) (6) (7)
Mean (Std. Dev.)
Eqn. (2) Eqn. (2) PLS Eqn. (3) PGMM Eqn. (3) RLS Eqn. (4) PLS Eqn. (4) PGMM Eqn. (4) RLS
Explanatory Variables Linear models Non-linear models
General government gross debt (Debt) 56.11 (56.46) -0.014*** -0.003* -0.003* -0.002*** -0.013*** -0.023*** -0.0079*** (0.002) (0.002) (0.002) (0.001) (0.004) (0.005) (0.0025) Debt Sq. 3912 (31139) 0.0000178 0.0000466** 1.24E-05** (0.0000166) (0.0000210) (1.06E-05) GDPGR(-1) 3.85 (5.49) 0.218*** 0.218*** 0.261*** 0.306*** 0.189*** 0.249*** (0.018) (0.029) (0.011) (0.018) (0.028) (0.011)
Gross fixed capital formation 5.85 (42.10) 0.015*** 0.015*** 0.181*** 0.014*** 0.015*** 0.181*** (0.002) (0.004) (0.001) (0.002) (0.004) (0.0009) Government expenditure 4.66 (18.54) 0.013*** 0.013** 0.015*** 0.040*** 0.033*** 0.017*** (0.003) (0.005) (0.002) (0.006) (0.008) (0.003) Trade Openness 72.89 (51.74) 0.001 0.001 0.005*** 0.002 0.004 0.005 (0.005) (0.005) (0.001) (0.002) (0.005) (0.001) Final consumption expenditure 81.24 (13.71) -0.069*** -0.069*** -0.012*** -0.019*** -0.063*** -0.011*** (0.014) (0.016) (0.004) (0.006) (0.016) (0.004)
Foreign direct investment 2.73 (4.62) 0.061*** 0.059*** -0.003 0.063*** 0.053** -0.0019** (0.020) (0.022) (0.011) (0.018) (0.021) (0.0114) Population growth 1.69 (1.22) 0.198*** 0.292*** 0.126 0.223 (0.042) (0.067) (0.218) (0.042) Inflation 45.13 (552.47) -0.0001* -0.0003*** -0.0003** -0.00075** (0.0001) (0.0001) 0.0001 (7.41E-05) Intercept 4.682*** 8.128*** 8.140*** 2.259*** 3.732*** 8.197*** 2.468*** (0.109) (1.254) (1.389) (0.341) (0.544) (1.526) (0.346) R-squared 0.179 0.293 0.292 0.350 0.219 0.308 0.35545 Obs 3607 2643 2640 2640 2621 2621 2621
30
Figure 18: Gross fixed capital formation as a causal link that goes through debt to growth as an instrumental variable
We present in the figures below the relationship between debt, gross fixed capital formation and economic growth. The first figure illustrates the association of gross fixed capital formation (GFCF) with debt. The second figure captures the relationship between GFCF and GDP growth that is similar to the relationship of debt with growth. The third figure presents the association of debt with GFCF and GDP growth. As debt increases, growth as well as GFCF decrease indicating a nonlinear relationship. -3 0 0 -2 0 0 -1 0 0 0 1 0 0 2 0 0 G F C F 0 500 1000 1500 Debt
Debt and gross fixed capital formation
-4 0 -2 0 0 20 40 G D P g ro w th -200 -100 0 100 200 GFCF
Gross fixed capital formation and economic growth
-1 0 0 10 20 0 500 1000 1500 Debt predicted gdpgr predicted gfcf
31
We now discuss the results of the econometric analysis of the debt-growth relationship encompassing the econometric specifications for (a) testing the bivariate relationship as modeled in Eqn. (2); (b) testing the linear relationship as modeled in Eqn. (3); (c) testing the augmented Solow growth model in Eqn. (4); and (d) testing for nonlinearity as modeled in Eqn. (5). Table 7 presents the results of the analyses. As observed in other studies as well, simple bivariate panel regression reveals a negative relation between growth and government debt. Though the coefficient is always negative, its size is mostly not substantial in economic terms. The results of the linear specifications suggest econometrically significant negative association of debt with growth. As we analyse the nonlinear models, the econometric significance as well as the coefficient value increase for debt in its relationship with economic growth.
We notice the causal link going from debt to growth through the instrumental variable – gross fixed capital formation (GFCF). The results of panel GMM regressions with IV approach suggest the significant role of GFCF in causing the relationship between debt and economic growth. Figure 18 further illustrates the intricate relationship. As debt increases, GDP growth as well as GFCF decrease indicating a nonlinear relationship.
The point estimates of the range of econometric specifications suggest that a 10-percentage point increase in the debt-to-GDP ratio is associated with 2 to 23 basis points
reduction of average growth. Our results are comparable to the estimates of Kumar and Woo
(2010) and Égert Balázs (2015) for advanced and emerging economies over almost four
decades7. Studying a sample of 17 OECD countries, Panizza and Presbitero (2014) observe
that a 10-percentage point increase in the debt-to-GDP ratio is associated with an 18 basis point decline in average growth.
Conclusion
This study has presented a thorough analysis of the dynamics of government debt and economic growth as it spans across regions, political economies, diverse economies, varied income groupings and different debt regimes. The sources on which the study draws are more authentic and well accepted. We do not claim that the results are infallible, but do state that
7
Kumar and Woo (2010) report that on average, a 10 percentage point increase in the initial debt-to-GDP ratio is associated with a slowdown in annual real per capita GDP growth of around 0.2 percentage points per year. Égert Balázs (2015) report that 10 percentage increase in the government debt ratio is associated with 0.1 to 0.2 percentage point lower economic growth.
32
they are based on widely accepted econometric tools and techniques besides based on sound economic logic. One of the contributions of this study is that it is the first of its kind in providing a meticulous analysis of debt and growth in different of groupings and sub-groupings of countries spanning across time period since 1960. The study enhances our understanding of the long-term dynamics of debt and economic growth in diverse economic environments and periods of recent history of economic activity. The study provides an original analysis of the debt and growth beyond the popular discourse mostly surrounding the advanced countries.
Debt in advanced and BRICS economies is rising steadily. Advanced economies, as they maintain higher levels of debt, they experience lower rate of economic growth. On the other hand, emerging economies with lowest debt level experience higher rate of growth. Interestingly, BRICS countries as a distinct group experience highest rate of economic growth in spite of having moderate levels of debt. Economy groupings analysis does not provide any apparent pattern of the debt–growth relationship across the groups emphasising the existence of non-linear nature of relationship.
Heavily indebted poor countries with very high debt levels experience moderate economic growth. On the contrary, middle-income countries with lower levels of debt experience higher rate of economic growth. Coalition countries and federal democracies maintain higher level of debt and experience a moderate rate of economic growth. One immediate inference could be that due to the intricate dynamics of coalition politics and issues related to states and union, these countries suffer from lack of robust economic policies in relation to debt and growth. Perhaps the divergent political forces and philosophies fail to converge for a sound policy approach for debt management towards achieving higher economic growth. Inspite of having higher level of debt, dictator-led countries experience higher rate of growth. Similar is the case with Islamic countries. Perhaps due to the long-standing dictatorial rulers and political stability in these countries, economic growth has been higher in spite of higher levels of government debt. One important take away is that parliamentary democracies in spite of having higher debt levels than that of coalition countries and federal democracies, have failed to achieve higher rate of economic growth than that of these countries. Socialist/communist countries and monarchy countries are found to experience very high rate of economic growth as they maintain lower levels of government debt.
33
This study provides a clear understanding about the triad – debt, inflation and growth in the case of economy groupings. Emerging economies, developing economies and BRICS countries are found to experience higher levels of economic growth in spite of having higher levels of inflation. On the contrary, lower rate of economic growth in advanced and OECD economies is associated with lower levels of inflation. The analysis of income groupings suggests an apparent pattern – inflation levels move upward from high–income countries to low income countries. One interesting observation is that Islamic countries with highest level of inflation have highest debt level. In line with the same logic, monarchy countries that experience lowest inflation have lowest debt level. Amongst regional groupings, Africa with highest debt level is associated with high level of inflation. Oceania with lowest debt level is associated with low inflation. Thus, rising debt levels are positively associated with increasing levels of inflation.
To conclude, this study observes a negative relationship between government debt and growth. The point estimates of the range of econometric specifications suggest that a 10-percentage point increase in the debt-to-GDP ratio is associated with 2 to 23 basis point reduction in average growth. Our results establish the nonlinear relationship between debt and growth.
References:
Abbas S M Ali, and Christensen, Jakob. (2007). The Role of Domestic Debt Markets in Economic Growth: An Empirical Investigation for Low-Income Countries and Emerging Markets. IMF Working Paper No. 07/127
Adam C S and Bevan D L. (2005). Fiscal deficits and growth in developing countries. Journal of Public Economics 4: 571-597.
Aizenman J, Kletzer K and Pinto B. (2007). Economic growth with constraints on tax revenues and public debt: implications for fiscal policy and cross-country differences. NBER Working Paper 12750
Baum Anja, Checherita Cristina-Westphal and Rother Philipp. (2013). Debt and growth:
New evidence for the euro area. Journal of International Money and Finance 32: 809–
821
Barro R J. (1979). On the determination of the public debt. The Journal of Political Economy
87 (5): 940–971.
Barro R and X Sala-i-Martin. (2004). Economic growth, second edition, MIT Press
Blanchard Olivier J and Summers Lawrence H. (1984). Perspectives on High World Real
Interest Rates. Brookings Papers on Economic Activity 2: 273-334.
34
debt on economic growth and its channels: An empirical investigation for the euro area.
European Economic Review 56: 1392–1405
Cecchetti Stephen, Madhusudan Mohanty and Fabrizio Zampolli. (2011). The real effects of debt. BIS Working Papers No. 352, Bank for International Settlements.
Egert Balazs. (2015). Public debt, economic growth and nonlinear effects: Myth or reality?
Journal of Macroeconomics 43: 226–238
Elmendorf Douglas W and Gregory Mankiw N. (1999). Government Debt. In (J. B. Taylor
& M. Woodford (ed.)) Handbook of Macroeconomics 1(3): 1615-1669.
Easterly W and Rebelo S. (1993). Fiscal Policy and Economic Growth: An Empirical
Investigation. Journal of Monetary Economics 32(3): 417-58.
Greiner Alfred. (2013). Debt and Growth: Is there a non-monotonic relation? Economics
Bulletin 33 (1): 340-347
Hansen B E. (1999). Threshold effects in non-dynamic panels: estimation, testing and
inference. Journal of Econometrics 93 (2): 345–368.
Herndon T, Ash M, Pollin R. (2014). Does high public debt consistently stifle economic
growth? A critique of Reinhart and Rogoff. Cambridge Journal of Economics 38(2):
257–279.
Islam N. (1995). Growth empirics: a panel data approach. Quarterly Journal of Economics
110: 1127–70.
Kourtellos A, Stengos T and Tan C M. (2013). The effect of public debt on growth in
multiple regimes. Journal of Macroeconomics 38: 35–43.
Kristensen Ida Pagter and Wawro Gregory. (2003). Lagging the Dog? The Robustness of Panel Corrected Standard Errors in the Presence of Serial Correlation and Observation Specific Effects. Working Paper No. 54. Washington University in St. Louis. Extracted from http://polmeth.wustl.edu/mediaDetail.php?docId=54
Krugman, Paul (2010). ―Reinhart and Rogoff Are Confusing Me.‖ New York Times, 11 August.
Kumar Manmohan S and Jaejoon Woo. (2010). "Public Debt and Growth", IMF Working Papers, No. 10/174, International Monetary Fund
Lof Matthijs and Malinen Tuomas. (2014). Does sovereign debt weaken economic growth? A
Panel VAR analysis. Economic Letters 122(3): 403–407
Modigliani F. (1961). Long-Run Implications of Alternative Fiscal Policies and the Burden
of the National Debt. Economic Journal 71 (284): 730-755.
Panizza Ugo and Presbitero Andrea F. (2014). Public debt and economic growth: Is there a
causal effect? Journal of Macroeconomics 41: 21–41
Reinhart Carmen M and Kenneth S Rogoff. (2010a). ―Debt and Growth Revisited", VoxEU.org, 11August.
Reinhart Carmen M and Kenneth Rogoff S. (2010b). Growth in a Time of Debt. American
Economic Review: Papers and Proceedings 100(2): 573-578.
Reinhart Carmen M, Vincent R Reinhart and Kenneth S Rogoff (2012). Public debt
overhangs: Advanced economy episodes since 1800. Journal of Economic Perspectives
26(3): 6986.
Saint Paul (1992). Fiscal Policy in an Endogenous Growth Model. Quarterly Journal of
Economics 107(4): 1243–59.
Teles V K and Cesar Mussolini C. (2014). Public debt and the limits of fiscal policy to
35
Appendices
Annexure 1: Countries covered in Debt Regime groupings
1 DR 0-30 (21)
Azerbaijan, Bahrain, Botswana, Chile, China, Colombia, Congo, Rep., Czech Republic, Estonia, Finland, Germany, Guatemala, Kazakhstan, Latvia, Namibia, Norway, Oman, Paraguay, Romania, Slovenia, and Thailand.
2 DR 31-60 (31)
Argentina, Austria, Brazil, Canada, Denmark, Dominican Republic, Ecuador, El Salvador, France, Ghana, Iceland, India, Indonesia, Japan, Kenya, Malaysia, Mexico, Netherlands, New Zealand, Peru, Philippines, Portugal, South Africa, Spain, Sweden, Tunisia, Turkey, United Kingdom, United States, Uruguay, and Venezuela, RB.
3 DR 61-90 (22) Algeria, Bolivia, Costa Rica, Cote d'Ivoire, Egypt, Arab Rep., Egypt, Arab Rep.,
Greece, Ireland, Panama, and Singapore.
4 DR 91-150 (8) Belgium, Burundi, Central African Republic, Honduras, Italy, Jamaica, Jordan,
Kyrgyz Republic, Madagascar, Nigeria, Seychelles, Sri Lanka, and Tajikistan.
5 DR 151 and above (5) Congo, Dem. Rep., Cyprus, Malta, Nicaragua, and Zambia
Annexure 2: Countries covered in Economy groupings
1 Advanced Countries
(27)
Australia, Austria, Belgium, Canada, Cyprus, Denmark, Finland, France, Germany, Greece, Hong Kong, Iceland, Ireland, Italy, Japan, Korea, Malta, Netherlands, New Zealand, Norway, Portugal, Slovenia, Spain, Sweden, Switzerland, United Kingdom, and United States.
2 BRICS (5) Brazil, Russia, India, China, and South Africa
3 Developing Countries
(57)
Albania, Argentina, Azerbaijan, Bahamas, Belize, Bolivia, Bulgaria, Burundi, Cameroon, China, Colombia, Congo, Congo Rep, Costa Rica, Cote d'Ivoire, Dominican Republic, Ecuador, Egypt, Guatemala, Honduras, India, Indonesia, Jordan, Kazakhstan, Kenya, Kyrgyz Republic, Lesotho, Madagascar, Malaysia, Mauritius, Mexico, Moldova, Morocco, Namibia, Nicaragua, Pakistan, Panama, Papua New Guinea, Paraguay, Peru, Philippines, Romania, Russian Federation, Rwanda, Sierra Leone, South Africa, Sri Lanka, Sudan, Tajikistan, Thailand, Trinidad and Tobago, Tunisia, Uganda, Ukraine, Uruguay, Venezuela, and Zambia
4 Emerging economies
(21)
Argentina, Brazil, Bulgaria, Chile, China, Colombia, India, Indonesia, Lithuania, Malaysia, Mexico, Peru, Philippines, Poland, Romania, Russian Federation, South Africa, Thailand, Turkey, Ukraine, and Venezuela.
5 OECD Countries (33)
Algeria, Australia, Austria, Belgium, Canada, Chile, Czech Republic, Denmark, Estonia, Finland, France, Germany, Greece, Iceland, Ireland, Italy, Japan, Korea, Luxembourg, Mexico, Netherlands, New Zealand, Norway, Poland, Portugal, Slovak Republic, Slovenia, Spain, Sweden, Switzerland, Turkey, United Kingdom, and United States.