PAL: Propagation-aware Anomaly Localization for Cloud
Hosted Distributed Applications
Hiep Nguyen, Yongmin Tan, Xiaohui Gu
North Carolina State University
{hcnguye3,ytan2}@ncsu.edu, [email protected]
ABSTRACT
Distributed applications running inside cloud are prone to performance anomalies due to various reasons such as insuf-ficient resource allocations, unexpected workload increases, or software bugs. However, those applications often consist of multiple interacting components where one component anomaly may cause its dependent components to exhibit anomalous behavior as well. It is challenging to identify the faulty components among numerous distributed application components. In this paper, we present a Propagation-aware Anomaly Localization (PAL) system that can pinpoint the source faulty components in distributed applications by ex-tracting anomaly propagation patterns. PAL provides a robust critical change point discovery algorithm to accu-rately capture the onset of anomaly symptoms at different application components. We then derive the propagation pattern by sorting all critical change points in chronologi-cal order. PAL is completely application-agnostic and non-intrusive, which only relies on system-level metrics. We have implemented PAL on top of the Xen platform and tested it on a production cloud computing infrastructure using the RUBiS online auction benchmark application and the IBM System S data streaming processing application with a range of common software bugs. Our experimental results show that PAL can pinpoint faulty components in distributed applications with high accuracy and low overhead.
Categories and Subject Descriptors
C.4 [Performance of Systems]: Reliability, availability, and serviceability
General Terms
Reliability, Management, Experimentation
Keywords
Anomaly propagation, Fault Localization, Cloud Comput-ing
Permission to make digital or hard copies of all or part of this work for personal or classroom use is granted without fee provided that copies are not made or distributed for profit or commercial advantage and that copies bear this notice and the full citation on the first page. To copy otherwise, to republish, to post on servers or to redistribute to lists, requires prior specific permission and/or a fee.
SLAML 2011, October 23, 2011, Cascais, Portugal
Copyright @ 2011 ACM 978-1-4503-0978-3/11/10 ...$10.00.
1.
INTRODUCTION
Cloud computing allows application service providers to run their applications in a cost-effective way by obviating the need to own and maintain a physical computing infrastruc-ture. However, applications running inside cloud are often prone to various performance anomalies (e.g., SLO viola-tions) due to various reasons such as insufficient resource al-location, unexpected workload increase, and software bugs. It is challenging to diagnose the performance anomaly appearing in distributed application running inside cloud. The application often appears as a black box to the cloud service provider. It is very difficult to apply the previous white box or grey box diagnosis techniques [9, 13] that need modifications or instrumentations to application or under-lying systems (e.g., middleware platform). Additionally, many subtle software bugs only manifest during large-scale runs, which makes it difficult for application developers to perform in-house debugging since they often do not have the infrastructure or workload to reproduce the anomaly.
Recent work [15, 16, 17, 25, 26, 27] has shown that it is promising to apply statistical learning methods over system-level metrics (e.g., CPU, memory, network I/O) to achieve online anomaly detection and causal path inference. How-ever, those approaches typically either treat the whole dis-tributed application as one black box or examine each indi-vidual component separately. The former cannot localize faulty components in a distributed application while the latter tends to produce false alarms since system-level metric anomaly often propagates among dependent components.
In this paper, we present PAL, a novel propagation-aware anomaly localization system for cloud hosted distributed applications. PAL employs a robust change point detection algorithm over system-level metrics to identify the onset of anomalous behavior in different distributed application com-ponents. PAL then arranges the discovered change points in chronological order to infer the anomaly propagation pat-tern. We can then use the anomaly propagation pattern to pinpoint faulty components. PAL is completely application-agnostic without assuming any prior knowledge about the application including the application topology. PAL is non-intrusive, which does not require any modification to the application, and only relies on low-level system metrics that can be easily acquired via hypervisor or OS.
System-level metrics are often inherently fluctuating due to the dynamic nature of real world applications. Thus, the key challenge is how to distinguish the critical change point that marks the beginning of the anomalous behavior from many change points that just reflect normal workload
fluctuations. To address this challenge, we provide a robust critical change point detection algorithm that can accurately identify the onset of the anomalous behavior in system-level metrics. Specifically, this paper makes the following contributions:
• We present PAL, a non-intrusive propagation-aware anomaly localization system for troubleshooting dis-tributed applications running inside cloud.
• We provide a robust change point discovery algorithm to extract runtime anomaly propagation patterns for pinpointing faulty components. Our pinpointing re-sults can provide useful guidance for subsequent anomaly correction tasks.
• We have implemented PAL on top of the Xen plat-form and tested it on the NCSU’s Virtual Computing Lab [5], a production cloud computing system that operates in a similar way as Amazon EC2 [1]. We used the RUBiS online auction benchmark application [4] and the IBM System S data stream processing sys-tem [18] running inside VCL and injected a range of common software bugs to evaluate the accuracy of our anomaly localization algorithm.
• Our experimental results show that PAL can identify the faulty component in distributed applications with high accuracy. PAL is light-weight, imposes negligible overhead during normal application execution. The rest of the paper is organized as follows. Section 2 describes our system design. Section 3 presents our experi-mental evaluation. Section 4 compares our work with other related works. Section 5 discusses the limitations of the PAL system and possible extensions. Finally, the paper concludes in Section 6.
2.
SYSTEM DESIGN
In this section, we first present an overview of the PAL system. We then describe the anomaly onset identifica-tion algorithm and the propagaidentifica-tion-based fault localizaidentifica-tion scheme.
2.1
Approach Overview
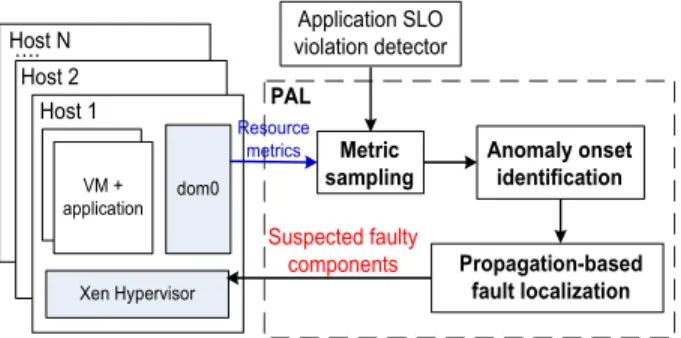
Figure 1 shows the overall architecture of the PAL system. It consists of three system modules: 1) non-intrusive virtual machine (VM) resource monitoring, 2) anomaly onset iden-tification, and 3) propagation-based fault localization.
The PAL system continuously monitors various system-level metrics (e.g. CPU usage, free memory, network traffic) of distributed application components running inside dif-ferent guest VMs with a certain sampling interval (e.g. 1 second). PAL adopts a non-intrusive monitoring approach that collects guest VM information from outside. In addition to monitoring resource metrics, PAL also needs an orthog-onal monitoring module to detect whether the application is experiencing SLO violations. PAL can rely on either the application itself or an external monitoring tool to keep track of the application SLO status. Our current prototype adopts the latter method.
Upon detecting an application SLO violation, PAL per-forms the anomaly onset identification to capture the start time of the anomalous behavior in any system-level metric of
dom0 Xen Hypervisor Host 1 Resource metrics VM + application Host 2
Host N. violation detectorApplication SLO
PAL Propagation-based fault localization Anomaly onset identification Metric sampling Suspected faulty components
Figure 1: Overall architecture of the PAL system.
different components. The assumption behind our approach is that performance anomalies are usually manifested as observable changes in one or multiple system-level metrics (e.g. CPU usage, free memory). In order to find such changes, PAL performs a robust change point detection algo-rithm over each collected system-level metric. The goal is to identify the critical change point that marks the beginning of the anomalous behavior.
Next, PAL sorts the discovered critical change points of different components in a chronological order to infer the anomaly propagation pattern. PAL then leverages the ex-tracted propagation pattern to localize the faulty compo-nent(s). The intuition is that performance bugs often have latent effects, which start to affect one system component, then propagate to other components, and eventually lead to application SLO violation. Therefore, the first set of com-ponents in the anomaly propagation pattern are most likely to be the faulty components since they exhibit anomalous behavior at the earliest time.
Note that PAL does not assume any knowledge about the distributed application topology for practicality and robust-ness. First, the application topology information might be privacy sensitive and the application user might be reluc-tant to release the application topology information to the cloud service provider. Second, the application topology can be dynamically evolving by adding or removing application components. Thus, it is unreliable to perform fault local-ization based on static topology information. Third, some applications such as IBM System S [18], exhibit a “back pressure” symptom where a faulty component might cause its upstream component to show anomalous behavior. For example, when a component becomes anomalous and its input buffer is filled with unprocessed tuples, its upstream component will not be able to send new tuples and get stuck as well. Thus, if we perform fault localization based on the static topology information, we will mistakenly pinpoint the upstream component of the faulty component as the root cause faulty component.
Figure 2 shows a real example of our propagation-aware anomaly localization scheme for an IBM System S stream processing application consisting of eight components. The system detects an application SLO violation at timetv. PAL
then performs anomaly onset identification on a look-back window of different system-level metrics and detects three critical change points: t1 on the metricxof the component
C6, t2 on the metric y of the component C7, and t3 on the metric z of the component C5. Since t1 < t2 < t3, we infer the anomaly propagation pattern as C6 →C7 →
t2 time Metric x on C6 Metric y on C7 Metric z on C5 look-back window anomaly propagation t3 t1 t2 C5 C7 C0 t1 t3 tv: SLO violation C3 C1 C4 C2 C6
Figure 2: An example of propagation-aware anomaly localization for a distributed application.
is different from the application data dependency topology that isC5 →C6→C7. We then infer thatC6 is the source faulty component.
Before we present the details of the PAL system, we first describe the assumptions of the PAL system. We first as-sume that the performance bug manifests as changes in some system-level metrics. Since real world distributed appli-cations are often inherently dynamic by processing time-varying workload, we assume that the system-level metric changes caused by normal workload fluctuations are less significant than those caused by the performance bugs. Since our propagation pattern is derived based on the timing infor-mation of different change points, we assume the anomaly onset time instants at faulty components are earlier than those of other components. These assumptions are generally valid in practice as we will show in the experiment section. Since PAL relies on timing information to infer propagation patterns, we need to assume the clocks of all system compo-nents are synchronized. In practice, machines can be syn-chronized using NTP which has an RMS errors of less than 0.1 ms on LANs and of less than 5 ms on Internet [21]. In our experiments, we observe that most of anomaly propagation delay between two dependent components is at second level. Therefore, our system can tolerate small time skews (i.e. tens of milliseconds).
2.2
Anomaly Onset Identification
We identify the onset of the anomalous behavior at each component by extracting critical change points in all system-level metrics associated with that component. The change point detection algorithm examines a set of metric samples in a look-back window [tv−W+ 1, tv] wheretv is the time
when the SLO violation happens and W is the length of the look-back window. The look-back window should be sufficiently large to cover any relevant critical change points. In our experiments, we usedW = 100 under a one-second sampling interval. We developed a four-step robust critical change point detection algorithm to accurately identify the onset of the anomalous behavior at each system-level metric. We will use the metric time seriesX={x1, ..., xW}for the
look-back window [tv−W+ 1, tv] as an example to explain
each algorithm step.
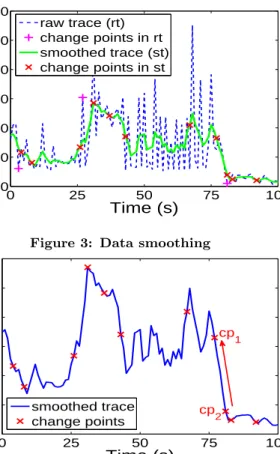
Step 1: PreprocessX using smoothing to tackle the data fluctuation issue. Figure 3 shows the result of data smooth-ing for a real network traffic trace. We can see that the change points detected over the smoothed data are more
0 25 50 75 100 0 200 400 600 800 1000 1200
Time (s)
Network in (Kbps)
raw trace (rt) change points in rt smoothed trace (st) change points in stFigure 3: Data smoothing
0 25 50 75 100 0 100 200 300 400 500 600
Time (s)
Network in (Kbps)
smoothed tracechange points
cp 2
cp 1
Figure 4: Change point rollback
meaningful than those detected on the original trace, which are often just random peak and bottom points. The tricky issue here is that if we smooth the data too much, we may run into the risk of filtering out the critical change point as well. We have tried both Kalman filter and moving average filter, and found that Kalman filter often filters the critical change points as well. Thus, the current PAL prototype adopts a 5-length moving average filter that calculates one average value for each sliding window of five consecutive data samples.
Step 2: Detect the change points using time series change point detection algorithms. There are many algorithms for change-point detection [10]. We used a combination of cu-mulative sum (CUSUM) charts and bootstrapping to detect a set of change points. We chose CUSUM because it does not require any assumption about the data distribution and its computation overhead is negligible compared with other methods. The CUSUM chart forXis constructed as follows:
Si=Si−1+ (xi−X¯), where 1≤i≤W,S0 = 0, ¯X is the mean ofX. We then calculate a magnitude of change using:
b
S = max1≤i≤WSi−min1≤i≤WSi.
We then employ bootstrap analysis to automatically inter-pret CUSUM charts. A bootstrap ofX is one permutation ofX generated by randomly reorderingX. IfX has a larger
b
S than most bootstraps (e.g., 95%), we say thatXcontains one change point that is located at xc where |Sc| is the
maximum among{|S1|, ...|SW|}.
We apply the same algorithm on{x1, ..., xc−1}and{xc+1, ..., xW}
recursively to discover more change points.
Step 3: Identify the critical change point that marks the onset of the anomalous behavior from the change points
detected in Step 2. We define aseparation levelmetric for each change pointxcto denote the change magnitude at this
change point: Ω(xc) = | 1 c−1 i=Pc−1 i=1 xi−W1−c i=PW i=c+1 xi| max( 1 c−1 i=Pc−1 i=1 xi, W1−c i=PW i=c+1 xi) (1)
Intuitively, the above equation compares the normalized dif-ference between the mean of the time series before the change point and the mean of the time series after the change point. Next, we extract the critical change point whose separation level values are the outliers (e.g., larger than mean plus 1.5
×standard deviation). If there are multiple outlier change points, we pick the one that is closest to the SLO violation time as the critical change point.
Step 4: During our experimental study, we found that the critical change point discovered above may sometimes reside in the middle of one sloped line such ascp2in Figure 4. Since our goal is to discover the onset of the anomalous behavior, we want to extract the change point at the beginning of the sloped line. We compare the slope angle at the current critical change point with that of its preceding change point. If their slope angles are similar (e.g., less than 30% differ-ence), we replace the critical change point with its preceding change point. For example, in Figure 4, we start fromcp2 and roll back tocp1sincecp1andcp2are on the same sloped line.
After the above four steps, we identify one critical change point for each system-level metric associated with each ap-plication component. We use the earliest critical change point among all system-level metrics to denote the onset of the anomalous behavior at that component.
2.3
Propagation-based Fault Localization
Our goal is to discover how a performance anomaly prop-agates in a distributed application, and use the propagation pattern to localize the faulty components.
We first classify the propagation pattern into either full coverage when we detect critical change points in all ap-plication components or partial coverage when the prop-agation only involves a subset of application components. Such classification allows us to distinguish the anomaly case caused by external factors such as workload spikes from that caused by internal component problems. Intuitively, if the anomaly is triggered by some external factors, all application components should see some changes in the same upward or downward trend within a short period of time. Thus, PAL decides whether the fault is an external one by considering whether all components include critical change points and whether those change points follow the same trend. Otherwise, we say the anomaly is caused by some internal fault.
For the internal fault case, we sort the anomaly onset time for different components to derive the anomaly prop-agation pattern. The propprop-agation pattern could be either: 1) sequential where a chain of components exhibit anoma-lous behavior in a sequential order; or 2)concurrent where multiple components show anomalous behavior at similar time (e.g., the difference is less than 2 seconds). If the anomaly propagation pattern is sequential, we will pinpoint the first component on the chain as the faulty component.
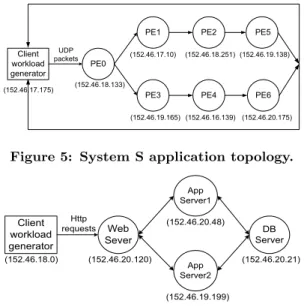
PE0 PE1 (152.46.18.133) PE2 PE3 PE4 (152.46.17.10) (152.46.18.251) (152.46.19.165) (152.46.16.139) PE5 PE6 (152.46.19.138) (152.46.20.175) Client workload generator UDP packets (152.46.17.175)
Figure 5: System S application topology.
Web Sever App Server1 (152.46.20.120) App Server2 (152.46.20.48) (152.46.20.21) (152.46.19.199) Client workload generator Http requests (152.46.18.0) DB Server
Figure 6: RUBiS application topology.
If the anomaly propagation pattern consists of concurrent anomalous behaviors, we will pinpoint the beginning set of current anomalous components as faulty components.
The fault localization results based on the anomaly prop-agation pattern need further validation (e.g., VM perturba-tions), which is part of our on-going work and is beyond the scope of this paper. Although the propagation pattern can not always provide the exact anomaly causes, it can speed up the diagnosis process by narrowing down faulty components and relevant system-level metrics.
3.
EXPERIMENTAL EVALUATION
We have implemented the PAL system and conducted extensive experiments using IBM System S data stream pro-cessing system [18] and RUBiS online auction benchmark (EJB version) [4]. In this section, we first describe our experiment setup. We then present the experimental results.
3.1
Experiment Setup
Our experiments were conducted on the NCSU’s Virtual Computing Lab (VCL), a production cloud computing in-frastructure, that operates in a similar ways as Amazon EC2 [1]. Each host has a dual-core Xeon 3.00GHz CPU and 4GB memory, and runs CentOS 5.2 64- bit with Xen 3.0.3. The guest VMs also run CentOS 5.2 64-bit.
PAL monitors an application resource demands from do-main 0, using the libxenstat library to collect resource
usage information (e.g., CPU usage, memory consumption, network I/O) for both domain 0 and guest VMs. The sam-pling interval is 1 second. We perform critical change point detection over a look-back window (W) of time series. We used W=100 seconds in our experiments.
IBM System S testbed: We first used IBM System S data stream processing system [18] as case study appli-cations. In System S, each application consists of a set of inter-connected processing elements called PEs. In our experiments, we used a tax calculation application which is one of the sample applications provided by System S. We measured the average per-tuple processing time and an SLO violation anomaly is marked if the average processing
0 200 400 600 800 1000 0 20 40 60 80 100 Time (seconds)
CPU Usage (%)
PE5 in System S DB server in RUBiSFigure 7: Sample CPU usage traces in System S and RUBiS.
time is larger than a pre-defined threshold (e.g., 100ms). Figure 5 shows the application topology including the IP addresses of the VCL hosts used in the experiments. We run each PE in a Xen guest VM. In order to evaluate our system under workloads with realistic time variations, we used the workload intensity observed in the WorldCup 98 web trace [3] to modulate the data arrival rate.
RUBiS testbed: We used the RUBiS workload genera-tor to track the response time of the HTTP requests it made. An SLO violation anomaly is marked if the average request response time is larger than 100ms. In order to evaluate our system under workloads with realistic time variations, we used the workload intensity observed in three real-world web traces (WorldCup 98, ClarkNet, NASA) [3] to modulate the request rate of our synthetic RUBiS benchmark. Figure 6 shows the topology of the RUBiS application including the IP addresses of the VCL hosts used in the experiments. Similar to the IBM System S experiment, we run each ap-plication component in a Xen guest VM.
In Figure 7, we show a snapshot of CPU usage traces of sample components (DB server in RUBiS and PE5 in System S application) in our experiments. We can see both applica-tions exhibit dynamic CPU usages under real world dynamic workload traces, which brings challenges to accurate change point detection. We will show later that our approach is robust to dynamic workloads.
Fault injection. We inject different faults at different time instants during an application runtime. For each fault injection, we repeated the experiment 10 to 20 times. We tested both single component faults and multiple component faults. For IBM System S, we injected the following single component faults: 1)CpuHog: we introduce a busy loop in PE1; and 2)MemLeak: we inject a memory leak bug in PE1 that continuously allocates memory but forgets to release the allocated memory. Multiple component faults include: 1)NetHog: we use httperf [2] tool to send large volume of http requests from PE1 to PE2 so that the link between PE1 and PE2 is saturated; 2)WkChg: we increase the workload intensity to make the whole application overloaded; and 3)
MemLeak: we inject the memory leak bug simultaneously on PE1 and PE3.
For RUBiS, single component faults include 1)CpuHog: a CPU-intensive program competed CPU with the App Server 1; 2)MemLeak: a memory-intensive program competed mem-ory with the App Server 1; and 3) NetHog: an external program sent an excessive number of HTTP requests to the Web Server. Multiple component faults include: 1)WkChg: we increase the workload intensity to make the whole
0 0.2 0.4 0.6 0.8 1 CpuHog MemLeak
Recall
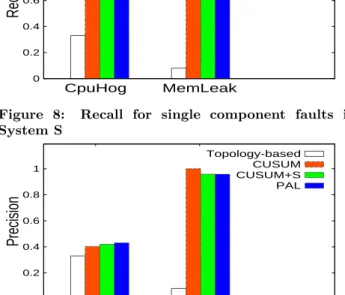
Topology-based CUSUM CUSUM+S PALFigure 8: Recall for single component faults in System S 0 0.2 0.4 0.6 0.8 1 CpuHog MemLeak
Precision
Topology-based CUSUM CUSUM+S PALFigure 9: Precision for single component faults in System S
cation overloaded; 2)OffloadBug: the App Server 1 wants to offload some EJBs to App Server 2. However, the program bug (JIRA #JBAS-1442) in App Server 1 makes HTML contents still return to the Java servlets hosted on the App Server 1; and 2)LBBug: a load balancing bug (mod jk 1.2.30 ) causes the Web Server to dispatch requests unevenly.
For comparison, we also implemented a set of alternative schemes: 1) the topology-based scheme that employs the same change point detection algorithms as PAL (except the rollback step) and then pinpoints the faulty components based on the application topology; 2) theCUSUMscheme that first employs CUSUM charts and bootstraps to detect a set of changes points, and then picks the outlier change point as the critical change point; and 3) theCUSUM+S
scheme that first performs smoothing (i.e., 5-length moving average) over the raw monitoring data and then performs the CUSUM scheme over the smoothed data. But this scheme does not perform roll back as PAL does.
To quantify the accuracy of our anomaly localization model, we use the standard precision and recall metrics. LetNtp, Nf n,Nf p, andNtndenote the number of true positives
(cor-rectly pinpoint a faulty component), false negatives (miss a faulty component), false positives (pinpoint a normal com-ponent as faulty), and true negatives, respectively. We cal-culate the recall and precision in standard ways as follows,
Recall= Ntp
Ntp+Nf n
, P recision= Ntp
Ntp+Nf p
(2)
3.2
Results and Analysis
We first present the results of IBM System S experiments. Figures 8 and 9 show the faulty component pinpoint accu-racy results for different single-component faults. We ob-serve that the precision and recall values of PAL are con-sistently among the highest and memory leak fault is much
0 0.2 0.4 0.6 0.8 1 NetHog WkChg MemLeak
Recall
Topology-based CUSUM CUSUM+S PALFigure 10: Recall for multiple component faults in System S 0 0.2 0.4 0.6 0.8 1 NetHog WkChg MemLeak
Precision
Topology-based CUSUM CUSUM+S PALFigure 11: Precision for multiple component faults in System S
easier to detect than the CPU hog fault. We can see that all three change point based approaches can achieve more than 90% precision and recall in the memory leak case. In contrast, the topology-based scheme has poor accuracy in both fault cases. As mentioned in section 2, System S has the “back pressure” symptom where the faulty component (PE1) causes its upstream component (PE0) to show anoma-lous symptom. Thus, the topology-based scheme pinpoints the upstream component as the faulty component instead of the true faulty component.
In the CPU hog case, although PAL can achieve over 80% recall, its precision is around 40%, which means a number of false positives are generated. After examining the de-tailed logs, we found that most of these false positives were those components whose change points are very close to the change point of the faulty component (e.g. differ in one or two seconds). Therefore, our system considers them as the multiple component faults. We observe that the change point of the faulty component was still the earliest. This result also reflects that the anomaly caused by the CPU hog fault propagates very fast in the distributed application.
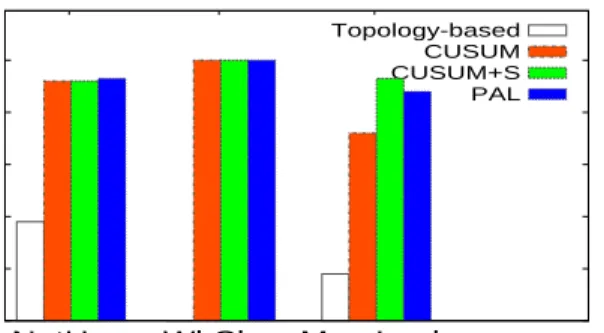
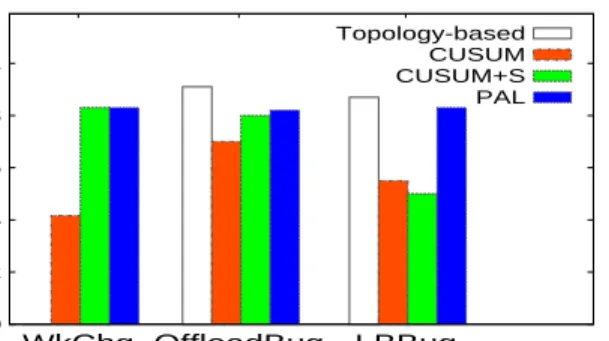
Figures 10 and 11 show the recall and precision results for the multiple-component faults. PAL can achieve 100% recall in the workload change case. However, PAL did not identify change points on all components in a few workload change cases. In this situation, the pinpointed components were considered as false positives. As a result, PAL has a precision value less than 100%. PAL can also achieve 100% precision in the network hog and multiple memory leak fault injection cases. Again, the topology-based approach performs poorly.
We now present the results of the RUBiS experiments. Figure 12 and 13 show the recall and precision results for single-component faults. Figure 14 and 15 show the
0 0.2 0.4 0.6 0.8 1
CpuHog MemLeak NetHog
Recall
Topology-based CUSUM CUSUM+S PAL
Figure 12: Recall for single component faults in RUBiS 0 0.2 0.4 0.6 0.8 1
CpuHog MemLeak NetHog
Precision
Topology-based CUSUM CUSUM+S PAL
Figure 13: Precision for single component faults in RUBiS
call and precision results for multiple-component faults. In most cases, PAL outperforms the other approaches in both precision and recall values. In comparison, topology-based scheme achieved better accuracy than all the other algo-rithms in the cases of network hog, offloading bug, and load balancing bug. The reason is because we happened to inject the fault in the first component in the topological order. For the offloading and load balancing bug, the fault did not show the back pressure symptom in RUBiS as in IBM System S. However, PAL does not assume the knowledge of application topology and still achieves 80-100% precision and recall values.
Finally, we evaluate the overhead of PAL. Our measure-ments show that it takes 6.4±1.3 seconds to perform one distributed application anomaly pinpointing (including ex-tracting change points for all metrics of all components). Since the pinpointing is only triggered after the anomaly is detected, we believe such an overhead is small. During normal execution, PAL only performs passive VM system-level metric sampling. Thus, during normal execution, PAL imposes less than 1% CPU load in domain 0. The memory consumption of PAL is about 1.4MB.
4.
RELATED WORK
There has been extensive study on change point detection and its applications [10]. In the context of system prob-lem detection, the common approach is to correlate change points in system-level metrics with the change points of ap-plication activities. For example, Blacksheep [24] correlates the change point at system-level metric (e.g., cpu usage) with the change in count of Hadoop application states (i.e., events extracted from logs of DataNodes and TaskTrackers) to detect and diagnose the anomaly in a Hadoop cluster. Wang et. al. [28] studied the change point correlation
0 0.2 0.4 0.6 0.8 1 WkChg OffloadBug LBBug
Recall
Topology-based CUSUM CUSUM+S PALFigure 14: Recall for multiple component faults in RUBiS 0 0.2 0.4 0.6 0.8 1 WkChg OffloadBug LBBug
Precision
Topology-based CUSUM CUSUM+S PALFigure 15: Precision for multiple component faults in RUBiS
tween requests and corresponding replies to detect DoS at-tacks. Agarwal et. al. [6] monitored the change relation between response time with load balancer’s assigned weight to detect astorm draincondition: the load balancing system is confused by the fast response time of faulty server and tries to shift more requests to the faulty server. In comparison, our approach applies the change point detection in the con-text of distributed application fault localization. Instead of performing correlations, our approach focuses on identifying the onset of anomalous behavior at different components and sort them to achieve pinpointing.
Previous work has proposed various black box pinpointing techniques. Project5 [8] performed cross-correlations be-tween message traces to derive causal paths and identify performance bottlenecks. E2EProf [7] also applied cross-correlation techniques over network traffic traces to identify the bottleneck component. Jiang et al. [19] maintained a collection of extracted invariants based on linear models and performed anomaly detection based on invariant vio-lations. NAP [11] collected network communication traces and applied queuing theory to estimate the service time and waiting time for identifying the bottleneck component. Kahuna-BB [25] applied clustering algorithms over system-level metrics to learn normal node behavior and detect faulty nodes using peer-comparison. The EntomoModel [23] stud-ied performance anomaly manifestations by characterizing workload and management policy settings under which the performance anomalies are likely to be triggered. Fa [17] proposed a clustering method which groups instances based on how they are different from the failure instances. In comparison, our work focuses on extracting anomaly prop-agation patterns and leveraging the propprop-agation pattern to localize the faulty components and infer anomaly causes.
A flurry of research work has provided various distributed application debugging tools. Magpie [9] is a request
ex-traction and workload modeling tool that can record fine-grained system events and correlates these events using an application specific event schema to capture the control flow and resource consumption of each request. Pinpoint [13] takes a request-oriented approach to tag each call with a request ID by modifying middleware platform and applies statistical methods to identify components that are highly correlated with failed requests. Pinpoint can best handle service failures such as machine crashes or exceptions rather than latent performance anomalies. Pip [22] can find struc-tural and performance bugs in distributed systems by com-paring actual system behavior to expected system behav-ior described in programmer-written templates. However, Pip requires application modifications. JAGR [12] injected controlled Java exceptions into J2EE applications to obtain application-specific fault propagation graphs and used the graph as a guidance for fast recovery. In contrast, our work focuses on black box online anomaly localization, which does not require any modifications to applications or middleware platforms. We believe that our scheme is complementary to the above work, which can provide useful hints for more intrusive debugging.
5.
DISCUSSIONS
The accuracy of the PAL system depends on whether the chosen change points are related to the anomaly. However, in dynamic distributed systems, change points can be caused by various reasons such as workload fluctuations and routine operations such as periodic system maintenance. Although our critical change point algorithm can filter out some irrele-vant change points caused by transient resource usage spikes, it is still a challenging problem to distinguish the change points related to anomalies from all the other irrelevant change points. One possible extension to PAL is to use a predictability metric (e.g., prediction error) to filter out those irrelevant change points. The intuition behind our approach is that the values of the change points caused by normal workload fluctuation are more predictable than the values of those critical change points caused by anomalies.
The change point based propagation discovery algorithm is also sensitive to the length of the look-back window. If the length of the look-back window is too small, PAL might miss the change point corresponding to the anomaly onset time; If the length of the look-back window is too large, it will increase the possibility of including irrelevant change points. The current prototype of the PAL system empirically decides the look-back window length based on our observation about the range of anomaly propagation delays. As part of our future work, we will study principled algorithms to properly decide the look-back window length.
Large-scale distributed systems often consist of many dis-tributed components driven by dynamic workloads, which might greatly increase the chance of detecting spurious prop-agation patterns caused by irrelevant change points. It is probably insufficient to only rely on change point detection to perform propagation pattern discovery and fault localiza-tion. To address the problem, we plan to integrate PAL with previous statistical dependency discovery techniques [14, 20] to improve the fault localization accuracy.
6.
CONCLUSIONS
propagation-based performance anomaly localization system for distributed applications running inside cloud. PAL em-ploys a robust critical change point detection algorithm that can accurately identify the onset of anomalous behavior at different components. It then derives the anomaly propa-gation pattern based on the chronological order of different components’ anomaly onset time. Next, PAL can localize faulty components based on the derived anomaly propaga-tion patterns. We have implemented PAL on top of the Xen platform and tested it using the RUBiS online auc-tion benchmark and IBM System S data stream processing system driven by real world dynamic workload. Our exper-imental results show that PAL is efficient and light-weight, which makes it suitable for localizing distributed application anomalies in cloud systems.
7.
ACKNOWLEDGEMENTS
This work was sponsored in part by NSF CNS0915567 grant, NSF CNS0915861 grant, U.S. Army Research Office (ARO) under grant W911NF-10-1-0273, and IBM Faculty Award. Any opinions expressed in this paper are those of the authors and do not necessarily reflect the views of the NSF, ARO, or U.S. Government. The authors would like to thank the anonymous reviewers for their insightful comments.
8.
REFERENCES
[1] Amazon Elastic Compute Cloud. http://aws.amazon.com/ec2/.
[2] Httperf. http://code.google.com/p/httperf/. [3] The ircache project. http://www.ircache.net/. [4] Rice university bidding system.
http://rubis.objectweb.org/.
[5] Virtual computing lab. http://vcl.ncsu.edu/. [6] M. Agarwal, M. Gupta, V. Mann, N. Sachindran,
N. Anerousis, and L. Mummert. Problem
determination in enterprise middleware systems using change point correlation of time series data. InProc. of NOMS, 2006.
[7] S. Agarwala, F. Alegre, K. Schwan, and
J. Mehalingham. E2EProf: Automated end-to-end performance management for enterprise systems. In
Proc. of DSN, 2007.
[8] M. K. Aguilera, J. C. Mogul, J. L. Wiener, P. Reynolds, and A. Muthitacharoen. Performance debugging for distributed systems of black boxes. In
Proc. of SOSP, 2003.
[9] P. Barham, A. Donnelly, R. Isaacs, and R. Mortier. Using magpie for request extraction and workload modelling. InProc. of OSDI, 2004.
[10] M. Basseville and I. V. Nikiforov.Detection of abrupt changes: theory and application. Prentice-Hall, Inc., 1993.
[11] M. Ben-Yehuda, D. Breitgand, M. Factor, H. Kolodner, V. Kravtsov, and D. Pelleg. NAP: a building block for remediating performance
bottlenecks via black box network analysis. InProc. of ICAC, 2009.
[12] G. Candea, E. Kiciman, S. Zhang, P. Keyani, and A. Fox. Jagr: an autonomous self-recovering
application server. InProc. of Autonomic Computing Workshop, 2003.
[13] M. Y. Chen, E. Kiciman, E. Fratkin, A. Fox, and E. A. Brewer. Pinpoint: Problem determination in large, dynamic internet services. InProc. of DSN, 2002. [14] X. Chen, M. Zhang, Z. Mao, and P. Bahl. Automating
network application dependency discovery:
Experiences, limitations, and new solutions. InProc. of OSDI, 2008.
[15] I. Cohen, M. Goldszmidt, T. Kelly, J. Symons, and J. S. Chase. Correlating Instrumentation Data to System States: A Building Block for Automated Diagnosis and Control. InProc. of OSDI, Dec. 2004. [16] I. Cohen, S. Zhang, M. Goldszmidt, J. Symons,
T. Kelly, and A. Fox. Capturing, indexing, clustering, and retrieving system history. InProc. of SOSP, 2005. [17] S. Duan, S. Babu, and K. Munagala. Fa: A system for automating failure diagnosis. InProc. of ICDE, 2009. [18] B. Gedik, H. Andrade, K.-L. Wu, P. S. Yu, and
M. Doo. SPADE: the system s declarative stream processing engine. InProc. of SIGMOD, 2008. [19] G. Jiang, H. Chen, and K. Yoshihira. Discovering
likely invariants of distributed transaction systems for autonomic system management.Proc. of the IEEE International Conference on Cluster Computing, 2006. [20] S. Kandula, R. Chandra, and D. Katabi. What’s going on?: learning communication rules in edge networks. InProc. of SIGCOMM, 2008.
[21] D. L. Mills. A brief history of NTP time: memoirs of an internet timekeeper. Computer Communication Review, 2003.
[22] P. Reynolds, C. E. Killian, J. L. Wiener, J. C. Mogul, M. A. Shah, and A. Vahdat. Pip: Detecting the unexpected in distributed systems. InProc. of NSDI, 2006.
[23] C. Stewart, K. Shen, A. Iyengar, and J. Yin. Entomomodel: Understanding and avoiding performance anomaly manifestations. InProc. of MASCOTS, 2010.
[24] J. Tan and P. Narasimhan. Rams and blacksheep: Inferring white-box application behavior using black-box techniques. Technical report, Carnegie Mellon University Parallel Data Laboratory, 2008. [25] J. Tan, X. Pan, E. Marinelli, S. Kavulya, R. Gandhi,
and P. Narasimhan. Kahuna: Problem diagnosis for mapreduce-based cloud computing environments. In
Proc. of NOMS, 2010.
[26] Y. Tan and X. Gu. On predictability of system anomalies in real world. InProc. of MASCOTS, 2010. [27] Y. Tan, X. Gu, and H. Wang. Adaptive system
anomaly prediction for large-scale hosting infrastructures. InProc. of PODC, 2010. [28] H. Wang, D. Zhang, and K. Shin. Change-point
monitoring for the detection of DoS attacks. InProc. of the IEEE Transactions on Dependable and Secure Computing, 2005.