POLAND'S PARTICIPATION IN GLOBAL VALUE CHAINS
Aleksandra Nacewska-Twardowska, PhD Department of International Business and Trade Institute of International Economics
Faculty of Economics and Sociology University of Łódź
1
POLAND'S PARTICIPATION IN GLOBAL VALUE CHAINS
Abstract The aim of the paper is to shortly assess changes in global value chains in Poland since mid-90s. Transformation, accession to the European Union and foreign investment have conversed Polish economy and trade. In addition, globalization and revolution in the global economy not only affected adjustment in global value chains (GVCs) but also formed new positions of countries within them. As a result of marketization, Poland has become an open economy which is increasingly involved in world trade. To illustrate a shift in polish participation in global value chains data from the Trade in Value Added database (TiVA) was used. The research results show that over the past 20 years, Poland has been opening up to the global economy. The importance of foreign value added in exports increased, and the position of Poland in GVC shifted down along the production chain.
Keywords: global value chains, GVC, international trade, trade in value added, Poland
2
POLAND'S PARTICIPATION IN GLOBAL VALUE CHAINS
1 Introduction
The Polish economy has changed significantly since the early 1990s. After the Second World War, the eastern part of Europe was under the influence of the Soviet Union. The socialist economy was centrally controlled and did not respond to the needs of society. Public dissatisfaction, constant shortages in supply and a lack of democracy have led to changes. In 1989, the first free elections took place and Leszek Balcerowicz's economic reform was initiated. Transformation of the socio-economic system was based on marketization and reprivatization. The introduction of the capitalist system was accompanied by capital and currency reform, liberalization of economic activity and opening the system for market-based allocation of resources. At the same time, the change in foreign policy, previously oriented to the east, into the pro-western one has conversed the directions of trade; Germany and other countries in western Europe became the new largest trading partner for Poland. One of the basic tasks of the Polish government was to introduce solutions liberalizing international trade. Polish trade policy needed new solutions and one of them was adopting customs law in 1989, which enabled Poland to participate fully in the GATT agreement. The second important action was the liberalization of capital flows. It has started direct foreign investments in Poland. The inflow of capital from abroad gave the chance to transform Poland's economy. Reprivatisation processes have enabled foreign companies to enter Poland while modernizing the economy. These actions helped to recover from the recession and to reduce the inflation. The following years were characterized by the adjustment of the economy and law to join the European Union.
At the same time, in the last three decades, word trade has changed due to shifting in liberalization, technological development and transport possibilities. The set of processes known as globalization have transformed the global economy. The liberalization of trade connected with the Uruguay Round and the establishment of the World Trade Organization (WTO) impacted on the rapid development of trade links. Enterprises benefited from trade facilitation, lower costs of foreign production or investment incentives and consequently reconstructed production process. Interconnections in
3
international trade, where each country specialized in one stage of production, has grown. In literature, this process is referred to “production fragmentation”, “vertical specialization”, “offshore outsourcing”, “international production networks” or “global supply chains”. The latter refers directly to the term “global value chains” (GVCs) in the context of the production and export of national added value.
The first theoretical premises of the changes in a system of multinational relations where described by Leontief in the early 60's (Leontief & Strout 1963). Then, with the emergence of New Trade Economy (Helpman & Krugman, 1985; Krugman, 1979, 1980), the technology production line was combined with increasing returns of scales. This provided the foundation for analytical frameworks of international trade under imperfect competition (Inomata, 2017). The development of technology and communication made possible to use the advantages associated with the fragmentation of production for profit maximization. For many companies, vertical specialization is no longer an obstacle and use of import to produce export has grown (Johnson, 2014). Theoretical issues related to the large-scale use of production fragmentation began to appear at the beginning of the 21st century. Baldwin (2006) associated this with the concept of the second unbundling, which allowed the separation of most manufacturing stages. Grossman and Rossi-Hansberg (2006) called it “trade in tasks”; different countries by adding value to global supply chains reduce costs of the global production process. The key difference between this approach and the traditional trade literature is that the technology of production is firm-specific, not country-specific (WTO, 2013).
The problem has started to increase the proper measurement of trade flows. First attempts to describe the production process of the products became more intense in the 90s when Tempset (1996) described the production of the Barbie doll. Other case studies were prepared for iPod (Linden, Kraemer & Dedrick, 2009), iPhone (Xing & Detert, 2010) or notebook PCs (Dedrick, Kraemer & Linden, 2010). They showed that although these products are made in China domestic value added share of China in gross value is small reaching, about 4%. Traditional international trade statistics register gross value of goods and services as crossing borders and in effect part of the export is
4
counted twice or more. That means that gross exports consist less and less of national value added. Additionally calculated trade disturbs economic analysis and makes it difficult to assess the adequate participation of individual countries in the global economy. As a result, only the analysis of international trade with value added allows estimating changes in the position in the GVC of a particular country.
Due to the revolution taking place in word economy, Poland must change two times more to catch up with developed economies. It is important to take a good place in the international production chain and, as a result, benefit from exporting the added value. So, how has the Polish position in GVC changed since the 90s? Has accession to the European Union influenced and accelerated changes in Poland's share in global value chains? The rest of the article is organized in the following way. Section 2 describes research method and sources of statistical data. Section 3 present results of the calculation and finally, section 4 presents some conclusions.
2 Research method and sources of statistical data
Changes in the world economy combined with the fragmentation and emergence of GVC have caused the inadequacy of the statistics traditionally used. As noted by the OECD and WTO under long and divided production chains circular trade takes place (2012). An example can be repeated trade in goods between the USA and Mexico or trade in the European Union. To measure hidden trade in value added underlying gross trade, we need to go along through the global supply chains (Johnson 2014). This approach is feasible on a small scale when we consider individual products. When the added value in GVC is analyzed in the context of countries or sectors it is much more difficult to indicate where the next layers of value are created. First global analyzes have become possible a few years ago when Inter-Country Input-Output (ICIO) tables were created. Those tables ensured compatible bilateral trade flows which allowed to compare existing production networks. However, to measure value-added content of trade researchers requires an international input-output table.
5
An input-output approach of trade flow in value-added terms has been described, inter alia, by Koopman, Powers, Wang and Wei (2010) and Stehrer, Foster and de Vries (2012). Conceptual framework for tracking value-added also has been described by OECD and WTO (2012). It is possible to decompose any particular product with value Vp into the value-added generated in country i such that the total value of
This simple formula complicates when aggregating up for a group of products or whole economy. As a result, it is necessary to use data that has been aggregated to some extent. Although the use of international input-output table allows decomposing gross trade into value added components (Figure 1).
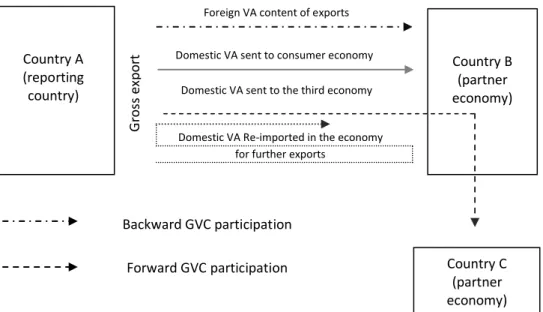
Fig. 1 Visualization of the value added components of gross exports and GVC trade flows based on the WTO-OECD scheme. Source: OECD-WTO TiVA Database
The simplest breakdown of gross exports is foreign value added (FVA) and domestic value added (DVA) content of exports. The first one corresponds to the value added of inputs that were imported in
Country A (reporting country) G ro ss ex p o rt Backward GVC participation Forward GVC participation Country B (partner economy) Country C (partner economy) Foreign VA content of exports
Domestic VA sent to consumer economy
Domestic VA Re-imported in the economy for further exports
6
order to produce intermediate or final goods/services to be exported. The second, domestic value added content of export, is decomposed of three elements (OECD & WTO, 2012):
1. Domestic value added sent to consumer economy (DDVA – direct domestic value added) corresponds to the domestic value added embodied either in final or intermediate goods or services that are directly consumed by the importing economy.
2. Domestic value added sent to third economies (IDVA – indirect domestic value added) represents the domestic value added contained in intermediates (goods or services) exported to a first economy that re-exports them to a third economy as embodied in other goods or services.
3. Domestic value added re-imported in the economy outlines the domestic value added of exported intermediates, or inputs, that is sent back to the economy of origin as embodied in other intermediates and used to produce exports. Such value added round-trip between two (or more) economies highlights the domestic value added content present in an economy's imports.
Decomposition methods are also described by Koopman, Wang, and Wei (2012,2014).
Figure 1 also presents the exchange of value added among global value chains. On the one hand, domestic value added sent to third economies corresponds to forward GVC participation. It catches DVA contribution (from country A) sent to partner economy (country B) for further processing and then export through the value chain to third economies (country C). It reflects downstream links in the global value chain. On the other hand, foreign value added content of exports corresponds to backward GVC participation (upstream links in the chain). It represents FVA contribution imported to country A to produce intermediate or final goods/services and afterward exported to partner economy (country B). Both indicators make possible to present the actual contribution of individual economies to the global economy and at the same time allow indicating 'where in the global supply chain is a given country'? Together, forward and backward indicators, enable construction GVC participation and position index.1
1
7
According to UNCTAD (2013) and Koopman et al. (2010) GVC participation index specifies the share of a country’s exports that is part of a multi-stage trade process. It means it is the foreign value added (FVA) used in a country’s exports (backward participation/upstream perspective) plus the indirect domestic value added (IDVA) in export (forward participation/downstream perspective), divided by total exports.
This measure should be used together with the GVC position index which allows indicating location of the country in the production chain. This can be done by comparison country’s exports of intermediates that are used by other countries (the indirect domestic value added - IDVA) witch that country’s use of imported intermediates (the foreign value added - FVA) otherwise log ratio of a country-sectors supply of intermediates used in other countries’ exports to the use of imported intermediates in its own production.
If the index has a positive value, i.e. IDVA is higher than FVA, then the country lies upstream in the global value-chain. In the opposite situation, i.e. when FVA is higher than IDVA, the index has a negative value and it means the country lies downstream in the GVC. In other words, if the country exports raw materials or intermediaries it lies upstream in the GVC however, if the country uses a large portion of import intermediates to produce final goods for exports, it lies downstream in the GVC.
The previously mentioned trade in tasks combines with a different added value at various production levels. In 90s Stan Shih, Acer CEO, noted that manufacturing means making money from manual labor which adds little value, in contrast to tasks connected with R&D, marketing, etc. which add much value as connected with ‘brains’ (Kase, Slocum & Zhang, 2011; UNCTAD, 2015). He plotted his observations on graph presenting the relationship between value added and production value chain. Figure 2 presents Stan Shih Smiling Curve. Therefore, in the context of the added value, the position
8
in the GVC is very important. Both high and low levels of GVC position index combine with high added value (Baldwin, Forslid & Ito, 2016; Ye, Meng & Wei, 2015)
Fig. 2 The smiling curve of Stan Shih
One of the largest databases that contain information about value-added trading is Trade in Value Added database (TiVA). This database was created as a result of joint OECD – WTO initiative. TiVA provides indicators from more than 60 economies (OECD, EU28, G20, East and South-east Asian economies) and 34 industrial sectors. It contains (2016 version) information from 1995 to 2011 and, in some cases, to 2014. In the next section, data from the TiVA database was used to describe changes in global value chains in Poland in years 1995 to 2014.
3 Results of the calculation
Firstly, to present integration of the economy into global value chains I prepare the analysis of foreign content of export. Figure 3 shows polish foreign value added content of gross exports since the mid-90s to 2014. Data indicates significant rise in integration process; FVA has doubled in last 20 years reaching almost one-third of gross export. At the same time, the majority of EU countries also
concept R&D innovation manufacuring distribution marketing sales V A LU E A D D ED LOW H IG H START END
9
recorded an increase in the share of foreign value added in gross exports (Figure 3b). However, the dynamic growth of FDA in Poland has managed to reach the average EU level.
Fig. 3a Foreign value added content of gross exports in Poland from 1995 to 2014
Fig. 3b Foreign value added content of gross exports by European countries in 1995 and 2014
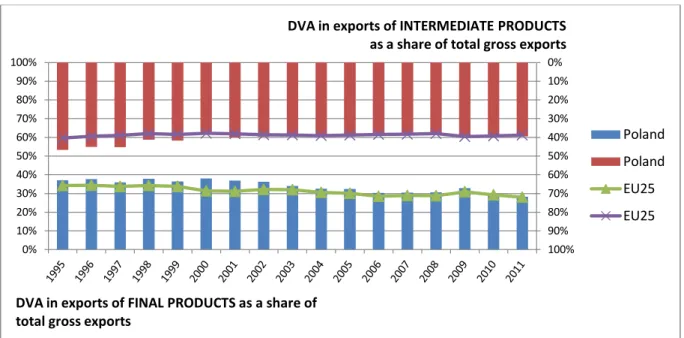
Due to the increase in the share of FVA in gross exports, the share of DVA decreases both in relation to intermediate and final products (Figure 4). Adjustments in Poland’s share of DVA are very similar to changes taking place in other countries of the European Union. Although the diminishing share of domestic value added in the export of final products may be disturbing; it may mean an unfavorable change in polish position in GVC.
0% 5% 10% 15% 20% 25% 30% 35% 0% 10% 20% 30% 40% 50% 60% 70% 2014 1995
10
Fig. 4 Domestic value added content of gross export by end-use category in Poland and EU25* since 1995 to 2011.
* Here and below abbreviation ‘EU25’ used with reference to the statistics means countries of the European Union without Cyprus, Latvia and Malta.
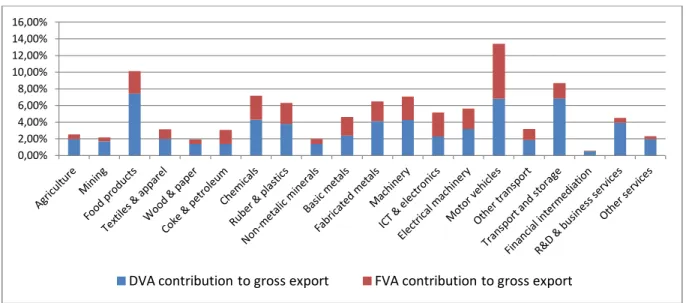
Poland industry's participation in domestic and foreign value content of gross export indicates considerable variations. Domestic value added contribution to gross export achieves the highest shares for Transport and storage, Motor vehicles and Food products respectively. However, it should be noted that in the case of Motor vehicles industry, it is also characterized by highest share of foreign value input to gross export.
0% 10% 20% 30% 40% 50% 60% 70% 80% 90% 100% 0% 10% 20% 30% 40% 50% 60% 70% 80% 90% 100%
DVA in exports of INTERMEDIATE PRODUCTS as a share of total gross exports
DVA in exports of FINAL PRODUCTS as a share of total gross exports
Poland Poland EU25 EU25
11
Fig 5 Poland's industries share of domestic and foreign value content of gross exports in 2014
Fig 6a Poland and EU25 participation index since 1995 to 2014
0,00% 2,00% 4,00% 6,00% 8,00% 10,00% 12,00% 14,00% 16,00%
DVA contribution to gross export FVA contribution to gross export
50% 52% 54% 56% 58% 60% 62% 64%
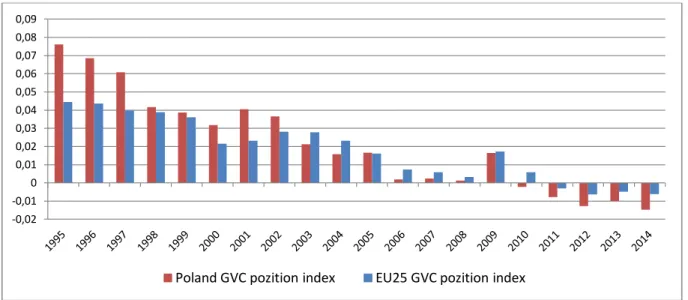
12 Fig 6b Poland and EU25 position index since 1995 to 2014
The index of Poland's participation in global value chains (Figure 6a) increased from the mid-1990s to the start of the crisis in 2009 by around 10 percentage points. In subsequent years, after a decline in 2009, it stabilized at around 61%. In comparison to data from European statistics, the Polish share in GVC is above average. This means that in the case of Poland, international production chains are important to the development of the economy. Along with the increase in the participation in GVC, the position of Poland and the EU25 in GVC also changed (Figure 6b). The general trend indicates the move of European economies with along global production chains from upstream to downstream. Polish shift had a greater amplitude than EU25; since 1995 to 2014 in case of Poland it was 0,09 and in the EU25 about half less (0,05).
Fig 7a Poland’s position and participation index since 1995 to 2014
-0,02 -0,01 0 0,01 0,02 0,03 0,04 0,05 0,06 0,07 0,08 0,09
Poland GVC pozition index EU25 GVC pozition index
50% 52% 54% 56% 58% 60% 62% 64% -0,02 -0,01 0 0,01 0,02 0,03 0,04 0,05 0,06 0,07 0,08 0,09 GV C p ar ti ci p at ion in d e x GV C p oz it ion in d e x
13
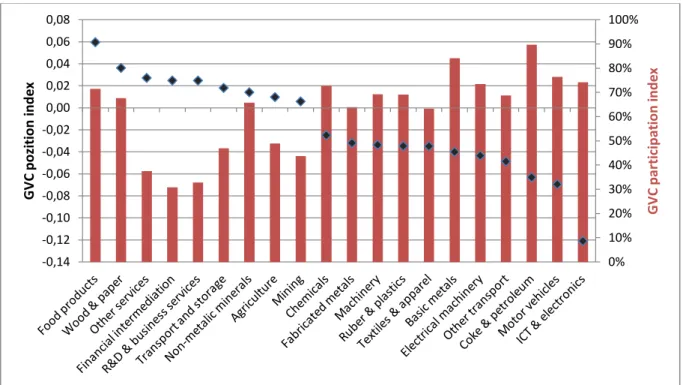
Fig 7b Poland’s position and participation index by industry in 2014
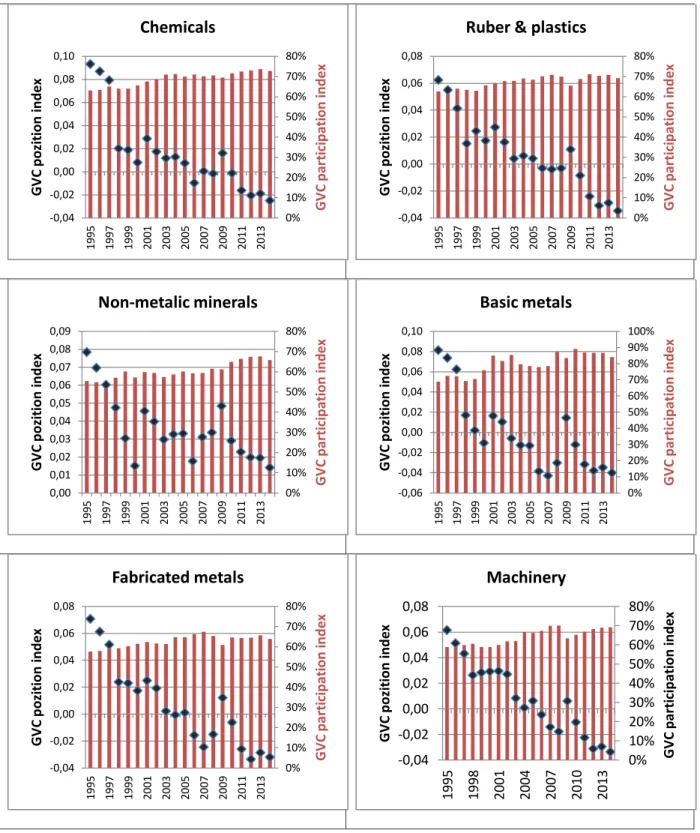
The total changes in the Polish GVC position and participation index are presented in Figure 6c and they are broken down by industry in Figure 6d. The differences between industries are very large and each case should be analyzed separately. Below I will present only two selected examples. Detailed information about changes in position and participation in GVC by industries can also be found in the Annex – Figures 10a to 10d.
Fig 8 Poland’s position and participation index in agriculture in 2014
0% 10% 20% 30% 40% 50% 60% 70% 80% 90% 100% -0,14 -0,12 -0,10 -0,08 -0,06 -0,04 -0,02 0,00 0,02 0,04 0,06 0,08 GV C p ar ti ci p at ion in d e x GV C p oz it ion in d e x 0% 10% 20% 30% 40% 50% 60% 0,00 0,01 0,02 0,03 0,04 0,05 0,06 0,07 0,08 GV C p ar ti ci p at ion in d e x GV C p oz it ion in d e x
14
In 2014 Food products hold the highest position in global value chains and their share in GVC participation index is over 70%; it is at the most upstream end of the value chain. However, it should be noted that although this last mentioned index has not changed significantly over the last 20 years, the first one has fallen by 60%. What is important, this fall is not caused by the increasing share of FVA in exports, but it is rather a change in the proportion of indirect and direct value added exported. Poland is increasingly exporting Food products directly to its trading partners (IDVA fall); this is supported by joining the EU in 2004 and opening up to international trade.
Fig 9 Poland’s position and participation index in ICT & electronicsin 2014
On the other end of value chain, at the most downstream side is Information and Communications Technology (ICT) & electronics industry; this industry exports mostly use imported components for production. The participation index in GVC of this industry in recent years, beyond the period of the economic crisis, it fluctuates around 75%.
4 Conclusions
Transformation of the world economy and the internal adjustment of Poland have influenced the growth in trade openness and benefits in international production chains. Trade in tasks, adding new layers of value, GVC appearance, etc. revolutionize the perception of global economy. To export, we
0% 10% 20% 30% 40% 50% 60% 70% 80% 90% -0,15 -0,10 -0,05 0,00 0,05 0,10 GV C p ar ti ci p at ion in d e x GV C p oz it ion in d e x
15
must first import. By measuring trade in value added it became possible to analyze commercial realities in the international production chain and at the same time to describe modification in global value chains.
The key finding from the research is that Poland has integrated significantly into global economy since 1995. Polish accession to the EU preceded by marketization and reprivatization increased export of foreign value added. Simultaneously, changes in the DVA confirm the inclusion of Poland in international production chains. Moreover, general analysis of the Polish GVC position index indicates a shift from upstream to downstream position on global value chain. According to the relationship between the value added GVC (Figure 2), the progressive decrease of GVC position index (shifting towards the end of GVC resulting in negative value of the index) should cause an increase of exported value added.
Similar adjustments take place in most EU25 countries. Changes that have taken place in Poland are therefore a reflection of changes taking place in the global economy. Certainly, the Polish economy is strongly connected with international production chains. If they change, Polish participation in global value chains will also change. However, the last 2-3 years covered by the analysis is the period in which the changes have lost their rate. That is why it will be very interesting to compare the presented results with data from the following years. For now, it is difficult to assess whether the slowdown of changes is the result of the economic crisis or a constant trend change in global economy.
16
5 References
Baldwin, R. 2006. ‘ Globalisation: The Great Unbundling(s)’. Helsinki: Economic Council of Finland. Baldwin, R., R. Forslid, and T. Ito. 2016. “Unveiling the Evolving Sources of Value Added in
Exports.” Joint Research Program Series No. 161, Institute of Developing Economies–Japan External Trade Organization (IDE–JETRO).
Dedrick, J., Kraemer, K.L., Linden, G. 2010. ‘Who Profits from Innovation in Global Value Chains?: A Study of the iPod and Notebook PCs. Industrial and Corporate Change.’ Vol. 19. Issue 1: 81-116.
Grossman, G.M., Rossi-Hansberg, E. 2006. ‘Trading Tasks: A Simple Theory of Offshoring.’ NBER Working Paper No. 12721.
Helpman, E., Krugman, P. 1985. Market Structure and Foreign Trade. Cambridge, MA: MIT Press. Inomata S. 2017. ‘Analytical frameworks for global value chains: An overview.’ In Measuring and
Analyzing the Impact of GVCs on Economic Development. 2017. International Bank for Reconstruction and Development.
Johnson, R.C. 2014. ‘Five Facts about Value-Added Exports and Implications for Macroeconomics and Trade Research.’ Journal of Economic Perspectives. Vol. 28. No. 2: 119–142.
Kase, K., Slocum, A., Zhang, Y. 2011. ‘Asian versus Western Management Thinking: Its Culture-Bound Nature.’ The Nonaka Series on Knowledge and Innovation. Palgrave Macmillan UK. Koopman R., Powers W., Wang Z., Wei S.J. 2010. ‘Give Credit Where Credit Is Due: Tracing Value
Added in Global Production Chains.’ NBER Working Paper No. 16426.
Koopman, R., Wang, Z., Wei, S. 2012. “Estimating Domestic Content in Exports when Processing Trade is Pervasive.” Journal of Development Economics 99 (1): 178–89.
Koopman, R., Wang Z., Wei, S.. 2014. “Tracing Value-Added and Double Counting in Gross Exports.” American Economic Review 104 (2): 259–94.
Leontief, W. Strout, A. 1963. ‘Multi-regional input-output analysis.’ In: T. Barna (ed) ‘Structural Interdependence and Economic Development.’ London. Macmillan: 119-120.
Linden, G., Kraemer, K.L., Dedrick, J. 2009. ‘Who captures value in a global innovation network?: the case of Apple's iPod.’ Communications of the ACM. Vol. 52. Issue 3: 140-144.
17
OECD, WTO. 2012. ‘Trade in value-added: concepts, methodologies and challenges (joint OECD-WTO note).’ Original OECD-OECD-WTO concept note. http://www.oecd.org/sti/ind/49894138.pdf. Accessed 07 March 2018.
Stehrer, R., Foster, N., de Vries, G. 2012. ‘Value Added and Factors in Trade: A Comprehensive Approach.’ WIIW Working paper. Vol. 80: 1-22.
UNCTAD. 2013. ‘World Investment Report 2013: Global Value Chains: Investment and Trade for Development.’
WTO. 2013. ‘Word Trade Report. Factors shaping the future of world trade.’ Published by the World Trade Organization.
Xing, Y., Detert, N. 2010. “How the iPhone Widens the United States Trade Deficit with the People’s Republic of China.” Asian Development Bank Institute (ADBI) Working Paper Series No 257, ADBI, Tokyo.
Ye, M., Meng, B., Wei, S. 2015. “Measuring Smile Curves in Global Value Chains.” IDE Discussion Paper No. 530, Institute of Developing Economies–Japan External Trade Organization (IDE– JETRO).
18
Annex
Fig 10a Poland’s position and participation index since 1995 to 2014 by industries
0% 10% 20% 30% 40% 50% 60% 0,00 0,01 0,02 0,03 0,04 0,05 0,06 0,07 0,08 1995 1997 1999 2001 2003 2005 2007 2009 2011 2013 GV C p ar ti ci p at ion in d e x GV C p oz it ion in d e x
Agriculture
0% 5% 10% 15% 20% 25% 30% 35% 40% 45% 50% 0,00 0,01 0,01 0,02 0,02 0,03 0,03 0,04 0,04 0,05 0,05 1995 1997 1999 2001 2003 2005 2007 2009 2011 2013 GV C p ar ti ci p at ion in d e x GV C p oz it ion in d e xMining
0% 10% 20% 30% 40% 50% 60% 70% 80% 0,00 0,02 0,04 0,06 0,08 0,10 0,12 0,14 0,16 1995 1997 1999 2001 2003 2005 2007 2009 2011 2013 GV C p ar ti ci p at ion in d e x GV C p oz it ion in d e xFood products
0% 10% 20% 30% 40% 50% 60% 70% -0,04 -0,02 0,00 0,02 0,04 0,06 0,08 1995 1997 1999 2001 2003 2005 2007 2009 2011 2013 G V C p ar ti ci p ati o n in d e x G V C p o zi ti o n in d e xTextiles & apparel
0% 10% 20% 30% 40% 50% 60% 70% 80% 0,00 0,02 0,04 0,06 0,08 0,10 0,12 1995 1997 1999 2001 2003 2005 2007 2009 2011 2013 GV C p ar ti ci p at ion in d e x GV C p oz it ion in d e x
Wood & paper
0% 10% 20% 30% 40% 50% 60% 70% 80% 90% 100% -0,08 -0,06 -0,04 -0,02 0,00 0,02 0,04 0,06 0,08 0,10 0,12 1995 1997 1999 2001 2003 2005 2007 2009 2011 2013 GV C p ar ti ci p at ion in d e x GV C p oz it ion in d e x
19
Fig 10b Poland’s position and participation index since 1995 to 2014 by industries
0% 10% 20% 30% 40% 50% 60% 70% 80% -0,04 -0,02 0,00 0,02 0,04 0,06 0,08 0,10 1995 1997 1999 2001 2003 2005 2007 2009 2011 2013 GV C p ar ti ci p at ion in d e x GV C p oz it ion in d e x
Chemicals
0% 10% 20% 30% 40% 50% 60% 70% 80% -0,04 -0,02 0,00 0,02 0,04 0,06 0,08 1995 1997 1999 2001 2003 2005 2007 2009 2011 2013 GV C p ar ti ci p at ion in d e x GV C p oz it ion in d e xRuber & plastics
0% 10% 20% 30% 40% 50% 60% 70% 80% 0,00 0,01 0,02 0,03 0,04 0,05 0,06 0,07 0,08 0,09 1995 1997 1999 2001 2003 2005 2007 2009 2011 2013 GV C p ar ti ci p at ion in d e x GV C p oz it ion in d e x
Non-metalic minerals
0% 10% 20% 30% 40% 50% 60% 70% 80% 90% 100% -0,06 -0,04 -0,02 0,00 0,02 0,04 0,06 0,08 0,10 1995 1997 1999 2001 2003 2005 2007 2009 2011 2013 GV C p ar ti ci p at ion in d e x GV C p oz it ion in d e xBasic metals
0% 10% 20% 30% 40% 50% 60% 70% 80% -0,04 -0,02 0,00 0,02 0,04 0,06 0,08 1995 1997 1999 2001 2003 2005 2007 2009 2011 2013 GV C p ar ti ci p at ion in d e x GV C p oz it ion in d e xFabricated metals
0% 10% 20% 30% 40% 50% 60% 70% 80% -0,04 -0,02 0,00 0,02 0,04 0,06 0,08 1995 1998 2001 2004 2007 2010 2013 GV C p ar ti ci p at ion in d e x GV C p oz it ion in d e xMachinery
20
Fig 10c Poland’s position and participation index since 1995 to 2014 by industries
0% 10% 20% 30% 40% 50% 60% 70% 80% 90% -0,15 -0,10 -0,05 0,00 0,05 0,10 1995 1997 1999 2001 2003 2005 2007 2009 2011 2013 GV C p ar ti ci p at ion in d e x GV C p oz it ion in d e x
ICT & electronics
0% 10% 20% 30% 40% 50% 60% 70% 80% -0,05 -0,04 -0,03 -0,02 -0,01 0,00 0,01 0,02 0,03 0,04 1995 1997 1999 2001 2003 2005 2007 2009 2011 2013 GV C p ar ti ci p at ion in d e x GV C p oz it ion in d e x
Electrical machinery
0% 10% 20% 30% 40% 50% 60% 70% 80% 90% -0,08 -0,06 -0,04 -0,02 0,00 0,02 0,04 0,06 0,08 1995 1997 1999 2001 2003 2005 2007 2009 2011 2013 GV C p ar ti ci p at ion in d e x GV C p oz it ion in d e xMotor vehicles
0% 10% 20% 30% 40% 50% 60% 70% 80% -0,06 -0,04 -0,02 0,00 0,02 0,04 0,06 0,08 1995 1997 1999 2001 2003 2005 2007 2009 2011 2013 GV C p ar ti ci p at ion in d e x GV C p oz it ion in d e xOther transport
0% 10% 20% 30% 40% 50% 60% 0,00 0,01 0,02 0,03 0,04 0,05 0,06 0,07 0,08 0,09 1995 1997 1999 2001 2003 2005 2007 2009 2011 2013 GV C p ar ti ci p at ion in d e x GV C p oz it ion in d e xTransport and storage
0% 5% 10% 15% 20% 25% 30% 35% 0,00 0,01 0,01 0,02 0,02 0,03 0,03 0,04 0,04 0,05 0,05 1995 1997 1999 2001 2003 2005 2007 2009 2011 2013 GV C p ar ti ci p at ion in d e x GV C p oz it ion in d e x
Financial intermediation
21
Fig 10d Poland’s position and participation index since 1995 to 2014 by industries
0% 5% 10% 15% 20% 25% 30% 35% 40% 45% 0,00 0,01 0,02 0,03 0,04 0,05 0,06 0,07 1995 1997 1999 2001 2003 2005 2007 2009 2011 2013 GV C p ar ti ci p at ion in d e x GV C p oz it ion in d e x
R&D & business services
0% 5% 10% 15% 20% 25% 30% 35% 40% 45% 0,00 0,01 0,02 0,03 0,04 0,05 0,06 0,07 0,08 1995 1997 1999 2001 2003 2005 2007 2009 2011 2013 GV C p ar ti ci p at ion in d e x GV C p oz it ion in d e x