Enhancing the Effectiveness of
Nordic Research Cooperation
POLIC Y BRIEF 1 april 2011
Nordic participation in the EU Framework Programmes
– Best practices and lessons learned
NordForsk, 2011 Stensberggata 25 N–0170 Oslo www.nordforsk.org Nordforsk P o LIC Y B r IE f 1 a P r IL 2011
NordForsk Policy Briefs 1–2011
Enhancing the Effectiveness of Nordic Research Cooperation Policy Brief 1
Nordic participation in the EU Framework Programmes – Best practices and lessons learned
NordForsk, 2011 Stensberggata 25 N–0170 Oslo www.nordforsk.org Org.nr. 971 274 255 Design: Millimeterpress AS Printed by: BK Grafisk ISSN 1504-8640
Table of ConTenTs
Preface 6
1. executive summary 7
1.1 Introduction 7
1.2 Nordic participation in FP6 and FP7 7
1.3 Nordic collaboration in FP6 and FP7 8
1.4 Outcomes of participation 9
1.5 Main challenges and success criteria 9
1.6 Best practices and lessons learned 9
1.7 Nordic participation in related instruments 9
1.8 Policy implications and recommendations 10
2. Introduction 11
3. Methodological approach 13
3.1 Analysis of Nordic participation in FP6 and FP7 to date 13 3.2 Questionnaire survey of Nordic FP6 and FP7 participants 14
3.3 Appendix to Policy Brief 1 report 17
4. Results 18
4.1 Extent of Nordic participation in FP6 and FP7 18
4.2 Nature of Nordic participation in FP6 and FP7 27
4.3 Drivers for Nordic participation in the FPs 29
4.4 Nordic demand for participation and success within the FP competitions 38
4.5 Nordic collaboration in the Framework Programmes 48
4.6 Benefits and impacts 57
4.7 Main challenges and success criteria 64
4.8 Best practices and lessons learned 68
4.9 Nordic participation in related instruments and initiatives 74
5. Conclusions and recommendations 88
5.1 Nordic participation in FP6 and 7 88
5.2 Outcomes of FP participation (benefits and impacts) 92
5.3 Nordic collaboration in FP projects 93
5.4 Main challenges associated with FP participation 94
5.5 Strategies for successful involvement in the FPs (best practices) 95 5.6 Suggestions for improving the FPs and strengthening Nordic involvement 96
5.7 Nordic participation in related ‘new’ instruments 97
5.8 Policy implications and recommendations 98
Table of fIguRes
Figure 1 Survey contacts by country 15
Figure 2 Share of possible and actual survey responses, by country 16 Figure 3 Share of participations and survey responses, by country 16 Figure 4 Share of responses, by respondent’s field of research 17 Figure 5 Nordic participation in FP6 – overall statistics 18 Figure 6 Nordic participation in FP7 – overall statistics 19 Figure 7 Nordic funding achieved from FP6 – factored by GDP 20 Figure 8 Nordic funding achieved from FP7 – factored by GDP 20 Figure 9 Nordic projects, participations and EC funding, by Priority Area 22 Figure 10 Nordic FP6 projects, participations and EC funding,
expressed as a share of FP6 totals, by Priority Area 23 Figure 11 Nordic countries’ (ranked) share of all FP6 participations, by Priority Area 24 Figure 12 Nordic FP7 projects, participations and EC funding, by FP7 Priority Area 25 Figure 13 Nordic FP7 projects, participations and EC funding,
Figure 14 Nordic countries’ (ranked) share of all FP7 participations, by Priority Area 27 Figure 15 Nordic project coordination rates in FP6 and FP7, by country 28 Figure 16 Nordic participants’ roles in aspects of their FP projects (n=811-919) 28 Figure 17 Relevance of features of FP6 and FP7 (n=944-992) 30 Figure 18 ‘Average’ relevance of features of FP6 and FP7, by country 30 Figure 19 ‘Average’ relevance of features of FP6 and FP7, by type of organisation 31 Figure 20 Alignment between FP priorities/instruments and research strategies 31 Figure 21 Extent to which FP6/7 supported participants’ research strategies, by country 32 Figure 22 Extent to which research strategies have been adjusted to better align with FP, by country 32 Figure 23 Use of mechanisms to influence FP6/7 work programmes (n=458-537) 33 Figure 24 Effectiveness of mechanisms (where used) to influence annual work programmes 34 Figure 25 Extent to which Nordic agencies / representatives have been successful in influencing the FPs 35 Figure 26 Motives for involvement in FP projects (n=944–971) 35 Figure 27 Drivers for involvement in FP projects (n=909) 37 Figure 28 Extent to which different forms of support were received in order to take part in FP6/7 projects 37
Figure 29 Effectiveness of support received 38
Figure 30 Nordic participation in FP6 proposals, by country 39 Figure 31 Nordic participation in FP6 proposals, by Activity Type 40 Figure 32 Nordic participations in FP6 proposals, by Priority Area 40 Figure 33 Nordic FP6 participation-level success rates, by country 41 Figure 34 Nordic FP6 proposal participation success rates by Activity Type 41 Figure 35 Nordic and all FP6 participation-level success rates by Priority Area 42 Figure 36 Nordic FP6 participation explained by relative success and demand, by priority area 43 Figure 37 Nordic participation in FP7 proposals, by country (to date) 44 Figure 38 Nordic participation in FP7 proposals, by Activity Type (to date) 44 Figure 39 Nordic participations in FP7 proposals, by Priority Area 45 Figure 40 Nordic FP7 participation-level success rates, by country 46 Figure 41 Nordic FP6 proposal success rates by Activity Type 46 Figure 42 Nordic and all FP7 participation-level success rates by Priority Area 47 Figure 43 Nordic participation: a comparison between Nordic relative success and demand in FP6 by priority area 48 Figure 44 Comparison of actual Nordic project involvement rates to normalised
Nordic project involvement rates within each Nordic country’s FP6 projects 49
Figure 45 Intra-Nordic FP6 links, by Nordic country 51
Figure 46 Main Nordic intra-project collaboration patterns, by FP7 Priority Area 52 Figure 47 Comparison of actual Nordic project involvement rates to normalised
Nordic project involvement rates within each Nordic country’s FP7 projects 53
Figure 48 Intra-Nordic FP7 links, by Nordic country 54
Figure 49 Main Nordic intra-project collaboration patterns, by FP7 Priority Area 55 Figure 50 The location of Nordic participants’ most important (foreign) collaboration partners 56 Figure 51 The location of participants’ most important (foreign) collaboration partners, for each Nordic country 56
Figure 52 Most important FP project outputs (n=852) 58
Figure 53 Extent to which projects have delivered outputs compared with expectations 59 Figure 54 Extent to which the ‘most important’ outputs are produced at a level ‘below expectations’ 60 Figure 55 Scale of positive impacts of FP6/7 participation on participating organisations 61 Figure 56 Exploitation of project results by different communities 62 Figure 57 Costs & benefits to Nordic partners of participation in FP6/7 projects (n=930) 63 Figure 58 Participants’ satisfaction with FP6/7 administration and reporting (n=1,038) 66 Figure 59 Nordic involvement as founding members of JTIs 76
Figure 60 Partner composition of the KICs 78
Figure 61 Involvement in ERA-NETs, by country 79
Figure 62 Involvement in ERA-NET Plus, by country 81
Figure 63 Nordic participation in Article 169 initiatives 82 Figure 64 Awareness and participation in new instruments - JTIs 85 Figure 65 Awareness and participation in new instruments - PPPs 85 Figure 66 Awareness and participation in new instruments - JPIs 85 Figure 67 Awareness of, participation in, and future plans for
involvement in new instruments, by type of organisation 86 Figure 68 Nordic participation in FP7 evaluation panels, by country 87
PRefaCe
NordForsk is a platform for joint Nordic research and research policy development. Our aim is to contribute to the development of the knowledge society in the Nordic region, and con-sequently to a globally competitive European Research Area (ERA). To implement this, our strategic actions are inter alia developing the knowledge basis for sound Nordic research- and research policy coordination, and promoting cooperation that adds value to national initia-tives in the Nordic region.
The main framework for research priorities in Europe are set in the EU, and EU research policy has wide-ranging implications for Nordic researchers and policymakers. Participation in EU research cooperation is therefore a main political priority in all the Nordic countries. The EU Framework Programme for Research and Technological Development (FP7) is, for the time being, the main instrument to respond to Europe’s needs in terms of growth and European competitiveness. FP 7 covers the entire range from basic to applied research, and represents a key pillar in the establishment of the ERA. This represents substantial opportunities for Nordic researchers. At the same time, the size and complexity of FP7 represents challenges for actors from small countries, when it comes to influencing relevant decision-making processes and mobilizing sufficient resources to fully participate.
Against this background, NordForsk has commissioned three reports to describe and ana-lyse key aspects of Nordic research cooperation in a European context, both at the research policy and – strategy level (research responsible ministries and research councils) and the research-performing level (researchers, universities and institutes). The reports have all been developed by NIFU-Step and Technopolis in cooperation with NordForsk. This second report looks into Nordic researchers’ participation in FP 7 compared to FP 6, the outcome of partici-pation, as well as main challenges and success critieria for participation. The report provides us with some very interesting findings, and concludes with a set of policy implications and recommendations to NordForsk for Nordic level actions.
I would like to thank the author, James Stroyan from the Technopolis group, as well as the rest of the project groupI for the work on this report. Furthermore, let me also express special
thanks to the Advisory BoardII for their very valuable input to the reports.
Oslo April 2011
Gunnel Gustafsson Director NordForsk
I Erik Arnold (project manager), Göran Melin, Tommy Jansson from the Technopolis group, Aris Kaloudis (coordinator), Inge Ramberg and Lisa Scordato from NIFU. Marianne Røgeberg has been NordForsk’s main responsible for the project.
II Carl Jacobsson (Swedish Research Council), Unni Nikolaysen (Norwegian Minstry of Research and Higher Education), Hans Müller Pedersen (Danish Agency for Science, Technology and Innovation), Eili Ervela- Myreen (Finland)
1. exeCuTIve suMMaRy
1.1 InTRoduCTIon
This report presents the findings of an analysis of Nordic participation in the EU Sixth Frame-work Programme (FP6) and the EU Seventh FrameFrame-work Programme (FP7), focusing on the research-performing level1. The analysis has involved the following two main elements:
A detailed analysis of the nature and extent of Nordic participation in the two FPs, based on official data provided by the European Commission. The analyses have covered levels of Nordic demand, success rates and participation within the different priority areas of the pro-grammes. A particular focus of the analysis has been on intra-Nordic collaboration within the FPs. We have also investigated Nordic participation in new related initiatives such as Joint Technology Initiatives (JTIs), Public-Private Partnerships (PPPs) and Joint Programming Initiatives (JPIs)
A questionnaire survey of all Nordic participants in FP6 and FP7 to date, covering their motives for involvement, the benefits they have derived, their views on various features of the programmes, problems they have encountered, and strategies they have for successful partici-pation. The questionnaire survey also explored participants’ knowledge of, and involvement in, related initiatives (JTIs, PPPs, JPIs)
Analyses have been carried out at both the Nordic level and the individual country level, and by type of participating organisation. Wherever possible the data has been normalised to adjust for the different sizes of the five countries and the different scales of the programme areas in which Nordic participants have been active. This allows us to see more easily where Nordic participation has been relatively strong or weak, and which of the five countries have contributed most to that performance, given their relative size and overall level of involvement.
1.2 noRdIC PaRTICIPaTIon In fP6 and fP7
The results of the study have shown that the Nordic countries have had a strong and active involvement in FP6 and FP7 to date (see Section 4.1). They have taken part in almost a third of the projects, and have accounted for almost 10% of the participations and just over 10% of the EC funding allocations. Normalising the Nordic share of funding to take account of the relative size of the Nordic countries and their RTD bases has further confirmed that perfor-mance has been strong, with the Nordic countries featuring as among the most successful when general scale factors (such as GDP and population) are used. FP funding returns to the Nordic countries appear to be less strong when RTD-related measures are used to normalise the data (e.g. GERD and FTE researchers), due to the relatively high levels of investment in RTD in the Nordic region.
Within the different FP priority areas (research fields) the Nordic countries’ relative involve-ment rates have been highest in the Sustainable developinvolve-ment / environinvolve-ment; Food; Life sci-ences / health; Coordination of activities; Euratom / nuclear fission; Security; and Science in Society areas (see Sections 4.1.4 and 4.1.5). The study has identified which of the Nordic countries have contributed most to the level of performance in each area. The study has also identified whether performance in each area is primarily driven by high / low levels of demand or high / low success rates within the competition (see Section 4.4). Nordic success rates have been above the FP6 and FP7 averages, overall and in most of the priority areas. This informa-tion should be of utility to Nordic and nainforma-tional-level policymakers in judging whether demand, success rates and involvement levels are above or below the expected levels, given their own understanding of national and Nordic research strengths, and should enable them to take 1 Analyses carried out at the policy and strategy levels and the results of interviews with FP participants at
corrective action where necessary.
Nordic participants in FP6 and FP7 have taken an active, often central or major role, in their FP projects (see Section 4.1.5). Nordic coordinator rates are above the overall averages for FP6 and FP7 and the amount of EC funding received per participation is higher for the Nordic countries than the average amounts received across all FP projects and by other participants in Nordic projects.
Nordic participants have signalled that both FP6 and FP7 priority areas, calls and instru-ments have been of high relevance (see Section 4.3). In most cases the FPs have helped to support the implementation of participants’ institutional research strategies, and most par-ticipants have adjusted their own research strategies to some extent in order to bring them more into alignment with the opportunities offered through the FPs. Almost half of Nordic participants have also taken steps to influence the work programmes and calls to ensure a good alignment with their own interests. A range of mechanisms for doing this have been identified and judged, based on the feedback obtained, on their relative effectiveness. Most of the actions taken were rated as of medium-high effectiveness. Conversely, a majority of Nordic FP participants feel that Nordic agencies’ and representatives’ efforts to influence the programmes have been either not effective or only effective to a small extent. Furthermore, many participants are not aware of actions being taken by Nordic representatives to influence the programmes, so it is clear that more could be done to raise the visibility and possibly also the effectiveness of measures in this area. Many commentators believe that steps should be developed to improve coordination and communication between relevant agencies, and significant numbers believe that a coordinated Nordic strategy for FP engagement should be developed and implemented. This should be based around collective action in areas of Nordic strength, and go hand in hand with better alignment between national, Nordic and EU-level RTD funding and support. It also appears necessary for Nordic-level agencies and representa-tives to raise their visibility.
1.3 noRdIC CollaboRaTIon In fP6 and fP7
A focus of the study has been on Nordic collaboration within the FPs and we have found that there is a very high level of Nordic collaboration, well above the ‘normalised’ levels (see Section 4.4.6). Almost half of the FP6 and FP7 projects with Nordic participation involved Nordic collaboration, and Nordic collaboration levels between each pairing of countries runs at between two and three times the normalised rate. For some of the countries (e.g. Iceland and Norway) the collaboration rates were far higher (up to six times the normalised level). Based on these analyses Norway and Iceland collaborate most strongly, followed by Sweden and Finland, as compared to normalised levels of collaboration. Our analyses have also high-lighted the strongest relative collaboration patterns (i.e. pairings) between the Nordic countries in each of the FP6 and FP7 priority areas. This information should be useful in determining whether the patterns of collaboration meet expectations and whether any expected strong collaborations are not present, possibly prompting the need for further investigation / action.
Nordic participants’ most important collaboration partners tend to be based in Germany, the United Kingdom and France, although Sweden, Finland, Denmark and Norway all feature among the ‘top ten’ country of origin for each of the Nordic countries’ most important collabo-ration partners. Almost half of the Nordic participants in FP6 and FP7 have actively sought out other Nordic partners for their projects, citing cultural factors, geographic proximity, expertise and shared (often Nordic) interests as their primary motives for doing this. However, a minor-ity of participants believe that a Nordic focus is not desirable, as the best (i.e. most capable) partners should be sought no matter where they are based.
The vast majority of Nordic participants in FP6 and FP7 have accessed some form of support at the institutional or national-level. A wide range of suggestions have been put forward as
ways in which such support can be enhanced, many of which ask for improvements to existing services. There appears to be good potential for Nordic agencies to play a role in identifying and sharing good practice in support provision across the Nordic region.
1.4 ouTCoMes of PaRTICIPaTIon
The findings of the study have shown that the motives for participation in the FPs are broadly the same across the different countries and the different participant groups, and relate pri-marily to the acquisition of research funding, the strengthening and expansion of networks and the development of new knowledge. The more commercial motives for involvement are emphasised by only a minority of participants.
Nordic actors achieve significant benefits from the programme, largely in line with expecta-tions (see Section 4.6). The major benefits enjoyed by participants come in the form of new and improved relationships and networks, the transfer and development of skills, capabilities, knowledge and tools, enhanced reputation and image and increased competitiveness both internationally and nationally.
For most participants the benefits of FP involvement outweigh the costs. Positive outcomes are attributed to the significant networking and knowledge benefits enjoyed, while negative outcomes tend to be attributed to the high transaction and administrative costs associated with participation.
1.5 MaIn Challenges and suCCess CRITeRIa
The main challenges associated with FP involvement revolve around the complexity of the rules and procedures and the high administrative burden associated with the management of FP projects (see Section 4.7). These aspects attract widespread criticism but it should be noted that the majority of Nordic FP participants are either neutral or positive as regards FP procedures. The aspects that attract the most criticism include project monitoring and report-ing procedures and audits, although many participants also expressed dissatisfaction with application procedures, contract negotiations, end of project sign-off and mechanisms for pay-ment of the EC’s financial contributions. It is felt that the more regular and larger participants can learn (and afford) to cope with these complexities but that small organisations and new entrants struggle disproportionately. As a result, support should be mainly focused on these groups. There appears to be a good case for Nordic agencies to (i) apply further pressure on the Commission to simplify the arrangements and (ii) explore mechanisms by which the national support systems in the Nordic countries can share and evolve best practices.
1.6 besT PRaCTICes and lessons leaRned
The study has also identified a range of strategies that participants employ to maximise the benefits of their involvement and ensure a successful outcome from their projects. These are detailed in the report (see Section 4.8) but in particular include (i) ensuring that projects are of high relevance to the programme calls and to the participants, (ii) establishing a strong team that can manage both the research and administrative aspects, (iii) ensuring strong coordina-tion and management of the project with a clear division of labour, (iv) maintaining good com-munication throughout, and (v) taking all opportunities to derive value from the knowledge creation and networking opportunities presented. There is scope for Nordic agencies to ensure that such strategies are disseminated as widely as possible so that all Nordic participants can benefit from this collective experience.
1.7 noRdIC PaRTICIPaTIon In RelaTed InsTRuMenTs
Nordic involvement in the newer initiatives such as Joint Technology Initiatives (JTIs), Joint Programming Initiatives (JPIs) and Public-Private Partnerships (PPPs) appears strong,
although the evidence as to the extent of Nordic involvement is not clear in all cases (see Sec-tion 4.9). Based on feedback obtained from FP6 and FP7 participants, their awareness of these new initiatives appears to be rather low and so it follows that more could be done to notify Nordic researchers about the opportunities that exist and provide advice and support in order to assist their involvement. Actions to raise awareness at the Nordic level could therefore be useful.
1.8 PolICy IMPlICaTIons and ReCoMMendaTIons
In overall terms we can conclude that the Nordic countries have played and continue to play a full and active role in the Framework Programmes and perform at a good level. The main suggestions for action at the Nordic level to build on this success and maximise Nordic involve-ment in the FPs and the benefits derived are as follows:
n The development of a joint Nordic strategy for FP participation, identifying the areas of common interest and using this as a basis for influencing the programmes (to enhance alignment) and as the basis for promoting Nordic research capabilities in FP priority areas
n The development of improved information on Nordic-level activities and capabilities as the basis for action to strengthen Nordic collaboration. This should involve the creation and ongoing support of Nordic networks and related network activities (workshops, plan-ning meetings, etc.) in order to boost collaborative efforts
n Increased Nordic-level representation in Brussels, in order to exert greater Nordic influence on FP planning, work programmes, calls, etc. and to increase the visibility of Nordic capabilities. Nordic agencies should use this platform as a means to apply further pressure on the Commission to simplify the administrative arrangements and to remove non-value-adding administrative and reporting requirements
n General improvement in the prioritisation and reward / incentive systems for participa-tion in the Framework Programmes. This could include improved funding arrangements to support FP participation, involving (i) Nordic or national-level funding that is aligned to FP priorities and that can support capability-building and the subsequent continua-tion, dissemination and exploitation of FP activities, (ii) improved availability of match-ing fundmatch-ing for FP participation, and (iii) financial support towards the costs of proposal preparation and partnership formation
n Increased sharing of good practice between national and institutional-level support pro-viders, and the provision of more targeted national support to new and smaller partici-pants that lack their own institutional-level support
n Improved identification and sharing of information on successful strategies for FP par-ticipation, building on the significant experience built up by participants and national representatives
In addition we recommend that the Nordic agencies and representatives take action to increase their visibility to Nordic research communities, including clarification of their respective roles, responsibilities and activities.
Finally, we recommend that the Nordic agencies work with national agencies to increase awareness of the opportunities offered by the new instruments (JTIs, JPIs, PPPs) and to share good practices and lessons learned.
2. InTRoduCTIon
This paper presents the principal findings of an analysis of two key sets of data and informa-tion relating to Nordic participainforma-tion in the EU SixthFramework Programme and the EU Seventh Framework Programme (to date):
n Factual data on Nordic participation in the main FP6 and FP7 programmes, taken from the European Commission’s E-CORDA database and supplemented by data from the DG RTD on Nordic participation in proposals submitted under the two FPs
n Feedback and testimony collected through a questionnaire survey of all Nordic partici-pants in FP6 and FP7 to date
The information contained in these two data sets has been used insofar as possible to investi-gate, analyse and assess the key aspects of Nordic participation in FP6 and FP7 at the research-performing level. We have focused on addressing the following main areas of enquiry: Nordic participation in the EU Sixth and Seventh Framework Programmes
Our analyses have focused on the extent of Nordic participation in FP6 and FP7 to date, looking at project involvement rates, participation rates and funding received. The analyses have considered Nordic performance overall, by individual country, and by type of partici-pating organisation, and have investigated relative levels of performance within the different priority areas of both FP6 and FP7 (Section 4.1)
n Analysis of the nature of Nordic participation in FP6 and FP7, assessing the roles played by the Nordic participants in their projects in order to judge the extent to which Nordic actors are playing a central or more peripheral role in the various activities (Sec-tion 4.1.5)
n Analysis of the drivers for Nordic participation in the FPs, investigating participants’ motives for becoming involved, the relevance of the programmes, alignment with insti-tutional research strategies and mechanisms for influencing the work programmes and calls. We have also gathered feedback on the use and utility of national support systems directed towards Nordic applicants and participants (Section 4.3)
n Analysis of Nordic success rates within the competitive bidding processes employed by the FPs. The analysis begins by looking at levels of demand for participation as revealed by Nordic participation in proposals and goes on to provide details of the rela-tive success rates of the Nordic applicants in each priority area of FP6 and FP7. Levels of actual participation in FP6 and FP7 projects are then explained with reference to the interplay between levels of demand and levels of success within the appraisal and selec-tion process (Secselec-tion 4.4)
n Analysis of Nordic collaboration within FP6 and FP7 projects, investigating the extent to which Nordic collaboration occurs above ‘normalised’ levels based on each country’s relative level of involvement overall. The main priority areas of FP6 and FP7 where Nor-dic collaboration is strongest are identified, and the main features of those collaborative relationships are explored (Section 4.4.6)
n Wherever possible we have sought to place Nordic participation in FP6 and FP7 in con-text, by normalising the data to account for the different sizes of the countries involved, the different scales of the priority areas, and the different levels of involvement of specific groups. The full analysis of Nordic participation in FP6 and FP7 and the full results of our questionnaire survey have been written up and provided to NordForsk as an appen-dix to this report.
The outcomes realised as a result of participation in FP6 and FP7
n Analysis of the principal outcomes (benefits and impacts) of FP participation, cover-ing the outputs sought and produced through the projects, the benefits realised, the exploitation of project results and overall cost:benefit ratios realised by Nordic partici-pants (Section 4.6)
The main challenges and success criteria associated with FP6 and FP7
n Analysis of the main challenges and success criteria associated with FP participa-tion, as revealed by Nordic participants through responses to our questionnaire survey (Section 4.7)
Best practices and lessons learned in relation to participation and achievement of outcomes
n Analysis of the lessons learned and best practices identified and the main recommen-dations put forward by Nordic participants, based on their experience of FP participation (Section 4.8)
Nordic participation in new, related instruments (EIT, JTIs, etc.)
n In addition to the analysis of Nordic participation in FP6 and FP7, information and data on Nordic participation in related initiatives (or ‘New instruments’) has been collected and analysed, and the key findings are presented in Section 4.9. It should be noted how-ever that the data on Nordic participation is in some cases patchy and in others is simply not available at this point in time. The related initiatives that we have looked at include the European Institute of Technology (EIT), European Technology Platforms (ETPs), Joint Technology Initiatives (JTIs), Joint Programming Initiatives (JPIs, ERA-NETs, ERA-NET Plus, Article 169 initiatives), and Public-Private Partnerships (PPPs)
We then go on to present our conclusions and recommendations concerning Nordic participa-tion in the EU Framework Programmes and related initiatives, based on the results obtained (Section 5).
3. MeThodologICal aPPRoaCh
The results presented in this document are based on two main elements of the work pro-gramme, namely (i) analysis of factual data on Nordic participation in the main FP6 and FP7 programmes, and (ii) design and implementation of a questionnaire survey of Nordic FP6 and FP7 participants. Further details of the methodological approach to these two elements are presented below.
3.1 analysIs of noRdIC PaRTICIPaTIon In fP6 and fP7 To daTe
Our analysis of Nordic participation in FP6 and FP7 is based primarily on data contained in the European Commission’s E-CORDA database. Access to the database is provided to national authorities, and NordForsk sought permission from the Commission to use the database for this study. Once approval had been granted the full databases were transferred to Technopolis / NIFU STEP for processing.
The databases were provided in Microsoft Access format and provided complete listings of FP6 and FP7 projects and participations as follows:
n Project lists – All funded FP6 and FP7 projects were listed, showing the project title; acronym; contract number; specific programme; priority area; type of instrument; number of contractors; total project cost (€); EC contribution (€); contract signature date; start date; end date; duration; and activity code(s)
n Participation lists – All participations in FP6 and FP7 projects were listed, showing the contract number (enabling a link to project-level fields); participant organisation name; organisation ID number; role in the project; eligible costs (€); EC contribution requested (€); postal address; country code; organisation legal status; organisation activity type; organisation NUTS code; contact person name; contact person email address
In addition the FP7 E-CORDA data set provided a full list of proposals submitted under FP7 calls along with full lists of all participations in these proposals. Equivalent data for FP6 was not available through the E-CORDA database but the Commission provided a full list of Nordic participations in FP6 proposals along with summary tables on the numbers of proposals (and participations in proposals) for FP6 as a whole. These data allowed us to investigate levels of demand for participation in FP6 and FP7 by Nordic actors and to calculate their success rates within the competitions.
The data sets on the main FP6 and FP7 programmes were supplemented by data and other information on a number of related instruments / initiatives (such as ETPs, JTIs, PPPs, etc.) taken from websites. Information on Nordic participation in these initiatives was requested from the Commission but in response it was stated that such data were not available. We have therefore relied on whatever data is available from Cordis and other initiative-specific websites in order to compile a picture of Nordic involvement in these ‘new’ instruments.
The data sets at our disposal were transferred to Excel spreadsheets and analysed in order to produce simple statistics that show the level of Nordic participation from a number of per-spectives. In most cases simple counts and frequency distributions were sufficient to reveal the extent of Nordic involvement and identify any significant differences by country. Wherever possible the Nordic participation was placed in the context of FP participation as a whole, so that the Nordic shares could be revealed. Wherever the data was used to support judgements about the relative ‘performance’ of the Nordic countries within the programmes the data was ‘normalised’ to take account of the different sizes of the countries involved, the priority areas, and so on.
3.2 QuesTIonnaIRe suRvey of noRdIC fP6 and fP7 PaRTICIPanTs 3.2.1 Questionnaire development
The study methodology was required to include a survey, directed to Nordic participants in FP6 and FP7. It was agreed that the questionnaire should be directed to all Nordic participants in the two Framework Programmes, but that these participants would only be asked to com-plete one copy of the questionnaire, answering on behalf of themselves or their organisation / research group, rather than in relation to a specific project.
Technopolis developed a preliminary draft of a questionnaire survey, with the question set being designed to address the various information requirements necessary for the study, and focusing on elements that could not be answered through the analysis of participation data or that would not be better addressed through the programme of interviews. A copy of the full survey questionnaire can be found in the appendix to this report. It consisted of 30 core questions, covering the following main areas:
n Levels of involvement in FP6 and FP7 projects and proposals
n The relevance of FP6 and FP7 and their alignment with research strategies
n Nordic / institutional strategies for influencing the Framework Programmes and their effectiveness
n The importance of different drivers and motives for participation
n The importance of R&D and innovation outputs, and their successful delivery
n The realisation of tangible and intangible benefits / impacts, plus any negative impacts of participation
n The exploitation of project results
n Costs and benefits of participation and reasons for the (im)balance
n Project partners and roles in projects
n The international orientation of research and role of Nordic collaboration
n Feedback on FP6/7 administration and reporting
n Use and effectiveness of national FP support
n Recommendations (e.g. for influencing the FP and increasing its relevance, improving processes and national / institutional support, successfully managing involvement and maximising the benefits derived)
A draft questionnaire was submitted to NordForsk in March 2010 for comment and a small number of revisions were then made based on the feedback received. The revised question-naire was then uploaded to a professional online survey facility and final checks and adjust-ments to formatting were made.
Danish participants
Technopolis had also recently undertaken a national evaluation relating specifically to Danish involvement in the Framework Programmes. This evaluation included a questionnaire survey of Danish participants, covering some of the same topics to those listed above and duplicating some questions to be used in the Nordic survey. As such, a second version of the Nordic FP questionnaire was developed for those participants in Denmark that had recently completed the Danish FP questionnaire. This shorter version covered only those questions (n=15) that had not already been posed in the previous national questionnaire.
3.2.2 Preparation of contact databases
In parallel with the development of the questionnaire, Technopolis analysed and prepared the contact information relating to Nordic participants in FP6 and FP7. The FP6 and FP7 databases showed that Nordic countries had 10,018 participations in total across the two Framework
Programmes. In most but not all cases (~8,600) the database included the name and email address of the participant. Roughly 23% of these cases related to ‘multiple’ participations by the same person, so there were in fact 6,615 individuals (or ‘participants’) who could receive the survey request. Figure 1 below shows the breakdown of numbers of contacts by Nordic country.
FP6
participations FP7 participations Total participations Participations with email Participants with email
Denmark 1,641 599 2,240 1,924 1,460 Finland 1,440 632 2,072 1,792 1,352 Iceland 132 60 192 172 122 Norway 1,299 467 1,766 1,484 1,175 Sweden 2,648 1,100 3,748 3,195 2,506 Nordic Total 7,160 2,858 10,018 8,567 6,615
fIguRe 1 – suRvey ConTaCTs by CounTRy
3.2.3 survey implementation
On Wednesday, 14 April 2010, emails were sent to the 6,615 Nordic FP6 and FP7 participants that had been identified, with a request to participate in the survey (including 348 Danish par-ticipants who had previously completed the Danish FP questionnaire and were therefore sent a request to complete the shorter version). The deadline for completion of the questionnaire was set at 7 May 2010, giving respondents nearly four weeks in which to provide a response.
Within the first few hours of the mailout a number of ‘undeliverable’ messages were received as well as several ‘out of office’ messages. In addition, some of the targeted individuals were identified as having already ‘opted out’ of receiving questionnaires distributed through our online survey tool. Taking the undeliverable and ‘opt out’ messages together, we can estimate that our request failed to reach 1,480 people, leaving us with a pool of possible respondents numbering 5,135 (including 287 possible short-survey Danish respondents).
Response rates were tracked over the period the survey was live and reminder emails were sent a few days before the deadline to all of the participants that had not responded to the survey or had not ‘opted out’ by those dates. The reminder emails restated the importance of the exercise, and encouraged participants to complete the questionnaire by the deadline. The questionnaire was held open for a further week following the published deadline for receipt of completed questionnaires, after which we proceeded to analyse the results.
3.2.4 survey response rates
A total of 937 respondents provided a useable questionnaire return, giving an overall response rate of just over 18% (based on the 5,135 possible respondents). Figure 2 shows the number of possible and actual responses for each country and the resulting response rate. A response rate of at least 15% was achieved in each case.
fIguRe 2 – shaRe of PossIble and aCTual suRvey ResPonses, by CounTRy Participants
emailed Possible respondents Responses Response rate
Denmark* 1,460 1,069 221 21% Finland 1,352 1,045 154 15% Iceland 122 99 24 24% Norway 1,175 940 212 23% Sweden 2,506 1,981 326 17% Nordic Total 6,615 5,135 937 18%
*In addition, there were 224 responses to the original Danish survey from individuals not included in the above table (i.e. they did not respond to the new survey). Including these responses increased the total number of Danish responses to 445 and the total number of Nordic responses to 1,161 (but only for a sub-set of questions).
Although the number of responses varies quite considerably by country, the distribution of responses between countries is broadly in line with their overall share of all Nordic participa-tions in FP6/7, as can be seen in Figure 3 below.
fIguRe 3 – shaRe of PaRTICIPaTIons and suRvey ResPonses, by CounTRy FP6/7
participations Respondents % of all participations % of all respondents
Denmark 2,240 221 22% 24% Finland 2,072 154 21% 16% Iceland 192 24 2% 3% Norway 1,766 212 18% 23% Sweden 3,748 326 37% 35% Nordic Total 10,018 937 100% 100% 3.2.5 survey analysis
The survey responses were downloaded from the online survey tool and checked prior to analysis. The responses from the three surveys (Nordic, Nordic-short, Danish) were also com-bined into a single set of results. The number of responses received was slightly higher than shown in the figures above, but a number of respondents were found to have only completed basic information about themselves and had not answered any of the main survey questions. These were removed prior to analysis and are not included in the numbers presented. It is also important to note that some respondents skipped certain questions and so the sample size varies between questions. The actual number of respondents providing an answer to a question is used as the basis of calculations within the analysis and is indicated in the heading or final column of the relevant figure.
When answering the questionnaire, respondents were asked to represent the views of their research group or organisation, as appropriate. Most participants from universities (HEIs), research institutes and large companies will therefore have answered on behalf of their research group or unit, while participants from small businesses are more likely to have answered from the perspective of their organisation as a whole. Respondents were asked to make their own choice as to what they considered as an appropriate level at which to respond. Finally, respondents were asked to answer from their own personal perspective if they felt unable to talk on behalf of their organisation or research group.
The questionnaire data was analysed in order to determine the pattern of responses for each question. In a small number of cases separate analyses were carried out by certain sub-groups of respondents. In the case of open questions, where a large number of (often 300+) detailed qualitative responses were given, we have presented summaries of this information in the
main results and then presented the comments in full under group headings in an appendix to this report.
basic information on survey respondents
At the start of the survey questionnaire, respondents were asked to provide some basic infor-mation about themselves (their field of research), their organisation (the organisation type) and their own personal level of involvement in FP6 and FP7 (number of proposals submitted and projects participated in). A brief analysis of the responses provided is presented below. Field of research
Respondents were asked which of a list of 10 broad areas best described their field of research and the results are presented in Figure 4 below. The figure shows that a broad range of individ-uals responded to the survey, covering each of the 10 fields shown. However, while some fields are well-represented (e.g. life sciences and environmental sciences, with 16%+ of respondents each), relatively few respondents classified themselves to certain other fields (e.g. mathemati-cal sciences and humanities).
fIguRe 4 – shaRe of ResPonses, by ResPondenT’s fIeld of ReseaRCh
Count % of total
Life sciences (biology, biotechnology, etc.) 199 18%
Environmental sciences (earth sciences, marine
science, etc.) 178 16%
IT and computer science 138 13%
Materials science and mechanical engineering 136 13%
Social sciences 126 12%
Medical sciences 116 11%
Physics and related sciences 94 9%
Chemistry and chemical engineering 59 5%
Humanities 23 2%
Mathematical sciences 16 1%
Total 1,085 1,085
Organisation type
The questionnaire also asked respondents to indicate which of a list of six organisation types best described the organisation to which they are affiliated, or to provide an alternative clas-sification. The spread of responses showed that HEIs accounted for the largest share (41%), followed by research institutes (19%) and companies (15%). Other respondents are affiliated to public authorities or agencies (6%) and other types of organisation (4%). The distribution of responses by organisation type is broadly in line with the profile of Nordic participants in FP6 and FP7.
3.3 appendix to Policy brief 1 report
An appendix to this report has been prepared and includes an extended set of information developed through our analyses of the participation databases and the questionnaire results. This appendix, which stands at ~200 pages in length, has been provided to NordForsk as accompanying material to this report.
4. ResulTs
4.1 exTenT of noRdIC PaRTICIPaTIon In fP6 and fP7
This section presents factual information about Nordic participation in FP6 and FP7, based on the European Commission’s E-CORDA database.
overall participation in fP6 and fP7 by nordic organisations
Figure 5 and Figure 6 present overall statistics on Nordic participation in FP6 and FP7 respec-tively. The key features of these data are as follows:
n In FP6 the Nordic countries collectively participated in almost a third (31.6%) of the projects, made up 9.6% of the participations, and received 10.3% of the funding contribu-tions provided by the European Commission (EC)
n In FP7 (to date) the Nordic countries have participated in a slightly lower share of the projects (28.7%) and accounted for a slightly lower share of the participations (9.4%) as compared to FP6. However, the Nordic share of EC funding contributions is slightly higher in FP7 to date (10.5%) as compared to FP6
n At an individual level the five Nordic countries have different participation rates and funding shares based largely on the relative size of their RTD communities, with Sweden occupying the largest share and Iceland the smallest
n In terms of the share of FP projects in which they were involved, four of the five Nordic countries have seen a small fall from FP6 to FP7, with Iceland being the only country that has increased its share
n The changes from FP6 to FP7 in terms of the share of all participations achieved by the Nordic countries are more varied, with Finland and Norway increasing their shares slightly, Iceland and Sweden maintaining theirs, and Denmark seeing a small decline in its share
n In terms of the share of all FP funding allocations, three of the five Nordic countries saw a small decrease in their share from FP6 to FP7, the exceptions being Finland and Sweden, both of which have an increased share of FP7 funding (to date) as compared to FP6 It should be noted, however, that FP7 is still underway and continues to issue calls for pro-posals and make new funding decisions in relation to those calls. It is therefore likely that a slightly different level of performance in FP7 may be achieved by the Nordic countries by the time that programme comes to a close. These results should therefore be treated as pro-visional.
fIguRe 5 – noRdIC PaRTICIPaTIon In fP6 – oveRall sTaTIsTICs
Country No. of projects Share of projects Partici- pations Share of participations EC funding Share of EC funding
Denmark 1,121 11.1% 1,641 2.2% € 395,766,034 2.4% Finland 1,008 10.0% 1,440 1.9% € 342,386,630 2.1% Iceland 103 1.0% 132 0.2% € 24,099,497 0.1% Norway 845 8.4% 1,299 1.7% € 284,071,608 1.7% Sweden 1,717 17.1% 2,648 3.6% € 677,153,972 4.1% Nordic 5 3,183 31.6% 7,160 9.6% € 1,723,477,741 10.3%
Source: FP7 participation data (E-CORDA, December 2009)
Country No. of projects Share of projects Participations Share of participations EC funding Share of EC funding
Denmark 467 9.1% 599 2.0% € 202,186,165 2.2% Finland 439 8.6% 632 2.1% € 227,724,060 2.5% Iceland 57 1.1% 60 0.2% € 15,303,374 0.2% Norway 330 6.5% 467 1.5% € 138,194,678 1.5% Sweden 771 15.1% 1,100 3.6% € 387,329,807 4.2% Nordic 5 1,464 28.7% 2,858 9.4% € 970,738,085 10.5%
fIguRe 6 – noRdIC PaRTICIPaTIon In fP7 – oveRall sTaTIsTICs
4.1.2 nordic fP6 and fP7 funding in context
While it is relatively easy to identify each Nordic country’s level of involvement in FP6 and FP7, these data alone do not tell us a great deal about whether the participation levels or amounts of funding received are indicative of strong or weak performance. In order to begin to make such judgements, it is necessary to normalise the data in order to take account of the different sizes of the countries involved and the differing scales of their RTD communities.
Many national evaluations ask the question of whether the relative share of funding received from the FPs is above, in line with, or below a notional ‘expected’ level based on that country’s relative share of GDP. This tends to be the preferred indicator, as GDP is used as the basis for deciding each country’s relative contribution to the EU budget from which FP funding is derived. In 2004 (i.e. at the mid-point of FP6), the Nordic countries’ share of EU GDP (out of the 25 Member States + Norway and Iceland) was 8.0%. The Nordic countries’ share of FP6 funding allocations to the EU-25+IS+NO was 11.1%, so on this basis their level of return was (+40%) higher than we might have expected given their share of EU GDP (8.0%).
Figure 7 shows how each of the Nordic countries and the Nordic 5 as a whole performed based on their FP6 funding, factored by GDP.
Figure 8 shows how each of the Nordic countries and the Nordic 5 as a whole performed based on their FP7 funding, again factored by GDP. The main features of the data presented in the two figures are as follows:
n The Nordic 5 have performed reasonably well within FP6 and FP7 based on their share of the EC funding factored by the size of their GDP. In both of the programmes the share of funding achieved is higher than we might have expected based on their share of GDP
n Looking at the Nordic countries individually, four of the five countries occupy ranked positions within the top half of the list, achieving funding shares between 40% and 64% above the ‘expected’ levels in FP6 and between 33% and 128% above the ‘expected’ levels in FP7. Norway is the exception, achieving funding shares 5% and 32% below the ‘expected’ levels in FP6 and FP7 respectively
n The performance of the Nordic 5 collectively in FP7 to date is slightly stronger than that achieved in FP6, as signified by the overall ranked position of the Nordic 5 in the two programmes (6th in FP7 out of 25 countries as compared to 8th in FP6 out of 23 coun-tries). However, the ratio of FP funding share to GDP share for the Nordic 5 as a block has remained broadly the same from FP6 to FP7
n Two of the Nordic countries (Iceland and Finland) have improved their funding ratios and ranked positions from FP6 to FP7, and two other countries (Denmark and Norway) have seen their funding ratios and ranked positions decline. Sweden has improved its funding ratio from FP6 to FP7 but only at a level sufficient to maintain its position out of the countries featured. It is not appropriate to draw any firm conclusions at this time about these changes as FP7 is ongoing and the situation may well change significantly as further rounds of funding decisions are made
Country FP6 funding (€ million) Share of EU25+IS & NO FP6 funding Share of EU25+IS & NO GDP (2004) Ratio of share of FP6 funding
to share of GDP Rank out of 27 countries2
Denmark 396 2.6% 1.8% 140% 11th Finland 342 2.2% 1.4% 156% 8th Iceland 24 0.2% 0.1% 157% 5th Norway 284 1.8% 1.9% 95% 18th Sweden 677 4.4% 2.7% 164% 4th Nordic 5 1,723 11.1% 8.0% 140% 8th
Sources: FP6 participation data (E-CORDA, September 2009) and Eurostat (GDP data)
fIguRe 7 – noRdIC fundIng aChIeved fRoM fP6 – faCToRed by gdP
fIguRe 8 – noRdIC fundIng aChIeved fRoM fP7 – faCToRed by gdP Country FP7 funding (€ million) Share of EU27+IS & NO FP7 funding Share of EU27+IS & NO GDP (2008) Ratio of share of FP7 funding to
share of GDP Rank out of 29 countries3
Denmark 202 2.4% 1.8% 133% 12th Finland 228 2.7% 1.4% 189% 3rd Iceland 15 0.2% 0.1% 228% 2nd Norway 138 1.6% 2.4% 68% 23rd Sweden 387 4.6% 2.6% 180% 4th Nordic 5 971 11.6% 8.3% 139% 6th
Sources: FP7 participation data (E-CORDA, September 2009) and Eurostat (GDP data)
A number of other ways to ‘normalise’ the FP funding achieved by the Nordic countries have been explored. The features of the countries that have been used to normalise the data are (i) population, (ii) Gross Expenditure on R&D (GERD), and (iii) the number of full-time equivalent (FTE) researchers. The main findings for each of these measures are as follows:
n In both FP6 and FP7 (to date) the Nordic 5 (as a group) were ranked 1st and achieved an EC funding share that was more than twice the level we might have expected given their (collective) share of the population. In FP6 Iceland, Sweden and Denmark occupied the top three ranked positions on this measure and in FP7 these countries plus Finland held the four highest ranked places. It is therefore clear that when judged against the size of their populations the Nordic countries have achieved very high levels of funding under both FP6 and FP7, indicating a very strong performance overall
n Despite their relatively small population sizes, the Nordic countries have a relatively high level of investment in R&D. As a result, our analysis of the Nordic countries’ share of FP funding against their share of Gross Expenditure on R&D (GERD) revealed a rather different perspective on their performance within the FPs, with the Nordic countries performing relatively poorly. In FP6 all of the Nordic countries were ranked low on this measure (between 18th and 24th out of the 27 countries included in the analysis) and in FP7 only Iceland managed to achieve a ‘mid-table’ position, with the other four Nordic
2 In calculating the ranked position of the Nordic 5 (collectively) in FP6 we treated the five countries as a single entity and ranked the Nordic 5 alongside the remaining 22 countries. The overall ranked position of 8th for the Nordic 5 overall should therefore be taken as 8th out of 23 countries rather than 8th out of 27 countries
3 In calculating the ranked position of the Nordic 5 (collectively) in FP7 we treated the five countries as a single entity and ranked the Nordic 5 alongside the remaining 24 countries. The overall ranked position of 6th for the Nordic 5 overall should therefore be taken as 6th out of 25 countries rather than 6th out of 29 countries
countries appearing close to the bottom of the list (ranked between 22nd and 27th out of the 29 countries included). This raises the question as to whether, when viewed in these terms, the Nordic countries are performing at a sufficiently high level or whether correc-tive action is needed at either the Nordic or the national level. There is no easy answer to this question, but it should be noted that all of the major R&D performing countries (e.g. the United Kingdom, Germany, France, Austria, etc.) appear at the foot of the table. It therefore seems that the Framework Programmes ‘correct’ in some way for the different levels of (national) R&D expenditure by boosting (disproportionately) R&D investment in countries that have relatively low levels of national expenditure on R&D
n The final way in which we normalised the share of FP6 and FP7 funding received by the Nordic countries was to factor it by the share of FTE researchers in each country. On this measure Nordic performance appears to be more reasonable, with the Nordic 5 col-lectively being ranked 11th in FP6 and 9th in FP7. Individually the Nordic countries were ranked between 10th and 21st in FP6 (out of 27 countries) while in FP7 they were ranked between 7th and 15th (out of 29 countries)
In conclusion, it is clear from our analyses that Nordic performance appears strong when cer-tain ‘general’ measures are used to factor the results (e.g. when we place FP funding received in the context of relative shares of GDP and population) but appears less strong when more ‘research’ based indicators are used to factor the level of funding received (e.g. number of FTE researchers and in particular GERD). Perhaps more importantly, we can see that on most of the measures Nordic performance has strengthened slightly from FP6 to FP7.
4.1.3 nordic fP6 and fP7 participation by type of organisation
In order to further explore the features of Nordic involvement in FP6 and FP7, analyses were conducted to review the profile of participation by type of organisation (also referred to as ‘activity’ type). The main findings can be summarised as follows:
n Nordic higher education institutions (HEIs) accounted for 43% of Nordic participations in FP6 and 45% of Nordic participations in FP7 (to date). Theses shares are slightly above those accounted for by HEIs within FP6 and FP7 as a whole (36% and 39% respectively), suggesting a strong performance by Nordic universities vis-à-vis the other types of organisation participating in the programme. However, we believe that this difference is mainly structural and can be explained by the fact that in the Nordic countries a greater proportion of public R&D is carried out by HEIs than by research institutes, a pattern that can also be observed in other countries (e.g. the United Kingdom)
n Nordic industry (private commercial businesses)accounted for 19% of Nordic partici-pations in FP6, exactly in line with the share of participartici-pations accounted for by indus-try within FP6 as a whole (i.e. for all countries). In FP7 (to date) Nordic indusindus-try has accounted for 24% of Nordic participations, slightly below the 26% share accounted for by industry within FP7 as a whole. However, given that FP7 is still underway it is perhaps too early to infer much from this small deviation
n Nordic research institutes accounted for 23% of Nordic participations in FP6 and have accounted for 22% of Nordic participations in FP7 to date. Within FP6 and FP7 as a whole, research institutes have taken a 28% and 26% share of all participations respec-tively, so it is clear that within the Nordic countries the research institute sector is less present
n Finally, within the Nordic countries ‘other’ types of organisation (mainly public sector bodies, NGOs, etc.) occupied a 15% share of Nordic participations in FP6 and a 10% share within FP7. Within FP6 as a whole ‘other’ organisations accounted for a 17% share of FP6 participations and a 9% share of FP7 participations to date. We can therefore say that Nordic involvement by ‘other’ organisations is broadly in line with the FP averages
It can therefore be concluded that in broad terms the profile of Nordic involvement in FP6 and FP7 by organisation type is in line with ‘expected’ levels, based on the profile for all countries within these two programmes. The only significant difference is that Nordic HEIs occupy a larger share of the Nordic participations and research institutes a smaller share, as compared to the overall profile for all countries. It is felt that this difference is due to the different make-up of the research base in the Nordic countries rather than as a result of a differential level of performance by these two groups.
4.1.4 nordic participation in fP6 by priority area
FP6 was subdivided into 17 priority areas, each of which is described in terms of a specific research field or area of research activity.
Figure 9 lists the 17 FP6 priority areas and shows for each the number of Nordic projects and participations, and the volume of EC funding allocated to Nordic participants. Due to the differing scales of the different priority areas within FP6 it is not possible to draw conclu-sions on the performance of the Nordic 5 from this table, but in terms of numbers alone the
Information society technologies, Sustainable development and Human Resources and mobility areaswere the most significant, with over 400 projects, over 670 participations and in excess of €148 million in funding achieved by the Nordic countries in each. The Human resources and mobility priority area dominated in terms of the number of projects, whereas
Sustainable development accounted for the highest number of Nordic participations and the highest amount of allocated funding.
fIguRe 9 – noRdIC fP6 PRojeCTs, PaRTICIPaTIons and eC fundIng, by PRIoRITy aRea
Priority area Projects Participations EC funding
1. Life sciences, genomics and biotechnology 339 765 € 283,817,435
2. Information society technologies 488 1,174 € 317,976,592
3. Nanotechnologies and nanosciences 218 527 € 157,588,038
4. Aeronautics and space 106 193 € 56,580,018
5. Food quality and safety 105 379 € 128,218,701
6. Sustainable development 403 1,293 € 332,870,316
7. Citizens and governance 92 202 € 28,646,595
Policy support / S&T needs 269 516 € 68,054,279
Horizontal research activities – SMEs 226 560 € 52,984,645
Support for international cooperation 67 98 € 18,296,017
Research and innovation 86 179 € 25,941,577
Human resources and mobility 522 673 € 148,039,018
Research infrastructures 70 144 € 45,976,273
Science and society 61 95 € 7,787,630
Support for the coordination of activities 71 208 € 33,855,710
Development of R&I policies 11 16 € 1,040,647
Euratom 49 138 € 15,804,250
Total 3,183 7,160 € 1,723,477,741
Source: FP6 participation data (E-CORDA, September 2009)
In order to place the raw numbers shown in Figure 9 into context, Nordic projects, participa-tions and EC funding have been expressed as a share of the FP6 totals for each priority area. The results are shown in
Figure 10, and arrows () have been used to symbolise whether the Nordic 5 has formed comparatively strongly or less well in each area, as compared to Nordic overall per-formance in FP6. For example, across FP6 as a whole the Nordic 5 accounted for 9.6% of the
participations, so we can say that a participation rate of 9.0% in the Nanotechnologies and nanosciences area is ‘close to average’ () while involvement in 11.2% of Life sciences par-ticipations is ‘above’ average ().
The results indicate that Nordic project involvement rates were highest in the Support for the coordination of activities (70%), Euratom (63%), and Citizens and governance (63%) priority areas. These areas tend to be associated with larger projects involving participants from many countries, so the high project involvement rates are attributable mainly to the nature of the instruments used in these areas.
The relative shares of participations and funding tend to be better indicators of perfor-mance, as the types of instruments used to implement the priorities exert less of an influ-ence. On these two measures the Nordic countries have been strongest in the Support for the coordination of activities, Food quality and safety, and Sustainable development
areas.In addition, the Nordic block has performed well in terms of participation in Policy support, Euratom, Horizontal research activities(SMEs) and Human Resources and mobility actions.
fIguRe 10 – noRdIC fP6 PRojeCTs, PaRTICIPaTIons and eC fundIng, exPRessed as a shaRe of fP6 ToTals, by PRIoRITy aRea
Priority area Project share Participation share EC funding share
1. Life sciences, genomics and biotechnology 57% 11.2% 12.1%
2. Information society technologies 45% 8.2% 8.4%
3. Nanotechnologies and nanosciences 49% 9.0% 10.3%
4. Aeronautics and space 44% 5.5% 5.3%
5. Food quality and safety 57% 11.8% 17.1%
6. Sustainable development 61% 12.4% 14.5%
7. Citizens and governance 63% 10.4% 11.7%
Policy support / S&T needs 52% 11.2% 11.3%
Horizontal research activities - SMEs 46% 10.3% 11.0%
Support for international cooperation 20% 3.9% 5.2%
Research and innovation 36% 9.7% 11.5%
Human resources and mobility 11% 8.0% 8.8%
Research infrastructures 45% 7.8% 6.3%
Science and society 38% 9.3% 10.0%
Support for the coordination of activities 70% 17.3% 11.8%
Development of R&I policies 58% 9.5% 7.6%
Euratom 63% 11.6% 8.5%
Total 31.6% 9.6% 10.3%
Source: FP6 participation data (E-CORDA, September 2009)
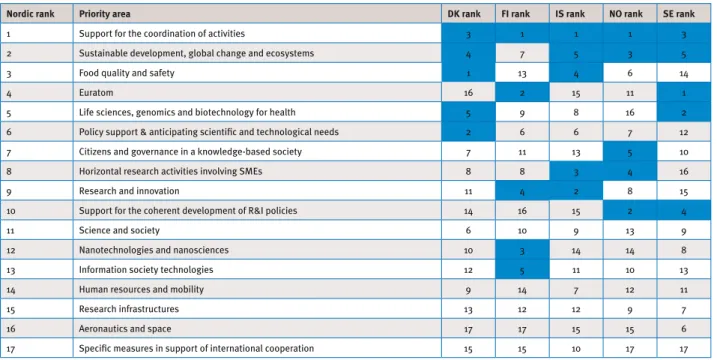
Additional analyses were conducted to calculate the share of all participations achieved by each of the five Nordic countries in each of the priority areas. This information can help us to understand which of the five Nordic countries have been responsible for the level of Nordic performance identified. Figure 11 lists the 17 FP6 priority areas in ranked order (based on the Nordic share of all participations) and also shows the ranked position of each priority area for each individual country, based on that country’s share of all FP6 participations. It shows that in some cases a high ranked position for the Nordic 5 overall can be attributed to a strong performance by all or most of the Nordic countries within that priority area. This is the case for Support for the coordination of activities and Sustainable development. However, in other ‘strong’ areas just one or two countries drive the performance. This is the case in Food quality and safety (with Denmark, Iceland and to a lesser extent Norway driving the result)
and in Euratom (where Finland and Sweden are the key players). In the Life sciences area Sweden and Denmark are the two Nordic countries with relatively high levels of participation.
Elsewhere in the table we can see that certain Nordic countries have major strengths in specific priority areas but there is relatively low involvement by the other Nordic countries, leading to a position where the priority area is ranked fairly low for the Nordic 5 as a whole. This is the case in the Nanotechnologies and nanosciences area where Finland accounted for a relatively high share of the participations (Finland’s third highest share) but where the other four Nordic countries did not feature particularly strongly. A similar pattern is found in the Information society technologies area, ranked 5th for Finland in terms of its relative share of all FP6 participations but ranking fairly low for the other Nordic countries.
fIguRe 11 – noRdIC CounTRIes’ (Ranked) shaRe of all fP6 PaRTICIPaTIons, by PRIoRITy aRea
Nordic rank Priority area DK rank FI rank IS rank NO rank SE rank
1 Support for the coordination of activities 3 1 1 1 3
2 Sustainable development, global change and ecosystems 4 7 5 3 5
3 Food quality and safety 1 13 4 6 14
4 Euratom 16 2 15 11 1
5 Life sciences, genomics and biotechnology for health 5 9 8 16 2
6 Policy support & anticipating scientific and technological needs 2 6 6 7 12
7 Citizens and governance in a knowledge-based society 7 11 13 5 10
8 Horizontal research activities involving SMEs 8 8 3 4 16
9 Research and innovation 11 4 2 8 15
10 Support for the coherent development of R&I policies 14 16 15 2 4
11 Science and society 6 10 9 13 9
12 Nanotechnologies and nanosciences 10 3 14 14 8
13 Information society technologies 12 5 11 10 13
14 Human resources and mobility 9 14 7 12 11
15 Research infrastructures 13 12 12 9 7
16 Aeronautics and space 17 17 15 15 6
17 Specific measures in support of international cooperation 15 15 10 17 17
Source: FP6 participation data (E-CORDA, September 2009)
4.1.5 nordic participation in fP7 by priority area
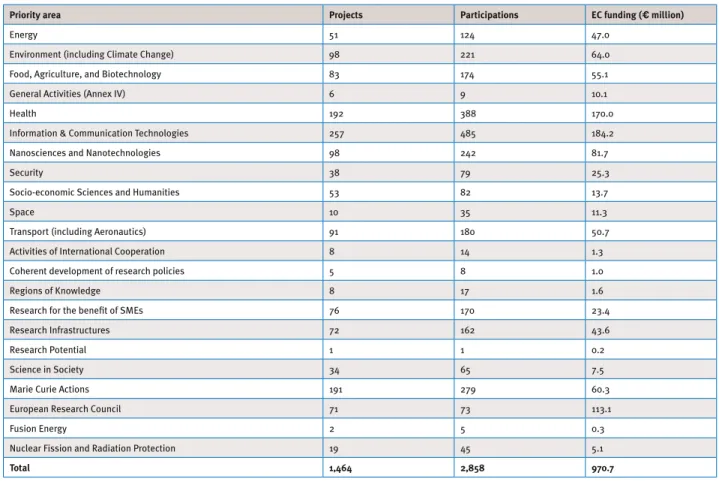
FP7 is structured into a total of 22 priority areas. Figure 12 shows the number of Nordic projects and participations, and the volume of EC funding allocated to date, in each. The figure shows that the Information and Communications Technologies and Health areashave been the most significant to date in terms of raw numbers, with over 190 projects, over 380 participa-tions and in excess of €170 million in funding achieved by the Nordic countries in each area. The European Research Council, Environment, Nanosciences and nanotechnologies and
Marie Curie actions are alsosignificant areas in monetary terms with in excess of €60 million achieved by the Nordic participants in each area to date.