INSTITUTE
of
TRANSPORT
and
LOGISTICS
STUDIES
The
Australian
Key
Centre
in
Transport
and
Logistics
Management
The
University
of
Sydney
Established under the Australian Research Council’s Key Centre Program.
WORKING
PAPER
ITLS
‐
WP
‐
15
‐
24
Working
while
travelling:
what
are
implications
for
the
value
of
travel
time
savings
in
the
economic
appraisal
of
transport
projects?
By
Baojin Wang
1and David Hensher
1 Transport for NSW, Australia
December 2015
ISSN 1832‐570X
transport projects?
ABSTRACT: In the current practice of the economic appraisal of transport projects, the value of travel time savings (VTTS) for business trips is derived from the Cost Saving Approach (CSA) whereby travel time savings were valued at the Marginal Product of Labour (MPL), defined as the average wages plus on costs. This approach has been adopted nationally by Austroads and Transport for NSW, and internationally by UK and other European countries. It assumes that business travellers do not undertake any productive activities while travelling and that all travel time savings will be used for business and not leisure. Supported by portable computing devices, there is a view that an increasing proportion of business travellers and commuters work while travelling. On the other hand, a significant proportion of business travel time savings has been used for leisure instead of work. This paper uses the Hensher Equation developed in the 1970s to obtain an alternative valuation of contemporary business travel time savings by introducing two productivity foregone corrections for (1) the productive use of travel time, and (2) unproductive use of business travel time savings. The purpose of this paper is to translate recent research on the valuation of business travel time savings into practical tools for incorporation in economic appraisal methods.
KEY WORDS: value of business travel time savings, The Hensher equation, productivity in travel, project evaluation
AUTHORS: Wang and Hensher
CONTACT: INSTITUTE OF TRANSPORT AND LOGISTICS STUDIES
(H73)
The Australian Key Centre in Transport and Logistics Management
The University of Sydney NSW 2006 Australia Telephone: +612 9114 1824
E-mail: [email protected] Internet: http://sydney.edu.au/business/itls
1
1. Introduction
The value of travel time savings (VTTS) is the single most important economic parameter used in the economic appraisal of the user benefits of transport projects. An analysis of recent transport projects in NSW, for example, indicates that time savings converted to dollars via the VTTS account on average for 85% of all user benefits associated with urban freeway projects. For urban public transport (light rail and heavy rail projects) and regional highway projects, the estimates are 44% and 34% respectively1. This paper examines the potential influence on the VTTS of business trips associated with two features:
Productivity achieved while travelling. The advent of technologies such as internet enabled laptops, tablets and smart phones enable people to work on the train, bus, ferry and in the car.
Leisure use of business travel time savings. Although the Cost Saving Approach (CSA) assumes that all business travel time savings will be used for work, leisure use has been found to account for a significant proportion of total business travel time savings, which has behavioural and economic implications on the business VTTS.
The paper is organised into five sections. The existing literature is reviewed in the following section. In section three, the Hensher equation will be used as the theoretical framework for two productivity foregone corrections that are designed to account for productivity gains made while travelling and the leisure use of the business travel time savings. The implications on economic appraisal and transport demand forecasting will be discussed in section four, with concluding remarks provided in the final section.
2. Review of existing approaches
In Australia, the value of travel time savings (VTTS) was first used in economic appraisal by the Commonwealth Bureau of Roads in 1972 (Austroads 1997, p. 3). Since then, the VTTS has been separately estimated for business trips and private trips.
2.1 The VTTS for business trips
The CSA has been used for valuing business travel time savings in Australia since the start of the formal economic appraisal of transport projects in the 1970s (Austroads 1997, p.10). This approach assumes that travel time outlaid on business trips is unproductive, and is a full cost to an employer. Thus, savings in business travel time converts non-productive time to productive use. In a competitive labour market, the value of an employee’s working time to the economy is fully reflected in their earnings. The value of business travel time savings is thus equal to the wage plus on costs (which include superannuation, worker compensation, long service leave, leave loading and other benefits). Table 1 summarise the VTTS for business trips that is currently recommended for use in NSW. The CSA approach is associated with a number of underlying assumptions:
Travel time is totally unproductive which means that people do not do any productive work while travelling.
All business travel time savings is used for work and not for leisure. Travel time cannot be ‘saved’ in the sense of being stored and accumulated for future use. It can only be transferred from one activity to another (Truong and Hensher 1985, p. 438). If a transport improvement
1 Based on the authors analysis of the economic appraisal of 10 large projects in NSW. As the sample
Working while travelling: what are implications for the value of travel time savings in the economic appraisal of transport projects?
Wang and Hensher
2
reduces travel time, then a travel activity can be transferred to either working or more leisure time.
Time is divisible in its use. Every minute of time savings is equally valuable. For example, delivery drivers could find some productive activities between two scheduled delivery jobs.
Employees are indifferent (i.e., have the same preference) between business travel time and work time. The marginal disutility of travel during working hours is equal to the marginal disutility of working.
A competitive labour market condition is prevalent in which firms hire labour to the point where the value of the marginal product is equal to the wage rate plus on costs. Thus the value of a unit of time transferred between travelling and working is equal to the marginal gross cost of labour.
Table 1 Value of travel time of business trips (in June 2014 dollars)
Mode Car drivers and
passengers (A)Truck Drivers (A)Bus drivers (B)Briefcase travellers in other modes Business VOT ($/hr) $48.45 $26.81 -$29.64 $28.36 $48.45 Source: TfNSW (2013, p. 230)
(A) Values are from employer’s perspective that includes wage plus oncosts. Values vary depending on industrial agreements or awards.
(B) The briefcase travellers are people using the transport system for employer’s business purposes including business meetings inside or outside of the firm or to meet a client or secure a contract. Travel is purely a means to get to the destination, and the traveller may be able to work or think during the journey.
There are a number of the criticisms of the traditional set of assumptions underlying the business VTTS, especially that the productive use of travel time should be taken into account. For example, in the Australian High Speed Rail Study (AECOM et al. 2013) with a capital cost of 93bn in 2012 dollars, the value of business travel time savings was estimates at $38/person hr for short regional trips, $81/person hr for long regional trips and $57/person hr for inter-city trips (AECOM et al. 2013, p361). The total economic benefits for the 30 year evaluation period were estimated at $180bn. Among it, 52% is from business users (mainly business travel time savings), 26% from private users and the remaining 22% from externalities, residual values and operator surplus (AECOM et al. 2013, p378). Another example is the UK’s £32bn High Speed Rail (known as HS2) project where the largest component of the monetised benefits came from the time savings of business travellers. The assessment of benefits assumes that workers cannot use their journey time productively. Critics pointed out that many people work on the train, and the productivity achieved whilst travelling implies that the travel time savings is less valuable. In the HS2 project, sensitivity tests have been undertaken by reducing the business VTTS by one third or one half to adjust productive work while travelling (Curtis 2012, UK House of Commons Transport Committee 2011, p. 65). The existing literature points in one direction – the value of business travel time savings would be greatly reduced if the productivity made while travelling is included in an economic appraisal (Wardman et al. 2013, Curtis 2012).
2.2 The VTTS for private trips
The willingness to pay (WTP) approach has been used to estimate the value of private travel time savings. Most of the values used in recent times are derived from stated preference (SP) surveys in which travellers are asked to trade-off between travel time and cost. In almost all SP survey designs, the productive use of travel time has not been used as a survey design attribute. Thus, it has not directly entered the value of travel time savings estimate. However, SP is a contextual survey in that some survey
3
respondents may envisage the ability of working on a train, a bus or in a car. Whether the ability to working while travelling is implicit in VTTS estimates is not known.
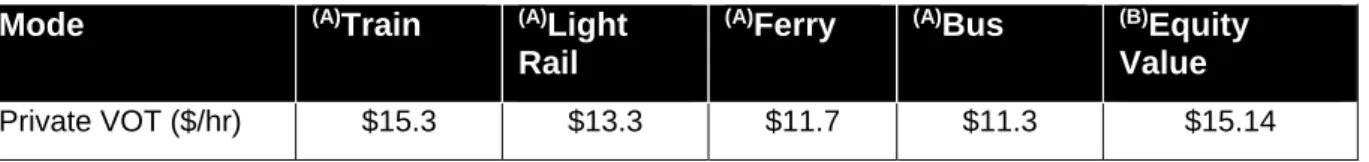
An individual’s behavioural ‘willingness to pay’ for travel time savings has been found to vary by income, trip purpose, comfort and the urgency of the journey. The VTTS also varies by transport modes mainly because of socio-economic characteristics of user groups served by different modes. Recent WTP values in Sydney are summarised in Table 2. In economic appraisal, if the VTTS is based on individuals’ behavioural values which are highly related to income, investment decisions will be biased towards projects in higher income areas and/or highway projects (usually car users have a higher VOT than public transport users). The interests of public transport users and lower income individuals, who may already suffer from relatively lower mobility and accessibility, will be given a lesser weight. For this reason, an equity value has been recommended by Transport for NSW. This approach has also been used by UK and recently adopted by NZ from July 2014.
Table 2 Value of travel time of private trips (in June 2014 dollars)2
Mode (A)Train (A)Light
Rail
(A)Ferry (A)Bus (B)Equity
Value
Private VOT ($/hr) $15.3 $13.3 $11.7 $11.3 $15.14
Source: (A) Estimated VOT in recent stated preference surveys in Sydney from Douglas (2014a). (B) Equity value based on 40% of the average weekly earnings assumed in Austroads (1997) and adopted by TfNSW (2013, p. 231), applicable for all modes.
Waiting and walking values on private trip purposes are usually attached to a higher value based on SP results that travellers strongly dislike waiting or walking. However, in-vehicle, waiting and walking have been assigned the same value (wage + oncosts) for business trips. It is also worth noting that VTTS used for demand modelling should be based on behavioural values to accurately simulate the trip decision making and mode choice. Behavioural values are often different to those used in economic appraisal and a resource cost correction is needed if behavioural values are directly used for estimating economic values, for example in the logsum approach. Bray (2006) provided the resource cost correction method for economic benefits and travel demands estimated from variable trip matrix.
3. Productivity foregone corrections
To reconcile the discrepancy between the CSA assumptions that all business travel time is unproductive and all travel time savings is used productively, and the reality that many people work while travelling and some business travel time savings are leaked to more private leisure time, this paper introduces two productivity foregone corrections.
1. A productivity foregone correction to account for working while travelling. If a business traveller does work whist travelling, the productivity achieved while travelling is lost if travel time is reduced.
2. A productivity foregone correction to account for the leisure use of business travel time savings. If travel time savings are used for leisure, the productivity in the leisure time is foregone, and the travel time savings should be valued lower.
Working while travelling: what are implications for the value of travel time savings in the economic appraisal of transport projects?
Wang and Hensher
4
These corrections are applicable for car drivers and passengers and briefcase travellers in public transport modes (bus, train, ferry and light rail) in urban areas who are on business-related trips of which there is a mix of trading travel for leisure time and for work-time. For bus, train, truck and delivery vehicle drivers, these corrections are not applicable as the driving time is considered unambiguously income earning time. In addition, the value of travel time savings is often captured as labour cost in operating costs in cost benefit analysis for train and bus drivers. These corrections are applicable for taxi passengers but should be excluded to taxi drivers. Corrections are applicable for long distance business travellers by car, train, coach and high speed rail. The theory is also applicable for business travels by air. However, air is excluded in the paper due to lack of data and evidence. Both corrections will reduce the VTTS for business trips. To estimate these corrections, we will use the Hensher equation as the theoretical framework.
3.1 Hensher equation
The framework incorporating working while travelling existed as early as 1970s. The Hensher equation (Hensher 1977, Fowkes et al. 1986) provides a theoretical mechanism in that the Value of Travel Time Savings (VTTS) for business trips can capture the effects of the productivity achieved while travelling, possible use of travel time savings for leisure and work purposes, fatigue of travel and traveller’s preference between travel time and office time:
VTTS = (1 – r – p*q)*MPL + MPF + (1 - r)*VW + r*VL (1) Where:
r = the proportion of business travel time savings that is used for leisure instead of additional working hours. (1-r) is the proportion of travel time savings that is used for working.
p = the proportion of travel time that is used for working by engaging in productive activities.
q = the relativity of the productivity of working while travelling (on train or bus) to working at the workplace.
MPL = the Marginal Product of Labour which is traditionally used as the value of business travel time in the Cost Saving Approach (CSA).
MPF = the Marginal Product of Fatigue reduction. Travel time reduction would reduce worker fatigue from travelling which in turn increases the productivity of working hours.
VW = employee’s value of time at workplace relative to travel time. From employee’s point of view, there is no tangible difference in utility between business travel time and workplace time thus it has been found VW = $0 in most studies.
VL = employee’s value of leisure time which is usually equal to the value of private travel time. The Hensher equation has been regarded as an appealing method of estimating the value of business travel time savings. At various times, it has been the basis of official appraisal guidance in the Netherlands, Norway and Sweden (Wardman et al. 2013, Beca Carter Hollings and Ferner et al. 2002). Recently, Batley (2014) provided a new derivation of the equation from first principles.
The Hensher equation clearly indicates that the value of the business travel time savings has beneficiary value components to both employers and employees. The first two terms (MPL+MPF) in equation (1) are values to employers, comprising the proportion of travel time savings that is used for working and the additional productivity of reduced travel fatigue. When people do work while travelling, any travel time savings means that the time availability for working while travelling is also reduced. The productivity foregone from travel time savings imposes a negative effect on employers. The productivity gain while travelling is measured as p*q*MPL. The remaining two terms (VW+VL) are values to employees, comprising the proportion of time savings used for leisure and value of personal preference of spending the equivalent amount of time in work relative to leisure.
5
In practice, the Marginal Product of Labour (MPL) and employee’s value of leisure time (VL) can be considered as given. For example, TfNSW (2013, p. 231) provides the business and private VTTS as part of the economic appraisal parameters to be used in NSW. The Hensher equation requires the estimation of five additional parameters: r, p, q, MPF and VW. It is particularly difficult to estimate the extra output of reduced travel fatigue (MPF) resulted from a shorter travel time and the value of personal preference of spending time in work relative to leisure (VW). Attempts have been made to simplify the equation and some empirical studies have suggested that these two terms (MPF and VW) are close to zero (Wardman et al. 2013; Mackie et al. 2003). The simplified, or often referred to modified Hensher equation, is:
VTTS = (1 – r)*MPL + r*VL – p*q*MPL (2)
The modified Hensher equation indicates that the value of travel time savings has three components: 1. (1 – r)*MPL - the proportion of travel time savings used for working that is valued at the
Marginal Product of Labour.
2. r*VL - the proportion of travel time savings used for leisure that is valued at the leisure time value.
3. p*q*MPL – a correction for productivity gained while travelling.
The simplified Hensher equation is applicable for briefcase travellers. It is also applicable for business travel in general where travel time is distinguished from working time (for example, a plumber travels to the customer site and if this is not income-earning (or billable) time then it is a trade with leisure time). However, it will not be applicable for bus and train operators, professional drivers (taxi and delivery drivers). For these people, driving is working and thus any productivity foregone correction is double counting. The equation was initially developed for valuing business travel time savings. It is generally not applicable for commuter or other private travel time savings because the private VTTS is derived from stated preference surveys which might have indirectly captured some utility of enabling working while travelling on train or other modes. Another difference is that it is unlikely that travel time savings for commuter trips will be used for working.
3.2 The productivity foregone correction accounting for working while travelling
The productivity gain from working while travelling can be expressed as:Productivity = p • q • Journey Time • MPL (3)
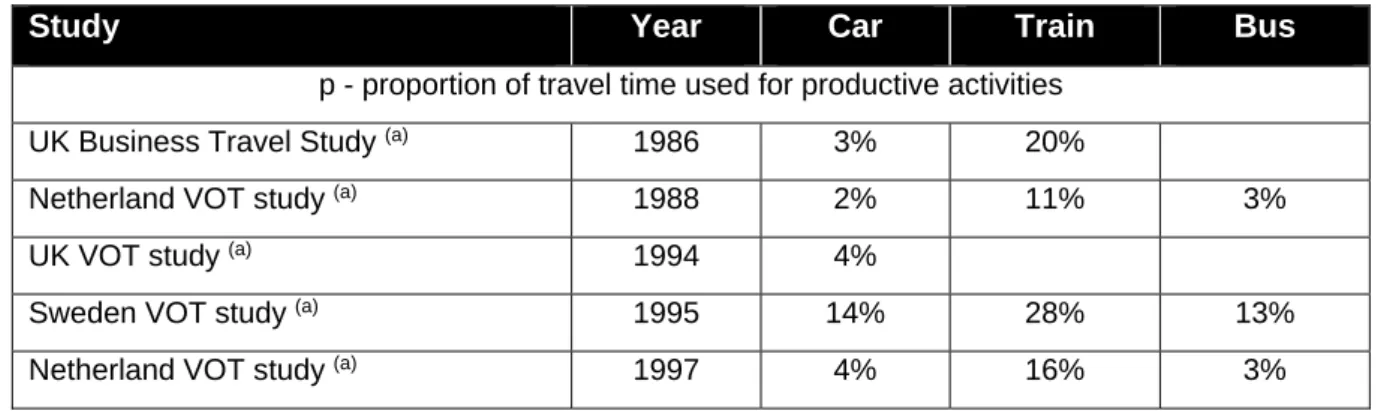
A review of international evidence from 1977 to 2013 has identified the likely values for p and q as presented in Table 3.
Table 3 International studies on p and q values
Study Year Car Train Bus
p - proportion of travel time used for productive activities
UK Business Travel Study (a) 1986 3% 20%
Netherland VOT study (a) 1988 2% 11% 3%
UK VOT study (a) 1994 4%
Sweden VOT study (a) 1995 14% 28% 13%
Working while travelling: what are implications for the value of travel time savings in the economic appraisal of transport projects?
Wang and Hensher
6
Norway VOT Study (a) 1997 3% 18% 6%
NZ Study (b) 2002 22%
Swiss VOT study (a) 2003 30%
UK National Passenger Survey (NPS)
(c) 2004 30%
UK Study of the Productive Use of Rail
Travel-time (SPURT) (c) 2009 46%
Sydney Train Quality Study (d) 2013 27%
Most likely p value (median) 4% 24% 5%
q - relativity of working efficiency in travel time to workplace
UK Business Travel Study (a) 1986 101% 95%
Netherland VOT study (a) 1988 90% 89% 93%
UK VOT study (a) 1994 102%
Sweden VOT study (a) 1995 101% 103% 93%
Netherland VOT study (a) 1997 90% 89% 93%
Norway VOT Study (a) 1997 32% 39% 20%
NZ Study (b) 2002 93%
Swiss VOT study (a) 2003 98%
UK Study of the Productive Use of Rail
Travel-time (SPURT) (c) 2009 97%
Most likely q value (median) 93% 95% 93%
Sources: (a) Wardman et al. (2013). (b) Beca Carter Hollings and Ferner et al. (2002). (c) Mott MacDonald et al. (2009). (d) Douglas (2014a)
7
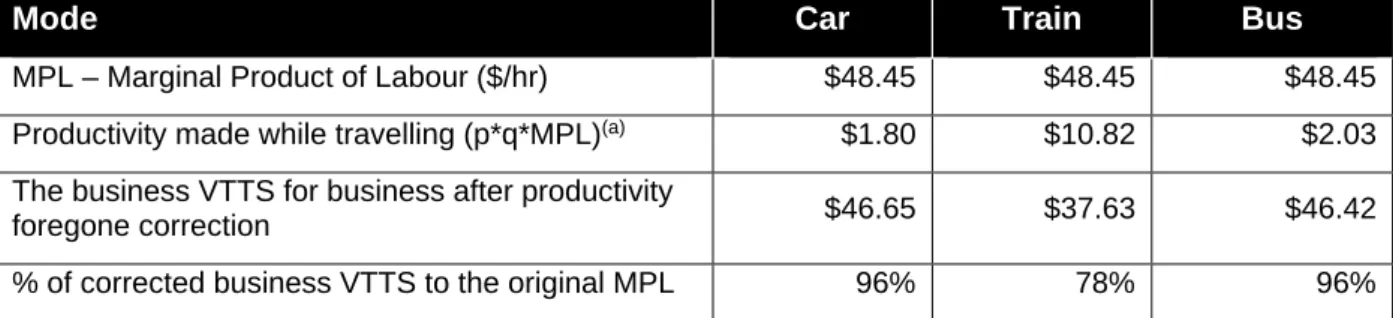
The proportion of the business travel time used for working is very low for car and bus. For business trips, car occupancy ranges from 1.1 in urban to 1.3 in rural (TfNSW 2013, p. 231) contexts. Thus, the majority of car users are drivers which constrain their capacity for working while driving. (However, they can think about work, discuss with passenger or make a hands free telephone call on work related issues). The ride quality of car and bus also limits the use of a laptop or work. However, international evidence suggests that, on average, a quarter of the business travel time on train was used for work. This would have significant impacts on VTTS if the productivity impact while travelling is incorporated. Table 3 also shows that people could work almost as efficiently while travelling as in the workplace. Three studies in the UK and Sweden even claimed that people could work more productively while travelling (q>100%), because they were away from normal office distractions. On average, people can work 93% as efficiently as in the workplace in bus and car. For train, it is a little better at 95%3. Table 4 shows the productivity foregone correction on business travel time savings. The average productivity foregone is around $1.80 for car, $10.82 for train and $2.03 for bus. After the correction, the business VTTS are around 96%, 78% and 96% of the original MPL for car, train and bus respectively. It shows that the productivity foregone correction is small for car and bus but it is significant for train.
Table 4 The productivity foregone correction on the business VTTS accounting for working while travelling
Mode Car Train Bus
MPL – Marginal Product of Labour ($/hr) $48.45 $48.45 $48.45
Productivity made while travelling (p*q*MPL)(a) $1.80 $10.82 $2.03
The business VTTS for business after productivity
foregone correction $46.65 $37.63 $46.42
% of corrected business VTTS to the original MPL 96% 78% 96%
Note (a) The most likely p and q values in Table 3 are used for the productivity foregone correction
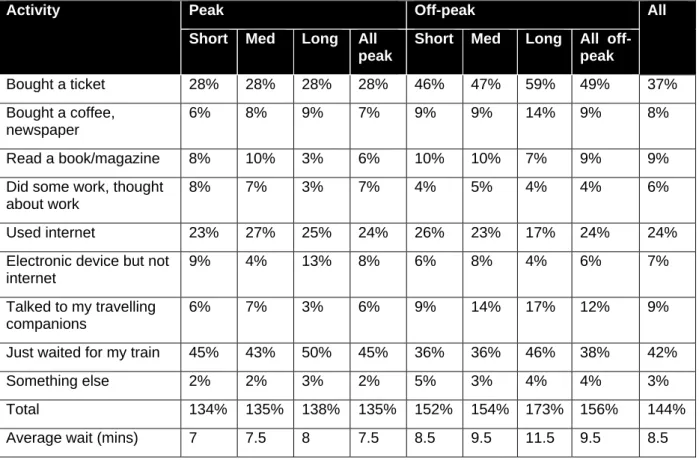
For train and bus, the productivity correction is applied to in-vehicle time. The correction is not applied to access, waiting and egress time as each period tends to be shorter; we assume that people are not likely to work. Theoretically, the correction can be made for these time periods if detailed access, egress and wait time of specific projects is available. A recent survey of Sydney train users suggests that 6% of travellers do some work in waiting time and 31% travellers possibly work by using the internet or electronic device, as shown in Table 5; although many of these activities might be marginal activities in contrast to average activities associated with income-earning activity.
3 This is more relevant to marginal activities but not always true for average activities. For details, see
Working while travelling: what are implications for the value of travel time savings in the economic appraisal of transport projects?
Wang and Hensher
8
Table 5 Passenger activities at stations
Activity Peak Off-peak All
Short Med Long All
peak
Short Med Long All
off-peak Bought a ticket 28% 28% 28% 28% 46% 47% 59% 49% 37% Bought a coffee, newspaper 6% 8% 9% 7% 9% 9% 14% 9% 8% Read a book/magazine 8% 10% 3% 6% 10% 10% 7% 9% 9%
Did some work, thought about work
8% 7% 3% 7% 4% 5% 4% 4% 6%
Used internet 23% 27% 25% 24% 26% 23% 17% 24% 24%
Electronic device but not internet
9% 4% 13% 8% 6% 8% 4% 6% 7%
Talked to my travelling companions
6% 7% 3% 6% 9% 14% 17% 12% 9%
Just waited for my train 45% 43% 50% 45% 36% 36% 46% 38% 42%
Something else 2% 2% 3% 2% 5% 3% 4% 4% 3%
Total 134% 135% 138% 135% 152% 154% 173% 156% 144%
Average wait (mins) 7 7.5 8 7.5 8.5 9.5 11.5 9.5 8.5
Source Douglas Economics (2015)
3.3 The productivity foregone correction accounting for the leisure use of business travel
time savings
Business travel time savings can be used either for work or leisure, although the Cost Saving Approach assumes that all business travel time savings will be used for work. Figure 1 provides a schematic explanation on how business travellers will likely use the travel time savings under various scenarios using a simplified normal working hour construct.
9 Figure 1 Schematic explanation of the possible use of travel time savings: short term and long term
For business trips starting from home at early morning and ending in business hours, travel time savings might initially be assigned to work in the short term. In the longer term, travellers may adjust their travel behaviour by departing later; thus the travel time savings might go to leisure. For business trips starting from business hours and ending after-hours, travel time savings may be transferred to leisure. Within business hours, all business travel time savings would technically be used for work. The general inference is:
For business trips, travel time savings for trips that start and end within the business hours are likely be converted to work activity. In the long term, travel time savings for those trips that start or end outside of business hours are likely be translated into leisure time.
For commuting trips, the majority of travel time savings would be used for leisure, although it is possible that some small proportion of time savings would be used for working, at least in the short term.
Time-budget theory suggests that most workers have a predetermined travel time budget for commuting. It is within this predetermined travel budget that workers choose a suitable employment or residential
Likely use of business travel time savings
Likely use of commuter travel time savings
Normal working hours
Private time 9:00 AM 18:00 PM Private time
Base case: A trip starts in private time and ends in business hours
Project: With tranport improvement and travel time reduction, in the
short term, travel time savings (Δ) are likely used for work Δ=Work
Project: In the longer term, a traveller is likely to start the trip later,
thus travel time savings (Δ) are likely used for leisure
Δ=Leisure
Base case: A trip both starts and ends in business hours
Project: With tranport improvement and travel time reduction, travel
time savings (Δ) are likely used for work
Δ=Work
Base case: A trip starts in business hours and ends in private time
Project: With tranport improvement and travel time reduction, travel time
savings (Δ) are likely used for leisure
Δ=Leisure
Base case: A commuter plans the trip to make on‐time arrival
Project: With tranport improvement and travel time reduction, in the
short term, travel time savings (Δ) are likely used for work
Δ=Work
Project: In the longer term, the commuter is likely to start the trip
later, thus travel time savings (Δ) are likely used for leisure Δ=Leisure
Base case: A commuter leave work at the end of working hours
Project: With tranport improvement and travel time reduction, travel time
savings (Δ) are likely added for more leisure time
Working while travelling: what are implications for the value of travel time savings in the economic appraisal of transport projects?
Wang and Hensher
10
location. In the long term, transport improvements and travel time reductions often are expressed through more and longer trips with an increase in urban sprawl or better job skill match at the expense of a longer commuting travel, not by less time travelling. Cervero (2011) noted that people continue to use roughly the same amount of time to move around a city despite rapid increases in average travel speed. The daily travel “time budget has held remarkably constant from ancient Rome, to the walking cities of 15th century Europe, to the streetcar suburbs of the early 20th century and freeway-laced cities today” (Cervero 2011, p. 3).
Labour market equilibrium offers another insight. With imperfect competition in the labour market, firms do need to partially but not fully compensate the commuter cost if firms have more market power than workers (Manning 2003). With a transport improvement, the additional compensation is no longer needed. Thus savings in commuter travel time eventually would be used for leisure. For those business trips that have encroached into private time, the savings in travel time would likely go to leisure because they are not compensated for at the first place.
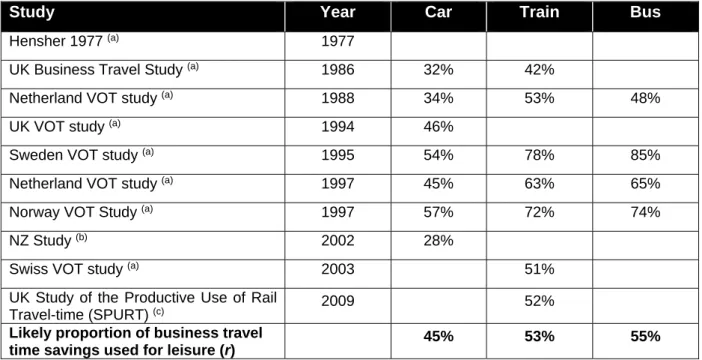
Table 6 shows the likely proportions of travel time savings used for leisure and work. Roughly speaking, a 50% by 50% split is evident for business trips, although existing evidence suggests variations between transport modes. For example, travel time savings from car trips appear less likely to be used for leisure (45%), while bus trips more likely (55%), and train trips fall in-between (53%).
Table 6 Proportion of travel time savings used for leisure and work (r)
Study Year Car Train Bus
Hensher 1977 (a) 1977
UK Business Travel Study (a) 1986 32% 42%
Netherland VOT study (a) 1988 34% 53% 48%
UK VOT study (a) 1994 46%
Sweden VOT study (a) 1995 54% 78% 85%
Netherland VOT study (a) 1997 45% 63% 65%
Norway VOT Study (a) 1997 57% 72% 74%
NZ Study (b) 2002 28%
Swiss VOT study (a) 2003 51%
UK Study of the Productive Use of Rail
Travel-time (SPURT) (c) 2009 52%
Likely proportion of business travel
time savings used for leisure (r) 45% 53% 55%
Notes (a), (b) and (c) are the same as Table 3.
Table 7 shows the productivity foregone correction after accounting for the leisure use of business travel time savings. The productivity foregone correction is $14.99 for car, $17.65 for train and $18.18 for bus. After the correction, the business VTTS are around 69%, 64% and 62% of the original MPL for car, train and bus respectively. It shows that the productivity foregone corrections are significant for all modes.
11 Table 7 The productivity foregone correction on the business VTTS accounting for the leisure use of business
travel time savings
Car Train Bus
MPL – Marginal Product of Labour ($/hr) (1) $48.45 $48.45 $48.45
VL - Value of leisure time ($/hr) $15.14 $15.14 $15.14
r - proportion of business travel time savings goes to leisure 45% 53% 55% Correction for leisure use of business travel time savings $14.99 $17.65 $18.18
VTTS business after correction ($/hr) $33.46 $30.80 $30.27
% of corrected business VTTS to the original MPL 69% 64% 62%
After productivity foregone corrections are made both for working while travelling and for the leisure use of business travel time savings, the business VTTS is much lower, accounting for 65%, 41% and 58% of the original MPL for car, train and bus respectively, as shown in Table 8.
Table 8 Effects of productivity foregone corrections for working while travelling and the leisure use of business travel time savings
Car Train Bus
MPL – Marginal Product of Labour ($/hr) $48.45 $48.45 $48.45 Correction for working while travelling $1.80 $10.82 $2.03 Correction for the leisure use of the business travel
time savings $14.99 $17.65 $18.18
The business VTTS post both corrections ($/hr) $31.66 $19.98 $28.24 % the corrected business VTTS to the original MPL 65% 41% 58%
3.4 Other factors that may affect the productivity foregone corrections
For professional drivers such as bus, truck and train drivers, driving is their work and thus the productivity foregone corrections are not applicable. Other factors that affect the proportion of business travel time used for productive working include transport mode, trip distance and public transport crowding level.
The ability to work while travelling is dependent on the transport mode. It is easier to work in a smooth, quiet and air conditioner train than in a bumpy bus. Car also does not provide an amenable working environment, although it may be attractive for a car passenger.
There is no conclusive evidence how travel distance affects the likelihood of working while travelling. There are some suggestions in Wardman et al. (2013, p. 47), who considered that the proportion of the business travel time savings (r value) converted to leisure pursuits will increase as more travel time is undertaken in a travellers private time. This suggest that the longer the travel distance, the lower the business VTTS. However, there are offsetting factors. Both the proportion of travel time used for productive activities (p value) and the relativity of working efficiency in travel time to time at the workplace (q value) will fall with longer distance. The longer distance means that the trip is more costly, less time with the client in the destination and more likely that the senior staff will make such trips. These factors lead to a higher business VTTS. Thus, the effect of trip distance is inconclusive given available evidence.
Working while travelling: what are implications for the value of travel time savings in the economic appraisal of transport projects?
Wang and Hensher
12
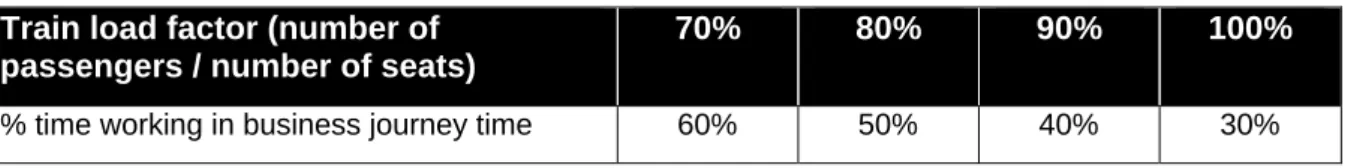
Public transport crowding level has a more explicit impact on the proportion of travel time spent working. Seating availability will impact on the ability to use travel time for work and the efficiency of work. The evidence suggests that the ability and willingness to work during a train journey falls with the load factor as shown in Table 9. Conceptually, the load factor can be built into the productivity foregone correction. No such correction is attempted in this paper as the proportion of time working while travelling, namely 24% for train, used in the previous productivity foregone correction (see Table 3) is already low compared with the values in Table 9.
Table 9 Business trip time used for working on the train by load factor
Train load factor (number of passengers / number of seats)
70% 80% 90% 100%
% time working in business journey time 60% 50% 40% 30%
Source: Wardman et al. (2013, p. 66)
Douglas (2014b, p. 39) reviewed the effects of crowding on the value of travel time savings, and found that the crowding multiplier (VTTS in crowded conditions relative to normal conditions) was 1.2 for crowded seat, 1.65 for standing, and 2.1 for crush standing. These findings may apply to the VTTS of commuter or other private travels but are not applicable for the productivity foregone corrections on the business VTTS.
4. Implications for project evaluation
The existing CSA approach gives the same business VTTS values for car, bus and train. In Transport for NSW’s economic appraisal guidelines, the business VTTS is $48.45 per hour in June 2014 dollars. After two productivity foregone corrections, this value becomes much lower, with the value differentiated for car, train and bus. The implication is that, prior to the productivity foregone correction, the business VTTS is the same regardless the mode and mode shift. Post corrections, the business VTTS is now different for mode and mode shift. Table 10 provides the business VTTS matrix of mode shifts. For example, if a public transport project results in a mode shift from car to train, the travel time savings are valued at $43.34 per hour. Contrary, if a road project results in a mode shift from train to car, the travel time savings of business trips are valued at $15.14 per hour.
Table 10 The business VTTS for evaluating mode shift ($/hour)
FROM
TO
Car Train Bus
Car $31.66 $43.34 $35.07
Train $15.14 $19.98 $15.14
Bus $24.83 $36.51 $28.24
This will have the following implications on economic appraisal:
At the project level, the total value of business travel time savings will be lower, which may result in a lower benefit cost ratio if the productivity foregone corrections are made.
At the transport mode option level, the productivity foregone corrections will favour public transport projects. In particular, train projects will be ranked higher, followed by bus improvement and road projects, ceteris paribus.
The post correction VTTS will also have implications on demand modelling. In the generalised cost formula, the VTTS is required at the mode shift level, which will make the demand forecasting process more complex. It can also lead to an increased mode share for train and bus. Table 11 shows that the
13
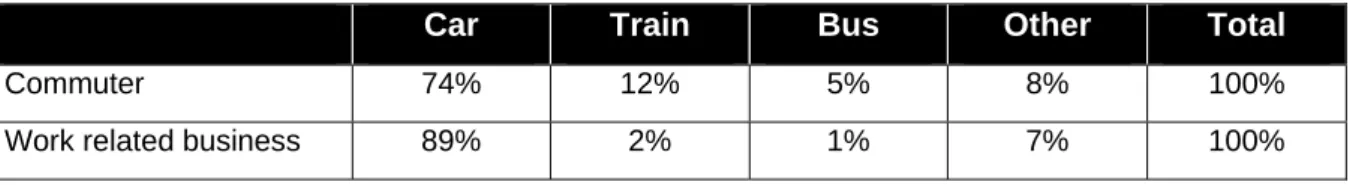
majority of business trips are made by car. The business trips made by train and bus only account for around 3% of total trips. The 89% of all business trips are made by car, and thus the productivity foregone corrections may have bigger impacts on road projects.
Table 11 Mode share of business and commute trips
Car Train Bus Other Total
Commuter 74% 12% 5% 8% 100%
Work related business 89% 2% 1% 7% 100%
Source: Household Travel Survey 2011 – 2013. “Car’ includes taxi. ‘Other” refers to short distance trips by walking and cycling and trips by ferry and light rail. The HTS data does not allow further mode share breakdowns in ‘other’.
5. Conclusions
This research shows that some people on business trips undertake productive working activities while travelling. The proportion of travel time used for working is largely dependent on the transport mode. People are more likely to work on a train than on a bus or in a car. On train, around 24% of business travel time is used for working, while on bus or in car, only about 4% to 5% of travel time is used for working.
If business travellers do work while travelling, their working efficiency can be expected to be as high (on marginal activities at least) as in their workplace. Analysis indicates that, on a train, working efficiency is around 95% of that in the office. On a bus or in a car, the working efficiency is slightly lower at 93% (see Table 3).
While people on business trips do work while travelling, a significant proportion of business travel time savings is used for leisure instead of working. This is partly because some business travel either starts from home in the morning or ends at home in the afternoon; thus travel time savings naturally will be converted to leisure time. The analysis suggests that business travel time savings used for leisure activities account for 45%, 53% and 55% for car, train and bus respectively time savings.
These findings contrast with underlying assumptions of the value of business travel time savings used in current practice in Australia. Since the early 1970s, Australian jurisdictions have adopted the Cost Saving Approach (CSA) for valuing business travel time savings (Austroads 1997). The CSA assumes that business travellers do not undertake any productive activities while travelling, and that 100% of travel time savings will be used for business and not leisure (Batley 2014, Wardman 2003, Wardman et al. 2013).
This paper has introduced two productivity foregone corrections on the business VTTS to account for working while travelling, and the leisure use of part of business travel time savings. Post corrections, it was found that the business VTTS is significantly lower than the original CSA value. The business VTTS after the productivity foregone corrections is 65% of the original MPL for car, 41% for train and 58% for bus.
The implication for economic appraisal of transport projects is that, at the project level, these corrections will result in a lower benefit-cost ratio because the benefit of business travel time savings is valued lower. At the transport mode option level, these corrections generally favour public transport projects, in particular train projects, because trips diverted from car to train are valued higher ($43.34/person hr) than the diversion from train to car ($15.14 per person hr). The corrections will also have implications on demand modelling, as the generalised cost for bus and train on business trips is now lower, which can be converted to a higher mode share for public transport. Again, this also favours a public transport project compared with the existing CSA approach.
Working while travelling: what are implications for the value of travel time savings in the economic appraisal of transport projects?
Wang and Hensher
14
In this study, the parameter values (p, q and r) of the Hensher equation are determined from a simple meta-analysis of values reported in the existing literature. The studies are mostly from Europe with a couple of studies from New Zealand and Australia. To estimate actual business VTTS, considering effects of working while travelling and the leisure use of the business travel time savings, these parameters need to be localised. New research is recommended to estimate these parameters in Australian jurisdictions.
Acknowledgement
The views expressed in this paper are those of the authors and are not necessarily supported by affiliated organisations. The authors thank two anonymous reviewers for very insightful comments that have improved the paper.
References
AECOM, GRIMSHAW, KPMG, SKM, ACIL Tasman, Booz&Co and Hyper (2013) High Speed Rail Study, Phase 2 Report, Sydney.
Austroads (1997) Value of travel time savings, AP119.
Batley, R. (2014) The Hensher equation, derivation, interpretation and implications for practical implementations, Transportation, published online, 13 August 2014.
Beca Carter Hollings and Ferner, Steer Davies Gleave, Forsyte Research and Brown Copeland and Co. (2002) Project Evaluation Benefit Parameter Values. Prepared for Transfund New Zealand.
Bray, D. (2006) Improving economic evaluation of urban transport projects in Australia, Economic and Policy Services Pty Ltd, Adelaide, Australia
Cervero, R. (2011) Beyond travel time savings: an expanded framework for evaluating urban transport projects, report to World Bank.
Curtis, P. (2012) High speed rail: is it worth £32 bn? theguardian politics blog (UK), http://www.theguardian.com/, accessed on 28 August 2014.
Douglas Economics (2015) Value of service quality values for rail transport in Sydney, report to Sydney Trains, Douglas Economics, July 2015.
Douglas, N. (2014a) Personal communication on quality surveys on Sydney Trains.
Douglas, N. (2014b) ATC Guidelines, Public Transport Parameter Review, Report to Australian Transport Council (and some personal correspondences).
Fowkes, A.S., Marks, P. and Nash, C.A. (1986) The Value of Business Travel Time Savings. Working Paper 214, Institute for Transport Studies, University of Leeds.
Hensher, D.A. (1977) Value of Business Travel Time, Pergamon Press
Mackie, P.J., Wardman, M., Fowkes, A.S., Wheland, G., Nellthorp, J., and Bates, J. (2003) Value of travel time savings UK, Institute of Transport Studies, University of Leeds, Working Paper 567. Manning, A. (2003) Monopsony in Motion: Imperfect Competition in Labour Markets. Princeton, NJ: Princeton University Press.
Mott MacDonald, Hugh Gunn Associates, TRI Napier University, Accent and Mark Bradley Research and Consulting (2009) Productive Use of Rail Travel Time and the Valuation of Travel Time Savings for Rail Business Travellers. Final Report to the Department for Transport.
TfNSW (2013) Principles and guidelines for economic appraisal of transport initiatives and projects, Transport for NSW.
15
Truong, T.P., Hensher, D.A. (1985) Measurement of travel time values and opportunity cost from a discrete choice model, The Economic Journal, 438-451, Great Britain.
UK House of Commons Transport Committee (2011) High Speed Rail, Tenth Report of Sessions, 2011-12.
Wardman, M., R. Batley, J. Laird, P. Mackie, T. Fowkes, G. Lyons, J. Bates and J. Eliasson (2013) Valuation of travel time savings for business travellers, Main Report Prepared for the Department for Transport, Institute for Transport Studies, University of Leeds