7th International Workshop on
7th International Workshop on Information Logistics and Knowledge Supply
Sub-title
13th International Conference on Perspectives in Business Informatics Research Lund, Sweden, September 23-25, 2014
Workshop Proceedings
Volume Editors
Kurt Sandkuhl
The University of Rostock Institute of Computer Science Albert-Einstein-Str. 22 18 057 Rostock, Germany E-mail: kurt.sandkuhl@uni-rostock.de Ulf Seigerroth Jönköping University School of Engineering Box 1026 55 111 Jönköping, Sweden E-mail: ulf.seigerroth@jth.hj.se
© 2014 for the individual papers by the papers' authors. Copying permitted for private and academic purposes. This volume is published and copyrighted by its editors. Re-publication of material in this volume requires permission by the copyright owners.
Towards Visual EAM Analytics:
Explorative Research Study with Master Students
Dierk Jugel1,2 , Kurt Sandkuhl2, Alfred Zimmermann1,
1 Reutlingen University, Reutlingen, Germany
firstname.lastname@reutlingen-university.de
2 Rostock University, Rostock, Germany
firstname.lastname@uni-rostock.de
Abstract. Enterprise Architectures (EA) consists of many architecture elements, which stand in manifold relationships to each other. Therefore Architecture Analysis is important and very difficult for stakeholders. Due changing an architecture element has impacts on other elements different stakeholders are involved. In practice EAs are often analyzed using visualizations. This article aims at contributing to the field of visual analytics in EAM by analyzing how state-of-the-art software platforms in EAM support stakeholders with respect to providing and visualizing the “right” information for decision-making tasks. We investigate the collaborative decision-making process in an experiment with master students using professional EAM tools by developing a research study and accomplishing them in a master’s level class with students.
Keywords: Enterprise Architecture Management, Visual Analytics, Decision-making process, Collaboration
1 Introduction
Enterprises are complex and integrated systems of processes, organizational units, resources and technologies with a multitude of relations and interdependencies. Enterprise Architecture Management (EAM) aims at providing an integrated view on all these aspects of the organization in order to support business & IT-alignment, optimization scenarios, quick adaption to environmental changes and many more purposes. Since EAs are complex structures, it is very difficult to keep track and to work out relevant characteristics. In particular changing an architecture element requires the evaluation of impacts on other elements. The impacted elements have to be analyzed by several stakeholders from their individual perspectives, which require that the relevant information have to be prepared in an adequate manner. In practice, for this purpose EA visualizations like landscape or cluster diagrams are commonly used. Matthes et al. [1] outline the basic functionality of visualization techniques in an EAM tool survey. The ISO Std. 42010 [2] calls visualizations describing an architecture of a system as views. Furthermore the Std. defines so-called Viewpoints, which are the link between the views as part of the architecture description and the
stakeholder’s concerns. Viewpoints define the construction, interpretation and usage of views. Concerns reflect the information needs of stakeholders. Each stakeholder is an expert in a particular area of the enterprise and requires specific viewpoints to analyze an impact for his purpose.
An adequate visualization of relevant information is an important aspect of supporting stakeholders in their specific tasks and decision-making needs, but also has to be accompanied by understanding what exactly the relevant information is that meets the stakeholder’s demands. Work in the area of information logistics showed that information demand is depending on the tasks and responsibilities of an organization role [3]. Thus, a crucial precondition for achieving demand-oriented information supply is to understand the roles’ and stakeholders’ demand.
Furthermore decision-making in EAM often requires the collaboration of many stakeholders, which have different knowledge. The stakeholders have to communicate to discover possible impacts for an architecture change. Impacts often aren’t emergent and can be only found if the stakeholders communicate with each other. Lucke et al. outline in [4] critical issues in EAM by doing a literature review in the field of enterprise architecting. The authors identify open issues including identifying the “right” stakeholders for a particular situation and the stakeholder’s communication with each other.
This article aims at contribution to the field of visual analytics in EAM by analyzing how state-of-the-art software platforms in EAM support stakeholders with respect to providing and visualizing the “right” information for their needs. Thomas et al. describe visual analytics as “the science of analytical reasoning facilitated by interactive visual interfaces” [5]. Thereby the information has to be visually represented. Furthermore the visual representation has to enable interaction possibilities for humans [6]. Thus EAM is a broad field, we focus on the social decision-making process including the analysis of necessary information using visual and collaboration capabilities. The decision-making process is a precondition for well eligible and transparent architecture decisions.
As a starting point and mission of this paper we investigated how the decision- making process is done by master’s level students with little experience in EAM and how they are able to analyze Enterprise Architectures using capabilities of professional EAM tools. For selecting EAM tools we use the tool classification of the EAM tool survey guided by Matthes et al. [1]. The authors identify several dimensions for classifying EAM tools. One of them is “flexibility vs. guidance” (c.f. [1] p. 344). Using this dimension EAM tools can be classified in “metamodel driven”, “methodology driven” and “process driven”. Each type uses a specific approach how to support users in doing EAM. Whereas EAM tools based on the “process driven” approach include a lot of guidance and rigid structures how to do something, EAM tools based on the “metamodel driven” approach focus on the EA information itself with less guidance and flexible structures. The “process driven” approach for example is especially suitable for big enterprises with a great IT. Our hypothesis is that the result of the collaborative decision-making process is strongly dependent on the type of the approach of the dimension “flexibility vs. guidance” and the team structure. To cover all characteristics of “flexibility vs. guidance” we use one tool for each characteristic. Thus there are a lot of EAM tools on the market, we decided to use 7. /Workshop on Information Logistics and Knowledge Supply
tools we have some experience and access. All tools selected have a substantial prevalence in practice.
The main contributions of the paper are (1) the set-up for the research study, including tasks to be performed and an EA designed as study object, (2) experiences in executing the study with master students, and (3) the actual study results, i.e. to what extent visual analytics currently is supported by EAM tools. The remainder of this article is structured as follows: In Section 2, we revisit the state-of-the-art in visual EAM analytics. In Section 3, we describe the research study. Firstly, we introduce the business scenario including several tasks. Afterwards we derive a metamodel to describe the information needed for solving the tasks. Secondly the research process for performing them is introduced. In Section 4, we present the case study evaluation and conclude with a summary in Section 5.
2 Related Work
In this section we want revisit related work of Visual EAM Analytics. Thomas et al. describe visual analytics as “the science of analytical reasoning facilitated by interactive visual interfaces” [5]. Keim et al. detail this definition of visual analytics in [7] as a combination of automated analysis techniques and interactive visualizations. The authors emphasize effective understanding, reasoning and decision making as goals of visual analytics. Keim describes the visual analytics process as “Analyze first, Show the important, Zoom, filter and analyze further”. This process entails an analysis phase before visualizing the information, which contrasts with information visualization techniques. In addition to get rid of the information overload problem, only important information are visualized.
In practice of EAM, there aren’t visual analytics capabilities. Instead information visualization techniques are applied. As described in Section 1, Matthes et al. [1] outline the basic functionality of visualization techniques in an EAM tool survey. In addition Roth et al. [8] outline typical viewpoint types like “Cluster Map” or “Flow Diagram” and investigate the visualization capabilities of EAM tools. However interactive functionalities in combination of automated analyzing techniques to enable visual analytics are not part of this survey. Hanschke provides an operationalization of to EA analysis and planning via so-called “patterns”. These patterns are described in the appendices A to C of [9] and designate notable phenomena in an EA and how to identify their occurrence. For analyzing the EA Hanschke uses visualizations. However interaction functionalities are not part thereof.
Buckl et al. describe in [10] an approach to automatically generate EA visualizations from an EA model. In [11] Schaub et al. describe a conceptual frame- work to automatically generate interactive EA views. The framework bases on the work of [10]. The interaction possibilities focus on interactive editing the underlying EA documentation. Therefore, functionality like transaction support is added to the approach.
Jugel et al. describe in [12] an interactive cockpit approach towards visual analytics. The cockpit approach is well established for activities like controlling power plants or space missions. A cockpit is characterized as a room, in which several
screens simultaneously provide different viewpoints on the system under consideration. The authors apply this idea to the situation of EAM and describe requirements of such a cockpit in an abstract manner. One of the requirements is so-called “What-If analyses”, which provides automated analyses based on user interactions in the cockpit and the visualization of the results thereof. In [13] Jugel et al. detail the requirements by describing interactive functions and their conceptual realization.
3 Research Study
In this section we describe the research study. Firstly in Section 3.1 we introduce the business scenario. Thereby we prepare tasks, which the participants have to solve. A metamodel based on the tasks is introduced to accomplish the information needs. Secondly we describe the procedure for performing the research study in Section 3.2.
3.1 Business Scenario
For performing the research study, a business scenario including the EA documentation is needed. Firstly we want to introduce the tasks before we describe the EA to analyze. Imagine the participants are external consultants who are employed to reveal optimization potentials in an enterprise’s EA. In particular the client is interested in potentials in the functional business support, information systems and technical components. Therefore the specific tasks can be divided into the areas technology and landscape management. In the field of technology management, the client requests the following tasks:
T1.1 Analysis of technical components using architectural domains
!
T1.2 Analysis of technical component’s usage in information systems!
T1.3 Identification of consolidation potentials for technical components (e.g. many components with similar functionality, like webservers)
!
T1.4 Identification of technical components that are often used together by information systems (stack analysis)
In the field of landscape management, the requested tasks from the client are: T2.1 Analysis of the information system landscape!
T2.2 Identification of abnormalities like redundancies in business support or covering lacks
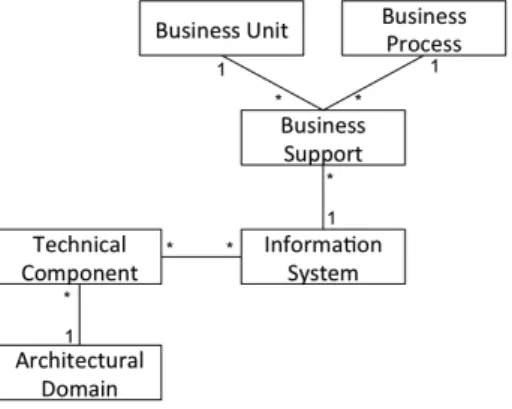
Next we construct an EA, which the participants in our research study are supposed to use when working based on the different tasks. We derive a metamodel, which covers the different aspects (see Fig. 1). Thus each tool usually has another naming and definition for the metamodel artifacts, we are using the naming and definitions of iteraplan1, because it is open source and everybody can have a look. Performing T1.1
1 http://www.iteraplan.de/en
7. /Workshop on Information Logistics and Knowledge Supply
the metamodel artifacts Architectural Domain and Technical Component are needed, while performing T1.2 requires the artifacts Technical Component and Information
System. Thus T1.3 and T1.4 are based on the analysis tasks T1.1 and T1.2, no
additional metamodel artifacts are needed. Lastly T2.1 requires the artifacts
Information System, Business Unit, Business Process and a mapping between them
named Business Mapping. T2.2 is based on T2.1 and therefore further artifacts are needed.
Fig. 1. Metamodel of EA for business scenario
Based on the metamodel a model is needed that contains all the elements contained in the EA. Thus the scenario has to be realistic, a moderate complexity is necessary. Our model is designed consisting of 25 business processes, 9 organizational units, 95 information systems, 9 architectural domains, 99 technical components and 656 business mapping elements. The model is prepared for performing the tasks described above. For example there are lacks and redundancies in business support and several technical components with similar functionality are in the same architectural domain.
3.2 Research Process
The master’s level course consists of 25 students. We divided them into 5 study groups with 5 students. Study groups 1 to 4 get an EAM tool to study with. Study group 5 has the task to develop the business scenario and to document the EA in the tools. At the beginning the students get the tasks described above and an EAM tool. In the following the learn and test phase begins, which takes one month. In this phase the student teams can study the tools and try out the given tasks based on the showcase scenarios of the tool vendors.
Afterwards the research study is performed. Thereby the teams process the research study separately under observation of the lecturers and study group 5. At the beginning the client (one student of study group 5) present the business scenario and answer open questions. Then the teams have got two hours time to analyze the EA and to do the tasks. Afterwards the study groups present their results to the client and write an experience report.
4 Results and Evaluation
In this section we describe the student’s experiences while accomplishing the tasks of the research study described in Section 3.1. We assess the experience reports and combine them with the observation impressions from study group 5 and us. The students’ experiences strongly depend on the used EAM tool. As described in Section 1 the tools have different approaches regarding flexibility and guidance. All approaches have their right to exist and are apposite tailored to different enterprises that do EAM in a special way. Our fictional enterprise described in the business scenario can be seen as an enterprise with a small EAM department that hasn’t implement complex guidance and decision-making processes. Moreover the students aren’t experts in EAM and not part of the enterprise, but external consultants in our scenario. Thus the students have struggled with complex tools with a great functionality in managing large groups in EAM that are common in large enterprises.
Nevertheless all study groups have found a lot of optimization potentials. But the way how they have found their results was different. We have identified a usability conflict between flexibility and guidance. Tools that are very flexible and easy to use without much induction effort are quickly stretched to their limits, because they typically have much less functionality. On the other side, tools with much functionality, which covers many guidance aspects, aren’t easy to use and require a great induction effort. With such tools, the students became lost in the variety of different menus and they quickly lost the overall context they want to analyze.
The visualization capabilities of the tools strongly depend on the usability aspect. Tools with an easy usability typically have less visualization capabilities, because of system-side preconfigured visualizations. Users are only able to change these visualizations by limited parameters. Thus students, who used such a tool, didn’t use the visualization capabilities very much to get their findings. In contrast students using tools with greater visualization capabilities struggled with complex configurations. In addition most study groups were not able to display several views of an aspect in the tools in parallel. Therefore the students had to click through several menus to get from one view to another and lost the overall context again. One of the tools supports a dashboard approach, which is able to display several views in parallel. However there aren’t many interaction possibilities in the tools. The interaction possibilities are limited to link two views with each other or to jump to the object’s documentation in the tools.
We confirm the statement in Section 2, that there are not visual analytics capabilities in EAM. The capabilities in EAM confine oneself to information visualization. All students have used pen and paper to document their findings. There isn’t a way to annotate views by adding notes or visually highlighting in the tools like described in [13]. The export and printing of views seem to be a common vehicle to annotate views. But this approach has several disadvantages. Printed views aren’t up to date and annotations have to be repatriated to the EA documentation, which is a potential source of error and causes additional expenditures. Furthermore only the person, who has the printed view in his drawer, has the findings. This situation leads to less communication with other stakeholders about analysis findings and planning scenarios. Another important aspect of visual analytics is the capability to combine 7. /Workshop on Information Logistics and Knowledge Supply
visualization aspects with an automated analysis in the background. For example a user interacts with a view by touching an element and initiating an impact analysis, which automatically highlights impacted elements on the view.
Finally we consider the student’s experiences in collaboration and communication by using the tools. Like described above printing views and annotate them brings along disadvantages in communication and collaboration with other stakeholders. Collaboration and communication functionalities are multifaceted in the used tools. Such functionalities range from enabling workflows for documentation and approval of changes to subscriptions of architecture elements and activity streams. Especially subscriptions of architecture elements and activity streams can be helpful to be up to date. However activity streams can lead to information overload, which is counterproductive. Moreover subscriptions to get news about the subscripted element require a proactive activity of the stakeholders. Thereby the problem is a stakeholder can’t know at a particular time in what elements he is interested in the future. In our opinion the functionalities are insufficient for a decision-making process to change an EA. A big challenge is to find involved stakeholders, which can’t read off from an organigram. Here involving enterprise social networks to analyze discussions between stakeholders in the past may help to find the right persons for a particular situation. Additionally a mechanism is needed to inform involved stakeholders automatically for example by using an activity stream with intelligent automatic filter and subscription mechanisms.
5 Conclusions and Future Work
In this paper we present a research study investigating visual analytics capabilities in state-of-the-art EAM tools and the collaborative decision-making process support. We accomplish the research study with master students to get first results. Our results show that the visual analytics approach is not used in the investigated EAM tools. Furthermore the support of collaboration between stakeholders that is necessary for decision-making is low. In our opinion, the focus of the tools lies on EA documentation and not in supporting collaboration or decision-making. However some tools support workflows to satisfy the enterprises’ processes and guidance, but give no support in how to get the best decisions or relevant stakeholder identification.
From an information logistics perspective, the study results indicate a need for more work on typical roles in EAM and their information demands. The different tools show commonalities in what information is provided and how it can be visualized in EAM, but they do not show support for the same EAM roles. To identify typical roles in EAM and to elicit their typical demands, e.g. using the method for information demand analysis [14] and the means of information demand patterns [15], would probably be useful for both, the EAM tool developers and the way of analyzing support of visual analytics of these tools.
Future work in this area will include the repetition of the research study in other contexts and with additional EAM tools. On the one side we envision to use the study with industrially experienced enterprise architects for external validation of the results in practice. On the other side, we plan to repeat the study with more students at
another university to contribute to an understanding how the student’s prior knowledge in EAM and enterprise modeling affect the results of such a study. Furthermore we will refine our approach presented in [12] and [13] to support stakeholders in the decision-making process by using the visual analytics approach and improving the stakeholder’s collaboration and identification.
References
1. Matthes, F., Buckl, S., Leitel, J., Schweda, C.M.: Enterprise Architecture Management Tool Survey 2008. Technical Report, Chair for Informatics 19, TU München (2008)
2. International Organization for Standardization: ISO/IEC/IEEE 42010 - Systems and software engineering — Architecture description. Technical Standard (2011)
3. Lundquist, M.:Information Demand and Use: Improving Information Flow within Small-scale Business Contexts. Licentate of Engineering, Department of Computer and Information Science, Linköpings Universitet (2007)
4. Lucke, C., Krell, S., Lechner, U.: Critical Issues in Enterprise Architecting - A Literature Review. In: Proc. of Sustainable IT Collaboration Around the Globe, 16th Americas Conference on Information Systems (AMCIS), August 12-15, Lima, Peru, pp. 305-315 (2010)
5. Thomas, J., Cook, K.: Illuminating the Path: Research and Development Agenda for Visual Analytics. IEEE Press, Los Alamitos (2005)
6. Keim, D.A., Mansmann, F., Schneidewind, J., Thomas, J., Ziegler, H.: Visual Analytics: Scope and Challenges. In: Simoff, S.J., Böhlen, M.J., Mazeika, A. (eds.) Visual Data Mining. Lecture Notes in Computer Science, Vol. 4404, Springer Verlag, Heidelberg, pp. 76-90 (2008)
7. Keim, D.A., Andrienko, G., Fekete, J.-D., Görg, C., Kohlhammer, J., Melacon, G.: Visual Analytics: Definition, Process, and Challenges. In: Kerren, A., Stasko, J.T., Fekete, J.D., North, C. (eds.) Information Visualization. Lecture Notes in Computer Science, Vol. 4950, Springer Verlag, Heidelberg, pp. 154-175 (2008)
8. Roth, S., Zec, M., Matthes, F.: Enterprise Architecture Visualization Tool Survey 2014. Technical Report, Chair for Informatics 19, TU München (2014)
9. Hanschke, I.: Strategisches Management der IT-Landschaft (3rd Edition). Hanser Verlag, München (2013)
10.Buckl, S., Ernst, A.M., Lankes, J., Matthes, F., Schweda, C.M., Wittenburg, A.: Generating Visualizations of Enterprise Architectures using Model Transformation (extended version). In: Enterprise Modeling and Information Systems Architectures – An International Journal, Vol. 2(2), GI, pp.3-13 (2007)
11.Schaub, M., Matthes, F., Roth, S.: Towards a Conceptual Framework for Interactive Enterprise Architecture Management Visualizations. In: Modellierung, Bamberg, Germany (2012)
12.Jugel, D., Falkenthal, M., Schweda, C.M., Pretz, M., Zimmermann, A.: Von der Softwarekartographie zur Corporate Intelligence. In: Horbach, M. (ed.) Informatik 2013. Lecture Notes in Informatics, Vol. P-220, Gesellschaft für Informatik, September 16-20, Koblenz, Germany, pp. 1393-1407, Köllen Verlag (2013)
13.Jugel, D., Schweda, C.M.: Interactive functions of a Cockpit for Enterprise Architecture Planning. In: 9th Trends in Enterprise Architecture Research Workshop (TEAR), in conjunction with the 18th IEEE Enterprise Computing Conference (EDOC 2014), September 01-05, Ulm, Germany (2014)
7. /Workshop on Information Logistics and Knowledge Supply
14.Lundquist, M., Sandkuhl, K., Seigerroth, U.: Modelling Information Demand in an Enterprise Context: Method, Notation and Lessions Learned. In: International Journal Systems Modeling and Design, Vol. 2(3), IGI Publishing, pp. 74-96 (2011)
15.Sandkuhl, K.: Information Demand Patterns. In: Proc. PATTERNS 2011, The Third International Conference on Pervasive Patterns and Applications, September 25-30, Rome, Italy (2011)