A Study of the Aerodynamics of Butterfly-type Flapping Wing
Yang-Yao Niu
1and Jau Ting Huang
1, Ya-Han Chang
2and Mei-Jiau Huang
21: Dept. of Aerospace Engineering, Tamkang University
2: Dept. of Mechanical Engineering, National Taiwan University
Abstract
This study aimed at numerical simulation of the flow fields induced by a swallowtail butterfly based on the
commercial software. Parameters such as the flapping frequency, the angle of attack, the wing shape, and the
swallowtail effects on the aerodynamics were explored. The simulations show that the lift increases with the
angle of attack first but decreases after angle of attack of 40
˚
as a swallowtail butterfly-type wing is in
gliding. However, the drag is shown to increase monotonically. Consequently, the lift-drag ratio has its
maximum when the angle of attack is 10
˚
. The flapping flight has similar variations in the average lift, the
drag and the lift-drag ratio of the gliding flight but the magnitudes increase with the increased flapping
frequency. Through the 3D flow visualization, it was also found that the swallowtail can enhance the
circulations around the trail during the downstroke when the flapping frequency is higher, regardless of the
angle of attack. It is believed that the tail can enhance the flight stability of the Swallowtail butterfly.
Keyword:
Aerodynamics, Flapping Wing, CFD, Butterfly
1.
Introduction
Among the various types of flying insects, swallowtail butterflies have unique morphological features.
Their wing area is very large relative to their body mass, and their flapping frequency is low [1]. Low
frequency flapping with large wings has been thought to lead to a large body motion synchronized with the
flapping motion and a unique undulating flight trajectory. Another feature of swallowtail butterflies is the
small degree of freedom of the wing motion. The fore wing partly overlaps the hind wing and they flap as
one large wing with little feathering. The feathering is structurally restricted by the wing connection [2]. This
means that the ability of butterflies to actively control the aerody-namic force of their wings is limited and
the undulating body motion is produced passively by simple flapping. Recent CFD analysis takes into
account the interac-tion between aerodynamic force and body motion [3]. Recently, Tanaka and Shimoyama
[4] utilized experimental observation of the swallowtail forward flapping flight and the variation of positions
of wings and body in flight, found the aerodynamic force generated by butterfly flapping can change the
angle between body axis and horizontal axis in flapping flight. Above experimental studies all suggested that
the angle of attack constantly changes in butterfly flapping flight, the butterfly-type wing has no significantly
stall phenomenon at high angles of attack, and the special tail structure suddenly can influence flow field.
We will use the Fluent software of CFD to simulate the flow field of swallowtail butterflies flapping flight,
exploring the aerodynamic change of swallowtail-type wing at different angle of attack and different
flapping frequency. Finally, we can collect the flow field characteristics of flapping flight and understand the
effect of tail structure. We use the experimental data of the butterfly from Betts et al. [5] Butterfly can
produce a different size and direction aerodynamic forces by use of changing flapping frequency , flapping
amplitude , and angle of attack in flight. The motion of Butterfly flapping flight is periodic reciprocating, it
can be divided into downstroke and upstroke by the direction of wing flapping. In this study, we use a cosine
function to describe the flapping angle of the cycle with dimensionless parameter J = 0.485, flapping angle
and flapping frequency f =7Hz can obtained the speed of butterfly flight V, which is about 0.648m / s.
A Study of the Aerodynamics of Butterfly-type Flapping Wing
First, we studied the aerodynamic characteristics of the butterfly as shown in Figure 1 in the hovering motion and gliding-flapping motion. The simulation is performed on the motion parameters as flapping frequency f 7Hz, angle of attack angle 10˚ and flight speed V 0.648m /s. The pressure distributions on the upper and lower wing surfaces during the upstroke and downstroke in hovering are demonstrated. The evolution of pressure distributions on the upper wing surface during the upstroke is very similar to the one on lower wing surface during the downstroke. Likewise, the evolution of pressure distributions on the lower wing surface during the downstroke is shown to be similar to the one on the upper wing surface during the upstroke. The aerodynamic force distribution versus time in hovering is symmetrical in the whole cycle. In the gliding flapping motion, the vortices induced by the flapping wing combining with the coming flow from far field, always brings about the less pressure differences between the upper and lower wing surfaces, so the aerodynamics forces in whole flapping cycle is reducing and asymmetrical comparing with the hovering. Here, the aerodynamic performance of the butterfly was investigated under different flapping frequencies and different angle of attack based on the flapping frequency of 7Hz, flight speed of 0.648m/s and flapping angle of 70˚. The flapping frequencies of 14Hz, 7Hz, 3.5Hz, and 1.75 Hz and the angle of attack changed from 0 ˚to 60 ˚ were chosen. We achieved the periodical evolutions of the lift, drag and pitching moment coefficients shown in Figure 2. It is obviously seen that the maximum and minimum values of the lift coefficient occurred at the end of the downstroke and the end of the upstroke regardless of the flapping frequency and the angle of attack. In addition, the lift was increasing until the angle of attack reaching to 40˚ but was decreasing after angle of attack of 40˚ no matter which flapping frequency it is. Also, the maximum and minimum values of the drag coefficient increased monotonically with the increasing of the angle of attack in all cases. Moreover, the negative pitching moments were seen in the downstroke and the early stage of the upstroke, but positive pitching moment were shown in late stage of the flapping cycle regardless of angle of attack. In Figure 2, the advance ratio J-1 is used to evaluate the evolution of the aerodynamic force for the gliding flight and hovering of Butterfly at different angle of attack. From the plot of the lift distributions, the period average lift increased with flapping frequency increasing until the angle of attack of 40˚ on all curves. Similarly, the average moments were negative in all forward flights with flapping and the maximum native values mostly occurred at 40˚. However, the average drag forces increased with flapping frequency increased at all angles of attack. In addition, the optimized lift-drag ratio occurred at angle of attack of 10˚ no matter what the flapping frequency is.
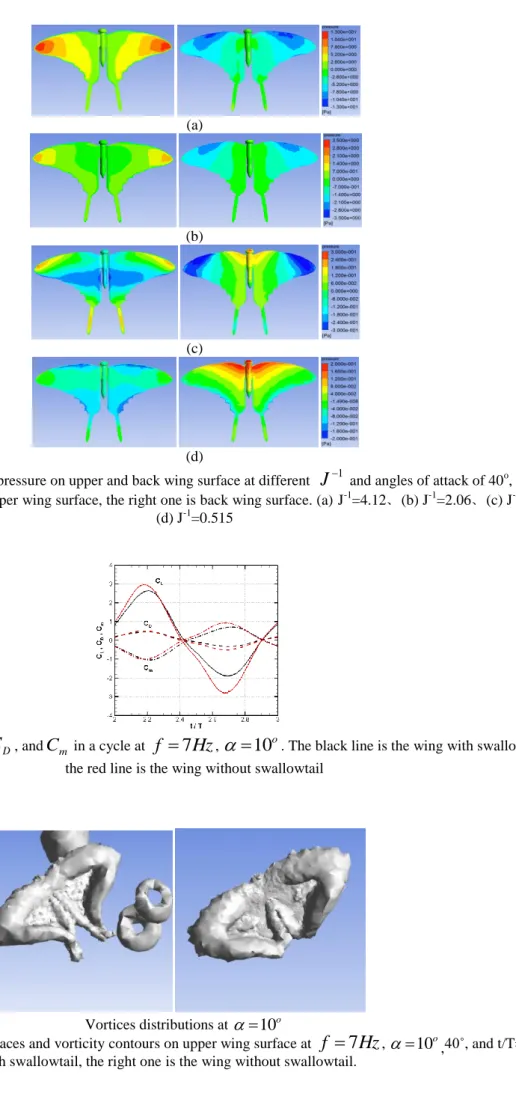
Figure 3 demonstrates the pressure distributions of the upper and lower wing surfaces respectively under different flapping frequency at angle of attack of 40˚ and t/T=2.75. In the plots, J-1 represented the flapping frequency in the forward flight with flapping. From Figure 3, the high pressure zone was shown in the upper surface of the wing and the maximum pressure mostly appeared around the wing tip when the flapping frequency is high. Then the high pressure zone near wing tip gradually decreased as the J-1 approaches zero. At the same time, the low pressure zone was appearing on the lower wing surface. The magnitude of pressure was shown to reduce from the leading edge to the wintip. The flapping frequency was reduced to 3.5Hz (J-1=1.03), the low-pressure was shown on the upper wing surface and the high-pressure zone was appearing near the leading edge. Likewise, the low pressure zone on the lower surface was distributed around the wing tip and the high-pressure zone was seen around the leading edge. In addition, the large pressure difference was coupling with the decreasing of the strength of leading edge vortex due to the smaller flapping frequency and the bigger velocity of freestream. When the flapping frequency was reduced to 1.75Hz (J-1=0.515), the pressure distributions on the wing surface became very different. The high-pressure distributions were appearing on the lower wing surface. The strength of pressure gradually decreases from leading edge to the trailing edge. Similarly, the low pressure zone was shown on the upper wing surface and mostly located on the middle of the upper wing. The strength of pressure gradually decreases from leading edge and trailing edge to the middle of wing. Some minor vortices still can be seen on the trailing edge due to the lower pressure area on both upper and lower surfaces even the flapping frequency is very low or J-1=0 . Therefore, a horseshoe vortex combing with the top vortex and the trailing edge wake was appearing in the downstream at all angle of attack as the J-1 approached zero.
Finally, we would like to explore the tail effect on the aerodynamics of the flapping swallowtail-shaped wings. Here, as shown in Figure 4, the aerodynamic forces of a swallowtail-type wing with or without tails at flapping frequency of 7Hz and angle of attack of 10˚were simulated. It is found that the value of lift force coefficient of wing with tail is slight larger than the one without tail at t/T=2.25 from the predicted results, but the difference between them is not very obvious. Moreover, the plots of vortice distributions and 3D plots shown in Figure 5 at t/T=2.25 of the two wings, it is found that more vortices near the trailing edge and along the tails whose structures were more solid and durable. It was also obviously seen that the existence of the tail caused vortices to gather on the tails and streamlines were much more regular in the downstream. Especially, the effects of the tails in the above discussion about the strengthening of the vortex would be only seen in the downstroke of the flapping cycle. InAccording to the above results, it is noted that the swallowtail can generate stronger vortex around the tail regardless of angles of attack at higher flapping frequency during the downstroke, but has no contribution in the strength of vortex the swallowtail wing when the flapping frequency is low.
force are larger than in pure-flapping motion. In the gliding motion of the swallowtail, the lift increases until the angle of attack reaching 40˚. If angle of attack is larger than 40˚, the lift is gradually decreases. However, the drag force is shown to increase monotonically as the angle of attach get higher. Consequently, the lift-drag ratio has its maximum at the angle of attack of 10˚.The flapping flight has similar variations in the averaged lift, the drag and the lift-drag ratio of the gliding flight but the magnitudes increase as the increased flapping frequency.In the flight of the high flapping frequency, the strong vortex slightly attached on the flapping wing surface. Changing the angle of attack, the separation bubble induced by freestream affects the vortex generated by wing flapping restrictedly, so there is no big difference at any angle of attack. hrough the 3D flow visualization, it was also found that the swallowtail can enhance the circulations around the trail during the downstroke when the flapping frequency is higher, regardless of the angle of attack. It is believed that the tail can enhance the flight stability of the Swallowtail butterfly.
Acknowledgment
This work was supported by the National Science Council of Taiwan (Grant No. NSC 99-2221-E-216-009 & NSC 100-2221-E-216-013).
References
[1] Azuma A, “The Biokinetics of Flying and Swimming”, 2nd edn. (Reston, VA: AIAA) , 2006
[2] Dudley R.,” Biomechanics of Flight In Neotropical Butterflies : Morphometrics Kinematics”, J. exp. Biol. 150:,37-53, 1990.
[3] Aono H, Liang F and Liu H, “Near- and far-field aerodynamics in insect hovering flight: an integrated computational study”, J. Exp. Biol. 211 239–57, 2008
[4] Tanaka, H. and Hoshino, K., Matsumoto K and Shimoyama, “ Flight dynamics of a butterfly-type ornithopter”, IEEE/RSJ Int. Conf.on Intelligent Robots and Systems, pp 310–315, 2005
[5] Betts, C.R. and Wootom, R.J., “Wing Shape and Behavior In Butterflies: A Preliminary Analysis”, J.Exp. Biol., 138, 271-288, 1988.
Figure 1 3D butterfly model and diagram of size on each part. (The upper one shows the top view, and the lower one shows the side view.)
A Study of the Aerodynamics of Butterfly-type Flapping Wing
(a)
(b)
(c)
(d)
Figure 3 Illustrations of pressure on upper and back wing surface at different and angles of attack of 40o, and t/T=2.75. The left one is upper wing surface, the right one is back wing surface. (a) J-1=4.12、(b) J-1=2.06、(c) J-1=1.03、
(d) J-1=0.515
Figure 4 Curves of , , and in a cycle at
f
7
Hz
,
10
o. The black line is the wing with swallowtail, the red line is the wing without swallowtailVortices distributions at
10
oFigure 5 Plots of particle traces and vorticity contours on upper wing surface at
f
7
Hz
,
10
o,40˚, and t/T=2.25.The left one is the wing with swallowtail, the right one is the wing without swallowtail.
1
J
L