A Study Comparing the Brain Function of Healthy
and ADHD Adults During Rest and Stroop
Task in EEG/ERP and fMRI
WIRB # W366823792. Investigators: Cynthia Kerson, PhD Leslie Sherlin, PhD Estate Sokhadze, PhD Rex Cannon, PhD David Hubbard, MD Sponsors:ISNR Research Foundation 1925 Francisco Blvd. E. #12
San Rafael, CA 94901 (415) 485-‐1344
Hubbard Foundation 10065 Old Grove Road
San Diego, CA 92131 (858) 444-‐3595
Medical Monitor: Dr. David Hubbard 10065 Old Grove Road
San Diego, CA 92131 (858) 444-‐3595
Research Site: Applied fMRI Institute 10065 Old Grove Road San Diego, CA 92131
(858) 444-‐3595
Table of Contents: Abstract ……….…………. 3
Purpose of Study and Background ………. 4
Criteria for Subject Selection ……….………….. 6
Methods and Procedures……….. 7
Risk/Benefit Assessment ……….……… 10
Subject Identification, Recruitment and Consent/Assent ………….. 11 Investigator Signatures……… 13 References ……….……… 14 Appendices ……… 16
Abstract:
Discussion: The prevalence of Attention Deficit Hyperactivity Disorder (ADHD) is an estimated 4.1% in adults, second only to depression. Recently, several quantitative electroencephalographic (QEEG), event-‐related potential (ERP) and functional magnetic resonance imaging (fMRI) studies have been completed to examine electrophysiological and blood flow behaviors in adults with Attention Deficit Hyperactive Disorder (ADHD). This study will utilize concomitant neuroimaging methodologies to examine the default mode network (DMN) in healthy and ADHD adults to ascertain differences during rest and Stroop task. The DMN consists of twelve functionally related regions (see illustration -‐ right) that are consistently shown increased in activity in an eyes-‐closed resting condition as compared to functionally specific cognitive tasks or eyes-‐opened resting condition. Recent data indicate dysfunction in right parietal areas in ADHD as compared to control. However, the strength of the temporal connections in EEG frequency domains has not been investigated in this population.
Objectives: This EEG/ERP/fMRI study proposes to correlate brain behavior from each neuroimaging method and elucidate functional connectivity patterns in the ADHD group during resting state (eyes open and eyes closed) and an active cognitive task (Stroop). Recruitment of neural resources involving temporal correlations may provide important information about both attentional and self-‐regulatory processes in ADHD individuals as compared to healthy controls. These data may provide important information relating to potential biomarkers for ADHD as well as to increase the specificity of methods for neurotherapy
treatment of ADHD. The data may also confirm that EEG is an adequate methodology to evaluate ADHD. Given the regional deficits shown in ADHD research we will examine the default network regions and their specific relationship with the bilateral anterior insular cortices (see illustration – right). Numerous regions within the default network, especially left medial prefrontal and anterior medial regions are shown
(assuming sources at or near the surface electrode F3, Fz, F7 contribute to the ERP average) to contribute many of the putative mechanisms found in ERP research (e.g., frontal NoGo-‐N2 and P3, Error-‐related Negativity, etc.).
Methods: In this study, we are recruiting 16 subjects, (8 healthy and 8 ADHD adults). We will attempt to recruit an equal number of age-‐similar males and females. The ADHD adults are being recruited through local clinicians and CHADD chapters. They are initially interviewed by phone and administered the Connors Rating Scale and the Mini International Neuropsychiatric Interview (M.I.N.I) to determine accuracy of symptom reporting, and to rule out psychological comorbidities. Exclusion criteria consists of previous head trauma, recent drug or alcohol abuse (14 days) or neurological syndromes. We are recording sequential 19channel EEG, ERP and fMRI during the eyes open and closed states and while performing the Stroop test. Eyes open and eyes closed states are also being recorded for approximately 5 minutes. The Stroop test takes approximately 20 minutes to administer. The QEEG results will be evaluated with comparison to a normative database and with the standardized low-‐resolution electromagnetic tomography (eLORETA) analysis. Functional connectivity will be assessed using the seed-‐based approach in eLORETA. The fMRI results will be evaluated using Brain Voyager™ and other neuroimaging software packages. **Abstract updated from ISNR Poster Sept 14, 2010**
Purpose of Study and Background
Purpose: The prevalence of Attention Deficit Hyperactivity Disorder (ADHD) is an estimated 3-‐5% in adults (Dopheide, JA, 2009), second only to depression. Two to 8% of college students report symptoms of attention disorders (DuPaul et al, 2009). It is more prevalent in males than females (Brown, et al, 2010). The presence of this abnormality affects quality of life; it may lead to
substance use disorders and often negatively impacts school performance.
The brain has been studied extensively while undertaking conscious, cognitive, emotive and memory tasks. Yet, there are systems within the brain that function during the resting state. These areas of activation, known as the default mode network (DMN) are specifically located in the left medial prefrontal cortex, medial temporal lobe, posterior cingulate cortex, precuneus, insular cortices and parietal cortices and activate when the brain is in a wakeful rest, such as
daydreaming, retrieving memories and other internal processes.
The twelve functionally related regions of the DMN consistently show an increase in activity in an eyes-‐closed resting condition as compared to functionally specific cognitive tasks or eyes-‐opened resting condition. Recent data indicate dysfunction in right parietal areas in ADHD as compared to control (Uddin, et al, 2008). However, the strength of the temporal connections in EEG frequency domains has not been investigated in this population.
Given the regional deficits shown in ADHD research we will examine the default network regions and their specific relationship with the bilateral anterior insular cortices. Numerous regions within the default network, especially left medial prefrontal and anterior medial regions are shown (assuming sources at or near the surface EEG electrodes F3, Fz, F7 contribute to the ERP average) to contribute many of the putative mechanisms found in ERP research (e.g., frontal NoGo-‐N2 and P3, Error-‐related Negativity, etc.).
Quantitative Electroencephalogram (qEEG) is the procedure in which the brain’s electrical
processes are recorded. QEEG is comprised of computerized imaging and statistical procedures to aid in the detection of abnormal patterns associated with specific pathological conditions. It is a direct and reliable signature of neural activity and provides ideal temporal resolution in the millisecond time domain (Coburn, et al., 2006; Hughes & John, 1999).
Event-‐related potentials (ERPs) are time-‐locked responses to external or internal stimuli that can be extracted from the EEG. ERPs are proposed to reflect external or internal monitoring processes. ERP Event-‐related potential (ERP) is a brain response to an internal or external stimulus. They are measured with electroencephalography. As the EEG reflects thousands of simultaneously ongoing brain processes the brain response to a single stimulus or event of interest is not usually visible in the EEG recording of a single trial; to see the brain response to the stimulus, EEG responses must be averaged across multiple trials. While evoked potentials reflect the processing of the physical stimulus, ERPs are caused by the "higher" level cognitive processes that might involve memory, expectation, attention or changes in the mental state, among others.
Functional MRI (fMRI) measures the surge of blood in response to activation of clusters of neurons, called the BOLD signal. Deoxyhemoglobin is paramagnetic such that it causes a local distortion in the magnetic field which can be picked up by the scanner. The scanner, in our case is a 3T Siemens tim Trio, which can be used for static images such as used in clinical diagnostic radiology. In fMRI the images are collected every two seconds. The task condition is contrasted with a baseline condition, typically fixation on a cross-‐hair, eyes closed rest, and a simple attention task. The task may be event-‐related, i.e. presenting brief stimuli, typically 2-‐4 seconds repeated multiple times, or a block design, typically 20 to 60 seconds, that are presented 3 to 5 times. The data is then analyzed using Brain Voyager or another software analysis program such as AFNI, SPM or FSL.
Recently, several quantitative electroencephalographic (QEEG) (Mazahari, et al, 2010), event-‐ related potential (ERP) (Kropotov, et al, 2007 & Kropotov, et al, 2005) and functional magnetic resonance imaging (fMRI) (e.g.Hoekzema, et al, 2010; Agarwal, et al, 2010, Beauregard & Levesque, 2006 and Verkhlyutov, et al, 2010) studies have explored the etiology and pathological manifestations incurred in ADHD subjects. Additionally, some studies have examined the
relationship between electrophysiological and hemodynamic behaviors (see Otswald, et al, 2010; Uddin, et al, 2008; Karakaws, et al, 2009; Matsuda, et al, 2002, among others) by incorporating either sequential or simultaneous recordings. The comparison of simultaneous and/or sequential EEG/ERP and fMRI recordings resolves the question of the spatial (fMRI) and temporal (EEG/ERP) relationship of brain function. Correlating these two modalities allows for a more comprehensive description of the underlying brain processes.
Measuring simultaneous EEG/ERP and fMRI may be problematic. One concern may be possible timing issues with regards to the Go/NoGo task between the MR scanner and EEG methodologies. The fMRI needs a full two seconds of stimulus presence to accurately determine spatial activation, while EEG can interpret a faster signal, ascertaining temporal performance.
Bregadze and Lavric (2006) looked at concurrent recordings of event related potentials (ERP) and fMRI using a Go/NoGo paradigm and concluded that recording simultaneously does not impact the ERP in a significant way. However, Karakas, et al (2009) found that the MR environment
compromised the integrity of the ERP due to a more effortful cognitive processing on the part of the subject. Because of this current uncertainty, this study will utilize sequential neuroimaging methodologies to examine the default mode network (DMN) and task positive networks in healthy and ADHD adults to determine differences during rest and Go/NoGo task. Half of the subjects will undergo the rest and Go/NoGo task states while firstly recording EEG and secondarily recording fMRI and the other half will be first recorded in the MR scanner.
Recruitment of neural resources involving temporal and spatial correlations may provide
important information about both attentional and self-‐regulatory processes in ADHD individuals as compared to healthy controls. These data may provide important information relating to potential biomarkers for ADHD as well as to increase the specificity of methods for neurotherapy treatment of ADHD, successfully reducing the psychological, social and economic impact this disorder has. The data may also confirm that EEG is an adequate stand-‐alone methodology to
evaluate ADHD. This study will also provide data for consideration in recording EEG/ERP and fMRI in a combined study.
Criteria for Subject Selection
Number of Subjects: 8 healthy adults, 8 ADHD adults
Gender of Subjects: There are no gender-‐based enrollment restrictions other than maintaining equitable inclusion and creating two groups that are matched in age, sex and educational level.
Age of Subjects: Adults aged 18-‐60
Racial and Ethnic Origin: There are no racial or ethnic restrictions.
Inclusion Criteria: • Adults age 18-‐60
• Meeting criteria as stated on the phone interview questionnaire met for ADHD
• Cutoff score to determine the presence of AD/HD on the Connors Adult ADHD Rating Scale (CAARS) (ADHD subjects)
• Indication on the M.I.N.I. of AD/HD symptoms (ADHD subjects)
• Unmedicated for ADHD or refrained from medication intake for 24 hours prior to testing
• Ability to read in English.
• Provision of informed consent.
Exclusion Criteria:
• The following comorbid mental health conditions o Bipolar disorder
o Substance dependence
o Schizophrenia or other psychotic disorder o Claustrophobia
• Medication use beyond those for AD/HD • Minors (under age 18 years of age) • No pregnant woman
• Pace maker
• Have significant cognitive impairment that would prohibit them from understanding informed consent
• Visibly intoxicated or disoriented during the intake process • The following medical conditions:
o Epilepsy or other seizure disorder o Traumatic Brain Injury
o Stroke or other vascular or systemic insult
o Arteriovenous Malformations
• Pregnant Women: This procedure may involve unknown, unforeseeable risks to the subject and/or to the embryo or fetus, if the subject is or may become pregnant.
• No prisoners, institutionalized persons, persons with decisional incapacity, minors or nursing home residents will be included in this study.
Methods and Procedures:
Methods and Procedures: The prospective subject will respond to the invitation by calling the principle investigator. During that time, a phone interview will be arranged. During the scheduled phone appointment a script will be adhered to (Appendix A). The Connors Adult ADHD Rating Scales (CAARS) (Connors, et al, 1999) and the Mini International Neuropsychiatric Interview v. 5.0.0 (M.I.N.I) (Sheehan, et al, 1998) will be administered to determine subject classification (healthy or normal) or excluded. Additionally, a medical history intake form will be administered (Appendix B). If the subject is deemed included, an appointment will be scheduled for the MR and EEG recordings.
On the day of the recording, the participant, who will be instructed to wash his or her hair (so that it is dry during the testing), and leave it without any gels, mousses or sprays. He/she will also be told to remove all metals, including belt buckles, piercings and bras with metal wiring or buckles. The subject will either be scanned or EEG-‐recorded first as determined by a random flip-‐flop sequence so as to avoid test-‐retest confounding and/or any possible reaction to the first modality during the second one.
The qEEG recording takes approximately 1 hour and will be taken with the following protocol, each for approximately 5 minutes: while the patient sits still with eyes open, with eyes closed and during the Go/NoGo task.
During the qEEG, the patient will wear a spandex cap, provided by Electro-‐Cap International (Electro-‐Cap, Int., Eaton, Ohio). The cap contains the locations for 19 sites, as designated by the International 10-‐20 system (Jasper, 1958). A tape measure will be used to measure the
circumference of the scalp. This length, taken in centimeters, determines the size of the cap.
The participant will sit in a recliner chair, in a dimly illuminated and sound attenuated room at the Applied fMRI Institute. Each electrode site, as well as the ears, will be prepared with Nuprep, a mild abrasive gel to remove any oil from the skin. Once prepped, the cap will be placed onto the subject’s head so that it fits snuggly and is centered correctly over the electrode sites on the scalp, aligning the cap so it matches with the site Fz on the forehead. Once the cap is on and correctly positioned, the researcher will begin to apply the Electro-‐Gel (Electro-‐Cap, Int., Eaton, Ohio) conductive gel. The gel is inserted into each site with a blunt-‐ended syringe. During site preparation, impedance measurement is taken, to ascertain that impedance between 3 and 5 kOhms is present.
The qEEG recording begins with eyes open. The participant will be instructed to remain still and look softly at a point just below eye level. In the second section the participant will close his eyes and remain still for a period approximately 5 minutes. The third task, the Go/NoGo task lasts
approximately 10 minutes. The length of recording time during the resting states (eyes open and eyes closed) is determined by the retrieval of at least 1 to 2 minutes of clean artifact-‐free (eye blinks and muscle tension are the predominant artifacts) brain wave data and usually lasts about 5 minutes.
The EEG will then be recorded at the standard 10-‐20 system 19 locations (FP1, FP2, F3, F4, Fz , F7, F8, C3, C4, Cz, T3, T4, T5, T6, P3, P4, Pz, O1, and O2) using the Mitsar 202 (Mitsar Ltd, St
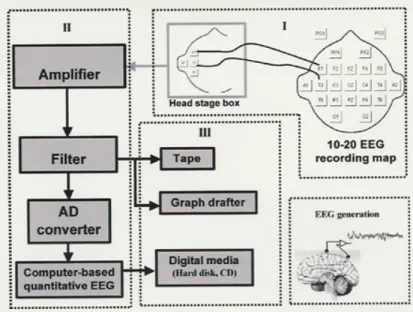
Petersburg, Russia) amplifier system and connected to a PC. The EEG is sampled by 24 bit AD converter at 250 samples per seconds and the low and high pass filters will be set at 0.0 and 50.0 Hz respectively. Data will be acquired using the WinEEG acquisition program. Data will then be transported into the Eureka software (Congedo & Sherlin, 2005a), where it will be plotted and carefully inspected using manual artifact-‐rejection. All episodic artifacts including eye blinks, eye movements, teeth clenching, body movements, or EKG artifact will be removed from the stream of EEG. Figure 1
This diagram, taken from Thackor & Tong (2004), illustrates the process of a qEEG acquisition. Figure I (above) depicts the electrode placement according to the 10-‐20 placement map. Figure II illustrates how the signals may be processed (and figure III shows three types of recording devices available. Currently, digital media is used most frequently in qEEG analysis.
For the fMRI protocol, the subjects change into hospital scrubs to be certain there are no objects in their pockets. They are provided with a noise-‐attenuated headset and placed in the isocenter of the magnet bore. Further instructions are provided over the headset. Instructions are shown on the screen and reviewed verbally over the headset with an emphasis on avoiding head movement. A localizer scan is done first and then the functional study is run, then a structural scan onto which the functional images can be overlaid. The VCPT is displayed digitally and the subject responds using a finger-‐tap pad designed to minimize any movement.
The Psytask (Mitsar Ltd, St Petersburg, Russia) visual continuing performance task (VCPT) is a modification of a visual two-‐stimulus GO/NOGO paradigm. Please refer to Kropotov and
Ponomarev (2009) and Mueller, et al (2010) for further discussion of this model. Three categories of visual stimuli are selected: 20 pictures of animals, 20 pictures of plants, and 20 pictures of humans (presented together with an artificial “novel” sound). The trials consisted of presentations of pairs of stimuli (see figure 1 ) animal-‐animal (GO trials), animal-‐plant (NOGO trials), plant-‐plant (IGNORE trials), and plant-‐human (NOVEL trials). The trials are grouped into four blocks. In each block a unique set of five animal stimuli, five plant stimuli and five human stimuli are selected. Each block consists of a pseudo-‐random presentation of 100 stimuli pairs with equal probability for each trial category. The task is to press a button as fast as possible in response to all GO trials.
According to the task design, two preparatory sets are distinguished in the trials. In the “Continue set” a picture of an animal is presented as the first stimulus and the subject is supposed to prepare to respond; in the “Discontinue set” a picture of a plant is presented as the first stimulus and the subject does not need to prepare to respond.
During the recording of the EEG, the subjects will be seated in a comfortable chair, approximately 5 feet in front of a computer screen. The stimuli will be presented on a 19 inch monitor as
described above. During the fMRI scan, the subjects will view the stimuli while lying on their back
looking thru a mirror above their head at a screen on which the stimuli are back-‐projected.
Data Analysis and Data Monitoring: The EEG data gathered from this study will be analyzed using the records acquired above, digitally corrected and interpreted using the normative EEG
databases, eLORETA and ICA (independent component analysis) operations. The data received from the fMRI scan will be interpreted with the BrainVoyager analysis program.
QEEG is interpreted with spectral analysis, which is a mathematical method allowing a signal to be broken up into its frequency components. Frequency components vary between 0.0 Hz and
100Hz and are grouped into frequency ranges as follows: event related potentials (0.0-‐0.5 Hz), delta (0.5-‐4.0 Hz), theta (4-‐8 Hz) low frequency (0.5-‐8 Hz), alpha (8-‐13 Hz), alpha1 (8-‐10 Hz), alpha2 (10-‐12 Hz), beta1 (12-‐16 Hz), beta2 (16-‐20 Hz), beta3 (20-‐24 Hz), beta4 (24-‐28 Hz), beta 5 (28-‐32 Hz), high frequency (13-‐32 Hz), and gamma (32-‐ 50 Hz). We will investigate frequency changes in the prefrontal and anterior medial regions both at rest and during the Go/NoGo task.
Inverse solutions deal with the EEG/MEG neuroimaging problem: given measurements of scalp electric potential differences (EEG) finds the 3D distribution of the generating electric neuronal activity. This problem has no unique solution. Only particular solutions with “good” localization properties are of interest, since neuroimaging is concerned with the localization of brain function. A general family of linear imaging methods with exact, zero error localization to point-‐test sources is Low Resolution Electromagnetic Tomography (LORETA). One particular member of this family is eLORETA (exact low resolution brain electromagnetic tomography), which is a genuine inverse solution (not merely a linear imaging method, nor a collection of one-‐at-‐a-‐time single best fitting dipoles) with exact, zero error localization in the presence of measurement and structured biological noise.
ICA, developed at Matlab (Helsinki, Finland), is a process by which individual features of the EEG signal are decomposed to elucidate the ERP. Discussion on the mathematical ICA process can be found in Kropotov & Ponomarev (2009), Mueller et al (2010) and Hyvärinen et al (2000) among many others.
The fMRI data will be interpreted using the BrainVoyager interpretation software. The software aligns the functional and structural images, removes motion and other artifacts, and contrasts the baseline and task conditions for each voxel which is typically 2-‐3mm on a side.
This study does not include treatment, so rules specific to treatment do not apply.
Data Storage and Confidentiality:
Subject data will be stored on the principle investigator’s laptop computer for ease of availability. This computer is password-‐protected. The individual subject identifiers will be stored separately.
Transition from Research Participation: Since this study does not include treatment and requires only approximately 2 to 2 ½ hours on a single day, the subject is expected to transition to normal life with no difficulty. There may remain residual electro-‐gel which may cause minimal discomfort. The subjects will be forewarned to plan to shower immediately after their participation.
Risk/Benefit Assessment:
Risk Category: This research study presents minimal risk to the subjects. There are no known risks to fMRI scanning and/or EEG recording beyond the small level of discomfort in participating in their acquisitions as long as the disclosure from the subjects can be appropriately relied upon.
Potential Risk: The only risk may be an anxious episode experienced by the subject while in the MR scanner due to a perceived sense of claustrophobia.
Protection against Risk: Since this study does not include treatment, there is little risk and thus the need for protection is minimal. All potential subjects may decide not to participate and may refuse to answer any question or forego the second modality if the first created maximal discomfort.
Potential Benefits to the Subjects:
The study does not include invasive treatments. Therefore, there are no known risks to subjects. In the event a participant falls and or otherwise hurts himself in the Applied fMRI Institute, Applied fMRI Institute has liability insurance. Additionally, if a participant feels it necessary to report abusive or inappropriate behavior or feels the researchers provided inadequate or inappropriate treatments, all investigators have malpractice insurance.
Alternatives to Participation: The alternative to participation is non participation, which is in no way harmful or disruptive to any possible current treatments.
Method of Subject Identification and Recruitment: Subjects shall be assigned an identification code by the investigator; all data forms shall identify the subject by this identification code only. This information will not be stored with any other data and no other identifying information will appear on any form. All follow-‐up contacts will be made by the investigator who will preserve confidentiality when telephoning or mailing information to subjects. Information on the
preferential means to contact subjects will be obtained (i.e. message vs. no message). All materials with identifying information will be kept in locked files. All materials (hardcopy instruments) will be identifiable only through the coded ID number and kept under lock and key at the
investigator’s office in San Rafael, California. During this screening interview subjects will not be asked their name until they meet eligibility criteria to ensure confidentiality. If ineligible, subjects will not be asked their identifying information. If eligible, subjects will be given a code number and their identifying information will be kept separate from their screening information.
The ADHD subjects will be recruited through local CHADD (Children and Adults with Attention Deficit/Hyperactivity Disorder) chapters and local neurofeedback, psychological and medical practitioners. The healthy subjects will be recruited through word of mouth.
Process of Consent: When the prospective subject presents for the assessment, an investigator will review the fMRI and EEG protocols with him/her in detail, and will present the informed consent form. Subjects will be informed that they will have an equal chance of being in either group. The investigator will review the consent form in detail with each subject. When the subject has fully understood the consent he will be asked to sign. Informed consent shall be obtained under the following conditions: a) the subject shall have sufficient opportunity to consider participation in the study, b) informed consent shall be obtained without coercion or undue influence, c) informed consent shall be written in the native language of the subject and administered by approved personnel who speak the native language of the subject, d) a subject will not be led to believe that they are waiving their rights as a subject or the liability of the sponsor or investigator. Each subject shall be given one copy of the signed informed consent (Appendix C).
Subject Capacity: All subjects will have capacity to give informed consent as they are all adults and will be excluded based upon comorbid conditions that will also render them incapable.
Subject/Representation Comprehension: The subjects will be given as much time as needed to decide to participate in the study after they have read the informed consent and given the opportunity to ask as many questions as needed.
Debriefing Procedures: Once the records are interpreted, the investigator will arrange for a phone debriefing in which she will inform the subject of the findings of the individual’s testing and how it relates to the results of the overall groups. She will transmit the QEEG and MRI scans to the
subject electronically and/or via mail to help the subject fully understand the results. There is no information purposefully withheld from subjects.
Consent Forms: See Appendix C, which complies with FDA CFR 50.25 guidelines.
Documentation of Consent: The process is explained above. The PI will ensure that all informed consents are properly obtained and documented by signing each form herself and filed in a locked file cabinet in her office in San Rafael, California.
Costs to the Subject: There is no cost to the subjects other than personal expense and time to travel to and from the facility.
Payment for Participation: There is no payment for inclusion in the study other than a debriefing of the results of the recordings.
Investigator Signatures: Cynthia Kerson, PhD (415) 485-‐1344 _____________ [email protected] Leslie Sherlin, PhD (480) 219-‐3048 _______________ [email protected] Estate Sokhadze, PhD (502) 852-‐0404 __________ [email protected] Rex Cannon, PhD (865) 300-‐4983 _______________ [email protected] David Hubbard, MD (858) 444-‐3595 ___________ [email protected]
References:
Agarwal N, Port JD, Bazzocchi M, Renshaw PF. (2010) Update on the use of MR for assessment and
diagnosis of psychiatric diseases. Radiology. Apr;255(1):23-‐41.
Bregadze, N. & Lavric, A. (2006). ERP differences with vs. without concurrent fMRI. International Journal of Psychophysiology. Vol. 62 54-‐59
Conners, C. K., Erhardt, J. N., Epstein, D., Parker, J. D. A., Sitarenios, G., & Sparrow, E. (1999). Self-‐rating of ADHD symptoms in adults I: Factor structure and normative data.
Journal of Attention Disorders, 3(3), 141–151.
Beauregard, M & Levesque, J (2006). Functional magnetic resonance imaging investigation of the effects
of neurofeedback training on the neural bases of selective attention and response inhibition
in children with attention-‐deficit/hyperactivity disorder. Applied Psychophysiology &
Biofeedback, 31(1) 3-‐20
Coburn, KL, Lauterbach, EC, Boutros, NN, Black, KJ, Arciniegas, DB, & Coffey, CE. (2006). The value of quantitative electroencephalography in clinical psychiatry: a report by the Committee on
Research of the American Neuropsychiatric Association. J Neuropsychiatry Clin Neurosci,
18(4), 460-‐500.
Congedo, M. & Sherlin, L. (2005a). Multiple Hypothesis Testing (MHyT) [Computer software]. Knoxville,
TN: Nova Tech EEG, Inc.
Dopheide, JA. (2009). Attention-‐deficit-‐hyperactivity disorder: An update. Pharmacotherapy.
Jun;29(6):656-‐79
DuPaul, GJ, Weyandt, LL, O’Dell, SM, Varejao, M. (2009). College students with ADHD: current status and
future directions. Journal of Attention Disorders. Nov;13(3):234-‐50.
Hyvärinen, A, Oja, E. (2000). Independent component analysis: Algorithms and applications.
Neural Networks. 13(4-‐5): 411-‐430
Hoekzema E, Carmona S, Tremols V, Gispert JD, Guitart M, Fauquet J, Rovira M, Bielsa A, Soliva JC,
Tomas X, Bulbena A, Ramos A, Casas M, Tobeña A, Vilarroya O. (2010). Enhanced neural
activity in frontal and cerebellar circuits after cognitive training in children with attention-‐deficit/hyperactivity disorder. Human Brain Mapping. Mar 24
Hughes JR, John ER. (1999). Conventional and quantitative electroencephalography in
Psychiatry. .Journal of neuropsychiatry & clinical neurosciences. Vol 11: 190
Jasper, HH. (1958). The ten-‐twenty electrode system of international federation.
Karakas, HM, Karakas, S, Özkan Ceylan, A, Tali, ET. (2009). Recording event-‐related activity under hostile magnetic resonance environment: Is multimodal EEG/ERP-‐MRI recording possible? International Journal of Psychophysiology; vol 03, 006
Kropotov, J D. & Valery A P. (2009). Decomposing N2 NOGO wave of event-‐related potentials into
independent components. Neuroreport 20, no. 18
Kropotov, J. D., Grin-‐Yatsenko, V. A., Ponomarev, V. A., Chutko, L. S., Yakovenko, E. A., & Nikishena, I. S.
(2007). Changes in EEG spectograms, event-‐related potentials and event-‐related
desynchronization induced by relative beta training in ADHD children. Journal of
Neurotherapy, 11(2), 3-‐11.
Kropotov, JD, Grin-‐Yatsenko, VA, Ponomarev, VA, Chutko, LS, Yakovenko, EA, Nildshena, IS.
(2005). ERPs correlates of EEG relative beta training in ADHD children. International
Journal of Psychophysiology, 55(1), 23-‐34
Matsuda, T, Matsuura, M, Ohkubo, T, Ohkubo, H, Takahashi, K, Tamaki, M, Atsumi, Y, Matsushima, E, Taira, M, Kojima, T. (2002). Simultaneous recording of EEG and functional MRI. International Congress Series: 1232 351-‐355
Mazaheri A, Coffey-‐Corina S, Mangun GR, Bekker EM, Berry AS, Corbett BA. (2010). Functional disconnection of frontal cortex and visual cortex in attention-‐deficit/hyperactivity disorder.
Biological Psychiatry. Apr 1;67(7):617-‐23.
Mueller, A, Candrian, G, Kropotov, JD, Ponomerev, V, Baschera, G. (2010). Classification of ADHD patients on the basis of independent ERP components using a machine learning system. Biomedical Physics, 2010, 4, S1, in press.
Otswald, D, Porcara, C, Bagshaw, AP. (2010). An informative theoretic approach to EEG-‐ fMRI
integration of visually evoked responses. NeuroImage: 49, 498-‐516
Sheehan DV, Lecrubier Y, Harnett-‐Sheehan K, Amorim P, Janavs J, Weiller E, Hergueta T, Baker
R, Dunbar G. (1998). The Mini International Neuropsychiatric Interview (M.I.N.I.): The development and validation of a structured diagnostic psychiatric interview.
Journal of Clinical Psychiatry; 59 (suppl 20):22-‐33.
Thackor, NV, Tong, S. (2004). Advances in quantitative electroencephalogram analysis methods.
Annual
Review of Biomedical Engineering. 2004; 6:453-‐96
Uddin, LQ, Kelly, AM, Bharat, B, Margulies, DS, Shehzad, Z, Shaw, D, Ghaffari, M, Adler, LA, Castellanos, FX, Milham, MP, 2008. Network homogeneity reveals decreased
Verkhlyutov VM, Gapienko GV, Ushakov VL, Portnova GV, Verkhlyutova IA, Anisimov NV, Pirogov YA
(2010) MRI morphometry of the cerebral ventricles in patients with attention deficit
hyperactivity disorder. Neuroscience and Behavioral Physiology. 2010 Mar;40(3):295-‐303
Appendices
Appendix A ………. Phone Script Appendix B ………. fMRI Intake Appendix C ………. Informed Consent