Revista de Gestão
Logistic service quality as a mediator between logistics capabilities and customer satisfaction
Daniel Winter Fernandes, Roberto Giro Moori, Valdir Antonio Vitorino Filho,
Article information:
To cite this document:
Daniel Winter Fernandes, Roberto Giro Moori, Valdir Antonio Vitorino Filho, (2018) "Logistic service quality as a mediator between logistics capabilities and customer satisfaction", Revista de Gestão, Vol. 25 Issue: 4, pp.358-372, https://doi.org/10.1108/REGE-01-2018-0015
Permanent link to this document:
https://doi.org/10.1108/REGE-01-2018-0015 Downloaded on: 10 October 2018, At: 17:37 (PT)
References: this document contains references to 59 other documents. The fulltext of this document has been downloaded 510 times since 2018*
Access to this document was granted through an Emerald subscription provided by All users group
For Authors
If you would like to write for this, or any other Emerald publication, then please use our Emerald for Authors service information about how to choose which publication to write for and submission guidelines are available for all. Please visit www.emeraldinsight.com/authors for more information.
About Emerald www.emeraldinsight.com
Emerald is a global publisher linking research and practice to the benefit of society. The company manages a portfolio of more than 290 journals and over 2,350 books and book series volumes, as well as providing an extensive range of online products and additional customer resources and services.
Emerald is both COUNTER 4 and TRANSFER compliant. The organization is a partner of the Committee on Publication Ethics (COPE) and also works with Portico and the LOCKSS initiative for digital archive preservation.
*Related content and download information correct at time of download.
Logistic service quality as a
mediator between logistics
capabilities and customer
satisfaction
Daniel Winter Fernandes, Roberto Giro Moori and
Valdir Antonio Vitorino Filho
Programa de Pós-Graduação em Administração de Empresas, Universidade Presbiteriana Mackenzie, Sao Paulo, Brazil
Abstract
Purpose–A way that companies have found to respond to the challenges of customer satisfaction (CS) is the development logistics services quality. In this sense, the purpose of this paper is to estimate the quality of logistical service as a mediator factor in the relationship between logistics capabilities (LC) and CS. For this, an exploratory survey of the descriptive type was carried out with 117 companies in the Brazilian market of lubricant oil. The collected data, modeled in structural equations, have shown evidence that the quality of logistics services totally mediates the relation between the LC and the satisfaction of clients.
Design/methodology/approach–In order to respond to the research problem and to meet the stated objective, a study was carried out in two phases. The first used an exploratory qualitative design, and involved recorded in-depth interviews with five clients and five managers of a lubricant oil producer located in the municipality of Umuarama and nearby areas in Paraná state, Brazil. The second used an exploratory survey of the descriptive type was carried out with 117 companies in the Brazilian market of lubricant oil. Findings–The collected data, modeled in structural equations, have shown evidence that the quality of logistics services totally mediates the relation between the LC and the satisfaction of clients.
Research limitations/implications–It is suggested that new studies be conducted in order to increase the size of the sample, since the number of responses obtained (117 respondents), for the number of initial variables (34 measures).
Practical implications–In the pursuit of CS, the managers of lubricant oil producers should make major investments in LC, to enable the company to be active in the search for logistics solutions, integration and provision of reliable information to its customers.
Social implications–The studies should also be carried out in other market segments, in order to compare the results obtained in the lubricating oil segment of Brazil and corroborate knowledge about the influence of logistical capabilities on the relation between logistics service quality and CS.
Originality/value–The logistics services quality perceived by the customers is derived from the service capacity of the producer’s employees and the quality of information provided to the customers.
KeywordsLogistics service quality, Consumer satisfaction Paper typeResearch paper
1. Introduction
Customer satisfaction (CS) is a fundamental concept in marketing and business strategy (Bowersoxet al., 2014). Kottler (2000) posits that CS consists of the feeling of pleasure or disappointment resulting from the comparison between the expectations of the buyer and perceived performance (or result) of a product. According to Sharmaet al.(1995), CS arises the moment a company manages to provide a logistics service that meets or exceeds the
Revista de Gestão Vol. 25 No. 4, 2018 pp. 358-372 Emerald Publishing Limited 2177-8736 DOI 10.1108/REGE-01-2018-0015 Received 9 January 2018 Revised 3 April 2018 25 April 2018 Accepted 29 May 2018
The current issue and full text archive of this journal is available on Emerald Insight at:
www.emeraldinsight.com/2177-8736.htm
© Daniel Winter Fernandes, Roberto Giro Moori and Valdir Antonio Vitorino Filho. Published in the
Revista de Gestão. Published by Emerald Publishing Limited. This article is published under the Creative Commons Attribution (CC BY 4.0) licence. Anyone may reproduce, distribute, translate and create derivative works of this article (for both commercial and non-commercial purposes), subject to full attribution to the original publication and authors. The full terms of this licence may be seen at http://creativecommons.org/licences/by/4.0/legalcode
358
REGE
25,4
customer’s expectations. Mentzeret al. (2001) suggest that logistics service quality (LSQ) can influence CS.
Novaes (2007) emphasizes that modern logistics seeks to fully incorporate CS by maintaining an adequate and pre-established standard of logistics service. Daughertyet al. (1998) argue that logistics capabilities (LC) are associated with high levels of CS. The authors define LC as a subset of resources that enable the firm to exploit other resources more efficiently (Barney and Hesterly, 2013), and to distinguish itself from its competitors (Chaseet al., 2006). Esperet al.(2007) add that the search for competitive advantage can occur through the differentiation of the logistics services provided, which would influence CS.
Nevertheless, it is important to understand some of the problems and constraints of the emphasis on CS. Bowersox et al. (2014) report three limitations: the interpretation of satisfaction; the fact that satisfied customers are not necessarily loyal customers; and the problem that what satisfies one customer may not satisfy another (completely or at all). In this sense, Christopher (1999) suggests identifying customer service needs through market research to understand the nuances of services that differentiate customers.
Ensuring that a customer is satisfied may require the company to reinvent the way the product is manufactured, distributed or offered for sale. One way to meet the challenges of CS is to develop value-added services (Bowersoxet al., 2014).
The evolution of LSQ and LC can affect client satisfaction; however, studies about the influence of LC on the relationship between logistics quality and CS are scarce (Malgorzata and Gajewska, 2014).
In this context, the present study has, as a research problem, the following question: RQ1. Does LSQ mediate the relationship between LC and CS with companies in the
lubricating oil business?
The objective was to examine the importance of LSQ as a mediating factor in the relationship between LC and CS.
The study is structured as follows: after this introduction, Section 2 describes the theoretical foundations and hypotheses that support the study. Section 3 details the methodological procedures, followed by an analysis of data and results in Section 4. Finally, Sections 5 and 6 present the discussion, conclusion and suggestions for the continuation of the research.
2. Theoretical rationale
The scholarly works of Sharmaet al.(1995), Mentzeret al. (2001) and Sauraet al. (2008) identified that the quality of the logistics service can have a positive and significant impact on CS. Morash et al. (1996), Daughertyet al. (1998), Esper et al. (2007) and Glicor and Holcomb (2012) observed that companies that developed specific LC were able to achieve CS through them.
Likewise, Morash (2001) and Richeyet al.(2007) identified the influence of LC on LSQ. Next, we present the theoretical framework that bundles together the LC, LSQ and CS constructs, highlighting both the direct and indirect impact of LC on CS via LSQ (i.e. mediated by LSQ).
2.1 LC and CS─direct impact
Capabilities constitute a subset of a company’s resources, and are defined as tangible and intangible assets that enable the company to fully use its other resources (Barney and Hesterly, 2013). Grant (1991) argues that capabilities are the primary sources of company profitability and competitive advantage. Capabilities, in isolation, do not allow a company to devise and implement its strategies, but allow it to marshal other resources to create and implement such strategies (Barney and Hesterly, 2013). For Helfatet al.(2007), capabilities
359
Logistic
service quality
have three functions: ability to change the resource base; ability to act on a recurring basis to modify the resource base; and ability to search for and select the modifications to be made (Helfatet al., 2007).
By exploiting the full potential of LC, a firm can achieve high levels of CS (Daugherty
et al., 1998). Morash et al. (1996) identify five logistical capabilities oriented to provide
customer services that influence a firm’s performance: pre-sales customer service; after-sales customer service; speed of delivery; reliability of delivery; and customer responsiveness. Convergent with the studies performed by Morashet al.(1996) is the study developed by Fawcett et al. (1997), which shows that LC that combine delivery speed and reliability together with flexibility and responsiveness are key components of the logistics service in the pursuit of CS.
The increasing adoption of automation and information technology (IT) in firms enables them to achieve greater success in their abilities to provide, receive and integrate information with their clients to offer a differentiated logistics service (Glicor and Holcomb, 2012). Information integration can improve services and reduce costs at the same time, as well as significantly influence LC, enabling firms to invest heavily in databases to share information between customers and suppliers (Liu and Luo, 2012). This competitive advantage can be achieved through the differentiation of the logistics services provided, which, in turn, influence CS (Esperet al., 2007).
Furthermore, studies by Lynch et al. (2000) and Morash (2001) show a relationship between LC and CS: firms actively seeking solutions to logistical problems before they occur, and with the ability to develop creative logistics solutions for specific situations or emergencies, have a positive impact on CS (Lynchet al., 2000; Morash, 2001). Hence, we have the following hypothesis:
H1. There is a positive relationship between LC and CS.
2.2 CS, mediated by LSQ─indirect impact
In studies conducted in the early 1990s, Byrne and Markham (1993) showed that only 10 percent of firms achieved CS through logistics services. These authors alerted logistics managers of the importance of LSQ, since improving the quality of the logistics service had a positive impact on CS.
Sharma et al. (1995) explained the process of generating CS using the paradigm of nonconformity of expectations: CS is generated when the performance of the logistics service is equal to or greater than the client’s preconceived expectations. These authors classify the following attributes as having the highest impact on CS: product availability; after-sales service and support; efficient communication of the logistics service; documentation; and delivery time.
Importantly, Fornellet al. (1996) pointed out that when customer expectations are met, complaints diminish and CS increases. These expectations can be achieved through logistical flexibility. Logistical flexibility is understood as a firm’s ability to respond quickly and efficiently to customer needs related to the provision of logistics services (Zhanget al., 2005). Stopkaet al.(2016) argued that CS is very important for logistics companies seeking a competitive advantage because if they do not meet the expectations of their customers, this function will be assumed by other firms. The study by Linet al.(2016) on e-commerce firms in China showed that the quality of electronic service had a positive effect on CS. Nevertheless, the quality of their logistics service negatively affected CS.
Meiduté-Kavaliausjeiné et al. (2014) pointed out that LSQ increases the competitive advantage of the service provider, since it leads to consumer loyalty, in turn reducing the number of competitors and developing conditions favorable to the development of economies of scale. When selecting from the potential of the logistics service provider, consumers
360
REGE
25,4
evaluate the quality of service, but also the cost of service, technological solutions and the set of services delivered by the provider. This leads to the following hypothesis:
H1a. The LSQ mediates the relationship between LC and CS.
2.3 LC and LSQ
Lynchet al.(2000); Richeyet al.(2005) and Richeyet al.(2007) identify that LC influence the quality of the logistics service provided.
The study by Liuet al.(2010), conducted among logistics service providers in China, points out that logistical capability is the most critical for quality of service. Gotzamaniet al. (2010) analyze companies providing logistics services and conclude that LC have become indispensable for obtaining of LSQ, as well as improving financial performance for companies.
Glicor and Holcomb (2014) explore the role of LC in the achievement of agility, which has contributed to the increase in LSQ, in terms of manufacturing flexibility, supply chain speed and lean production. They also point out that the level of agility can determine the extent of efficiency and effectiveness in the quality of logistics services.
A number of academic studies have identified that the quality of logistics services and LC can influence CS. However, some studies have identified that LC have an influence on the LSQ. Hence, we have the following hypothesis:
H2. There is a positive relationship between LC and the LSQ.
2.4 LSQ and CS
The LSQ is defined as a set of performance factors, measured by the ability to distribute products in accordance with customer requirements (Yanget al., 2010). Various empirical studies have shown a relationship with company performance and CS, such as those of Mentzeret al.(1999, 2001), Panayides and So (2005) and Sauraet al.(2008).
In order to improve the knowledge of logistics managers about which logistics factors affect CS, Mentzeret al.(1999, p. 84) developed a scale measuring nine concepts to determine customers’ perception of the logistics services provided: personal contact quality; order release quantity; quality of information; ordering procedures; order accuracy; order condition; order quality; order discrepancy resolution; and punctuality.
Studies about the relationship between logistics services and CS indicate that the quality of the customer service personnel, the quality of the information and the quality of the orders has a positive and significant influence on CS. Likewise, satisfaction is positively and significantly dependent on the punctuality of the logistics service (Sauraet al., 2008).
In their study on the influence of IT tools on the relationship between logistics services quality and CS, Bienstock and Royne (2010) found that IT tools had no direct impact on CS, but rather on the quality of the logistics service, which, in turn, influenced CS. Likewise, Rao
et al.(2011) identified a strong correlation between LSQ, price of logistics service and CS.
When the logistics service was not included in the final price of the product, but paid for by the customer, the price of these services had a negative influence on CS.
Tontini and Zanchett (2010) found that customers evaluate the LSQ according to the following aspects: reliability of delivery deadline; agility in delivery; delivery of the correct quantity and correct product; no damage to goods; flexibility of the service rendered; overcoming problems; traceability; communication; trust and knowledge of the customer contact team; product and service availability; post-delivery support; and price.
In addition, Yanget al.(2016) argued that the logistics service increasingly contributes to the core competency of a company, therefore suggesting the use of quality function
361
Logistic
service quality
development to select the most effective strategic actions to meet customer needs. Here we reach the following hypothesis:
H3. There is a relationship between LSQ and CS.
3. Methodological procedures
3.1 Nature and type of research, sample, data collection instrument and research subject In order to respond to the research problem and to meet the stated objective, a study was carried out in two phases. The first used an exploratory qualitative design, and involved recorded in-depth interviews with five clients and five managers of a lubricant oil producer located in the municipality of Umuarama and nearby areas in Paraná state, Brazil. In this first phase, Umuarama was chosen due to accessibility of the area and to the fact that the firm was located in a region composed of critical and exacting consumers, making it appropriate as a test business. The interviews were carried out between November 4 and 6, 2014. The objective was to understand, identify and verify the adequacy of the measures and scales related to the three constructs that constitute the theoretical model studies. The interview results enabled the development of a preliminary version of the questionnaire which, based on the theoretical reference and interviews, enabled the identification of the constructs: LSQ, with 34 measures; LC, with 24; and CS, with 21 measures. Thus, the initial questionnaire consisted of 79 measures.
Given the high number of measures by constructs, the preliminary questionnaire was submitted to pre-tests in the period from March 2-6, 2015, to improve the content and understanding of the measures. A total of 12 customers from the lubricating oil market, located in the northern region of the state of Paraná, participated in these pre-tests. After the inclusion of suggestions from the participants in the pre-test phase, the final questionnaire was developed with 34 measures: LSQ¼14, LC¼10, CS¼10.
Based on a list of 5,200 clients of a lubricating oil producer, a judgment sampling (Malhotra, 2012) of companies located in the southern region of Brazil was selected to respond to the survey. In March 2015, the questionnaires were e-mailed to company managers involved in logistics activities, such as vendors, buyers and marketers. The e-mail included a brief presentation of the research, the objectives and the link to access the questionnaire. In addition, there was collaboration from the internal sales team of the lubricating oils producer, which made telephone calls to customers, with the recommendation that customers respond to the survey.
3.2 Data treatments
The data were initially subjected to a descriptive examination to identify atypical observations (or extreme responses), and to evaluate whether these were due to data entry errors or omission of responses by the respondents, which could have an excessive influence on the multivariate analysis results.
The data were then further purified through the use of multivariate and exploratory factor analysis to define the underlying structure of the data matrix (Malhotra, 2012). To validate the results of the factorial analysis, the generated structure were submitted to: first, content validity evaluation, to ensure that the scale was in accordance with the conceptual definition. In this case, the validity of content was evaluated by factor loadings and average extracted variance (AVE), whose values of 0.7 and 0.5, respectively, are the minimum acceptable limits; second, validation of the internal consistency of the scale, or unidimensionality, to evaluate the degree of consistency among multiple measurements of a variable. To this end, Cronbach’sα coefficient was used, whose generally accepted lower limit is 0.70 (Hairet al., 2007). Another reliability index of internal consistency used was composite reliability (CR), which should be higher than 0.70; third, convergent validity, to assess the degree to which two measures of the
362
REGE
25,4
same concept are correlated. For this case, the AVE was used, which should be higher than 0.5 for each of the constructs (Hairet al., 2011). The AVE is the average percentage of variation explained between the assertions of each construct or factor (Hairet al., 2009). In this sense, it was sought to have a suitable structural model excluding the variables with factorial loads and commonality below 0.50 in its construct of origin; and fourth, discriminant validity, which was evaluated by developing a table comparing the percentages of mean variance extracted for the constructs of the theoretical-empirical model, with the square of the correlation estimate between these constructs. Estimates of extracted variance should be greater than the quadratic estimate of correlation (Fornell and Larcker, 1981; Chin, 1998).
Once the structure of the theoretical-empirical model was validated, the partial least squares path modeling (PLS-PM) methodology of structural equation modeling was applied, to evaluate the statistical significance of the interrelationships of variables. The PLS-PM was applied using SmartPLS Professional software (SmartPLS GmbH, Boenningstedt, Germany). The SmartPLS application was chosen for the following reasons: it is appropriate to estimate complex measurement models; it does not require normal distribution of data; the sample size may be smaller than other computational modeling tools in structural equations; and the application is freely available on the World Wide Web (Ringleet al., 2014).
In order to evaluate the adjustment of the theoretical model to the empirical data, Tenenhauset al.(2005) suggest using the goodness-of-fit (GoF) approach, given by:
ffiffiffiffiffiffiffiffiffiffiffiffiffiffiffiffiffiffiffiffiffiffiffiffiffi AV E R2 2 q # ; " (1) that is, given by the geometric mean between the AVEs (measurement model adequacy) and theR2s (structural model adequacy). However, for the GoF index, Henseler and Sarstedt (2012) have shown fragility in distinguishing between valid and invalid models. As a result, two other indicators of adjustment of the measurement model were used: the Stone–Geisser test for predictive relevance (Q2), and Cohen’s effect size (f2).
Finally, the approach of Iacobucciet al.(2007) was used to evaluate the mediating effect of LSQ in the relationship between LC and CS. As a counter-test, we used the SobelZtest, given by: ab ffiffiffiffiffiffiffiffiffiffiffiffiffiffiffiffiffiffiffiffiffiffiffiffiffiffi b2Sa2þa2Sb2 q 2 6 4 3 7 5; (2)
whereaandbare coefficients captured from the variables, andSaandSbare the standard errors related to the coefficientsaandb.
After obtaining the result of the SobelZtest, the mediation was categorically categorized: without mediation, partial mediation or total mediation (Iacobucciet al., 2007).
3.3 Delimitation of the study
There were two main delimitations of the study: first, the study’s scope was limited to Brazilian companies in the automotive lubricating oil industry, located in the country’s southern region. Because raw material suppliers are concentrated, lubricating oils producers have the challenge of overcoming the shortcomings of the southern Brazilian transportation sector. Firms operate at a stock level above 30 days in Brazil, due to logistical uncertainties, compared to just 10 days in the USA (Valor Econômico, 2013), in a market annually worth around R$20bn (Sindicato Nacional das Empresas Distribuidoras de Combustíveis e Lubrificantes, 2015). Second, delimitation is that the study has a transversal design, that is, with a single period of data collection.
363
Logistic
service quality
3.4 Limitations of the method
The limitations of the study method involved the fact that: the study was performed with customers of the lubricant oils market in the database of a single supplier of lubricating oils based in the southern region of Brazil; and in relation to time, the study was cross-sectional, since the data were collected between March 2 and April 7, 2015, when Brazil was experiencing moments of economic and political crisis (Monteiro, 2015), which may have influenced respondents’answers.
Thus, the results obtained should be viewed with caveats. 4. Analysis of data and results
4.1 Demographic profile of the sample
The sample, represented by 117 respondents, had the following demographic profile: (1) Concerning the interviewees, 41 percent were business owners or members and
35.9 percent were at the managerial level, so 76.9 percent of the respondents had a commanding position in the firm. A total of 75.2 percent of respondents had attended higher education institutions, 32.5 percent of them in business administration; 71.8 percent had been more than five years in the position. Thus, the respondents’positions allowed them to influence the purchasing process, and they had criteria to evaluate the logistics services provided and the company’s satisfaction with these services.
(2) In relation to the companies, 76.1 percent were located in southern Brazil; 77.8 percent were classified as micro and small companies, 45.3 percent of which were retail stores, auto parts dealers, mechanic workshops and vehicle dealerships. Fuel stations accounted for 36.8 percent. The results obtained are consistent with the profile of customers in the lubricating oil market.
4.2 Validation of measures and scales of the constructs
After the factor analysis of a total of 34 measures, 24 remained, or at least 5 measurements per construct, as recommended by Hairet al.(2009). The original (34) and final (24) measurements showed that measurement is a hindrance to knowledge building. Nevertheless, the credibility of the method employed constitutes a central point for the result obtained (Figueiredo Filho and Silva Junior, 2010).
Regarding the descriptive data, the average values of the three constructs—LSQ, LC and CS—ranged from 3.68 to 4.81, on a scale of 1–6 points, with a dispersion that oscillated between 1.05 and 1.34. The CS construct had the lowest coefficient of variation, at 0.22 [1.05/ 4.83], with a low dispersion, in relation to the average obtained. The measurements of the three constructs were superior to 3, which showed a tendency toward the scale’s agreement level, meaning that the respondents indicated that the LSQ and the LC influenced clients’ satisfaction. The descriptive data and factor loadings, by measure, are shown in Table AI.
Regarding the validation of the measures and scales, the factor loadings and AVE presented values higher than 0.7 and 0.6, respectively, indicating adequate convergence.
In terms of internal consistency reliability, the values obtained for the CR index were higher than 0.90. Likewise, Cronbach’s α coefficients were greater than 0.80 for all constructs. These values indicate the internal consistency of the model constructs, whose minimum acceptable values are 0.70 for exploratory studies (Hairet al., 2009). Table I shows that the square root values of the average variance extracted, shown in the diagonal position, were higher than the values of the correlation of one construct with the others, indicating the discriminant validity of the constructs.
The data obtained for the mean standard deviation, format, bi-varied correlation, quantity of original and final measurements, unidimensionality, CR, content validity, convergent and discriminant are shown in Table I.
364
REGE
25,4
4.3 Assessments of the structural relationships of the measurement model
The evaluation of the statistical significance of the structural relations between the constructs was performed by the SmartPLS-professional software, with the result shown in Figure 1.
For the structural model with mediation, (b) in Figure 1, the LC construct, was related to the LSQ, with a structural coefficient equal to 0.65 and statistically significant for (α⩽0.01).
Format Bivariate correlation
Construct Mean SD Sk Ku 1 2 3
1. Logistics service quality 4.63 0.86 −0.92 1.19 0.807
2. Logistics capabilitites 3.68 1.11 −0.10 −0.33 0.651 0.824
3. Customer satisfaction 4.81 0.87 −0.99 0.65 0.737 0.570 0.822
Quantity of original measures→ 14 10 10
Quantity of purified final measurements→ 7 5 7
Cronbach’sα→ 0.909 0.881 0.918
AVE (average variance extracted) 0.651 0.679 0.676
RC (reliability composite)→ 0.929 0.913 0.936
Notes:The diagonal values, in italics, are the square root of the average variance extracted (used to assess the discriminant validity)
Source:Research data
Table I. Mean, standard deviation (SD), format, correlation and validity indices of the measurements and scales GoF = 0.474 (a) R2 = 0.332 Logistics capabilities 0.58** (10.05) Customer satisfaction (b) GoF = 0.573 0.16 (1.73) 0.65** (12.04) 0.64** (7.47) R2 = 0.558 Logistics capabilities
Notes: (a) Without mediation; (b) with mediation. l estimated by SmartPLS software – significance: bootstrap with n= 117 and 5,000 replicates. Presentation of t-value between relatives (...). *<0.05 – Level of significance – t value>1.96; **<0.01 – Level of significance – t value>2.58
Source: Research data 0.857** 0.800** 0.781** 0.885** 0.791** LC3 LC2 LC1 LC5 LC4 R2 = 0.423 Logistics service quality 0.782* 0.794** 0.806** LSQ3 LSQ4 LSQ5 LSQ2 LSQ6 LSQ7 LSQ1 0.771* 0.858* 0.828* Customer satisfaction 0.789** 0.827** 0.736** 0.846** 0.869** CS1 CS2 CS3 CS4 CS5 CS6 CS7 0.801** 0.879** 0.804* Figure 1. Theoretical-empirical model: LSQ-LC-CS (structural coefficients and significance)
365
Logistic
service quality
Downloaded by 189.44.84.106 At 17:37 10 October 2018 (PT)However, the relationship between LC and CS had a low structural coefficient of 0.16, and was statistically insignificant for (α⩽0.05). In addition, it was identified that the LSQ had a positive relationship with CS, with a structural coefficient equal to 0.64 and statistically significant for (α⩽0.01).
This result showed that in order for LC to affect CS, the inclusion of LSQ was required. This result was corroborated by the structural model, without the mediation of the LSQ, shown in Figure 1(a), whose structural coefficient, equal to 0.58, is considered by Cohen (1977) as a strong and statistically significant correlation for (α⩽0.01); reduced to 0.16 and statistically insignificant for (α⩽0.05), whereas in the structural model, the LSQ was included as a mediating factor, as shown in Figure 1(b).
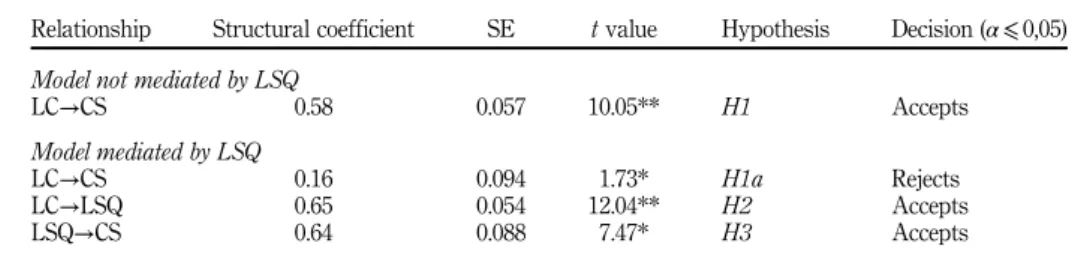
The hypotheses defined to test the LSQ as a mediating factor between LC and CS is shown in Table II.
Concerning the hypotheses of the structural model without the measurement of the LSQ, we find:
(1) ForH1, it was evidenced that LC have a direct impact on the CS with the company, with a structural coefficient equal to 0.58 andtvalue of 10.05, statistically significant for (α⩽0.01). These results converge with the studies of Morash et al. (1996), Daugherty et al. (1998), Esper et al. (2007) and Glicor and Holcomb (2012), who identified that companies that have developed specific LC have succeeded in influencing CS through these capabilities.
With respect to the hypotheses, in the structural model mediated by the LSQ:
(1) ForH2, it was evidenced that the LC have a positive relation with the LSQ, with a structural coefficient equal to 0.65 and t value of 12.04, that is, statistically significant for (α⩽0.01). Studies carried out by Richeyet al.(2007) obtained similar results, namely, that LC positively influenced the logistics services quality in the search to improve the logistics services provided.
(2) ForH3, it was evidenced that the LSQ has a positive relation with the company’s CS, whose structural coefficient was equal to 0.64 witht value of 7.47, statistically significant for (α⩽0.01): results that are convergent with the works of Mentzeret al. (2001), Panayides and So (2005), Jugaet al.(2010) and Saura and Molina (2011). (3) For H1a by including the construct LSQ in the measurement model of the
relationship between the LC and the client satisfaction constructs, the structural coefficient was reduced from 0.58 (significant forα⩽0.01) to 0.16 (not significant for α⩽0.05). Iacobucci et al. (2007) state that when the relationship between two constructs is reduced to a level of non-significance with the inclusion of a third construct, this third construct has a mediating effect in the model under study.
Relationship Structural coefficient SE tvalue Hypothesis Decision (α⩽0,05)
Model not mediated by LSQ
LC→CS 0.58 0.057 10.05** H1 Accepts
Model mediated by LSQ
LC→CS 0.16 0.094 1.73* H1a Rejects
LC→LSQ 0.65 0.054 12.04** H2 Accepts
LSQ→CS 0.64 0.088 7.47* H3 Accepts
Notes:*o0.05–level of significance–tvalueW1.96; **o0.01–level of significance–tvalueW2.58 Source:Research data
Table II. Significant relationships in the model
366
REGE
25,4
Downloaded by 189.44.84.106 At 17:37 10 October 2018 (PT)Hence, it is shown that the construct LSQ had a mediating effect in the relation between LC and CS. As a counter-test of the mediation, the SobelZtest was applied, whose parameters were:a¼0.65;b¼0.64;Sa¼0.054 andSb¼0.088. Equation (2) was used to obtain Sobel’sZ test¼0:650:64=p0ffiffiffiffiffiffiffiffiffiffiffiffiffiffiffiffiffiffiffiffiffiffiffiffiffiffiffiffiffiffiffiffiffiffiffiffiffiffiffiffiffiffiffiffiffiffiffiffiffi:6420:0542þ0:6520:0882¼6.22→pvalue¼0.0000, i.e. significant for (α⩽0.01).
Therefore, following the approach of Iacobucciet al.(2007), the SobelZtest showed at a statistically significant level (α⩽0.01) that the mediation of the logistics quality of service in the relationship between LC and CS was total.
After having performed the significance tests of the hypotheses defined for the empirical theoretical model, whose statistical significance is shown in Table II, the complementation of tests continued in order to estimate the LSQ as a mediating factor in the relationship between LC and CS.
In terms of global adjustment measures of the measurement model, Equation (1) was applied and the value GoF¼pffiffiffiffiffiffiffiffiffiffiffiffiffiffiffiffiffiffiffiffiffiffiffiffiffi0:6690:491¼0.573 was obtained. The obtained value, corresponding to 0.40, exceeded the base value of 0.36 (Fornell and Larcker, 1981), thus showing that the model performed well compared to the specified base value. Despite considerations about the fragility of this measure set forth by Henseler and Sarstedt (2012), we analyzed other measures of quality adjustment as suggested by Hairet al.(2014). By means of the Stone–Geisser indicators or the predictive or predictive validity (Q2), and Cohen’s or the effect size (f2), the results were obtained as shown in Table III.
Table III presents positive values for the (Q2) indicator, showing that the model reflects reality, without errors. Regarding the effect size indicator (f2), the constructs showed values greater than 0.35, demonstrating the model’s strong predictive power.
5. Discussion
The objective of this study was to estimate the influence of LC on the relationship between LSQ and CS in the Brazilian lubricant oils market, given that there have been few studies to examine these three constructs together.
The result showed that the LSQ is a mediator between LC and CS: therefore, LC do not directly influence CS. However, this result made it possible to analyze implications of a theoretical-empirical and managerial nature, as shown below:
(1) Regarding the theoretical-empirical perspectives, the final results demonstrated that the LSQ construct explained 55.8 percent of the variance of the indices of the CS construct; results aligned with the work done by Mentzer et al. (2001). The LC construct explained 42.3 percent of the indices of the LSQ construct, but did not present a significant direct influence on the CS construct. In this way, it was identified that the LC had their influence on the CS construct mediated by the LSQ construct. The results obtained were consistent with the resource-based view, according to which capabilities per se do not enable a firm to implement its strategies, but can become part of other resources to implement such strategies (Barney and Hesterly, 2013). These results answered the research problem, which was to identify the influence of the LC of lubricant oils companies on the relationship
Construct CV RED (Q2) CV COM (f2)
Logistics capabilities 0.51 0.51
Logistics service quality 0.268 0.529
Customer satisfaction 0.357 0.564
Source:Research data
Table III. Values of the predicative validity indicators (Q2) and of the effect size (f2)
367
Logistic
service quality
between the LSQ provided and the satisfaction of their customers. The work of Panayides and So (2005) and Sauraet al.(2008) identified that the LSQ influenced CS, in the same way as Lynchet al.(2000) identified that LC influenced the LSQ, and the work of Esperet al.(2007) identified the influence of these LC on CS. However, these authors have not studied these three constructs together, a research gap that is beginning to be filled with the present academic study involving customers of the lubricating oils market.
(2) Regarding managerial perspectives, the results obtained led to the following evidences: first, although the influence of the LSQ on CS has been identified, there are other criteria that influence CS in relation to logistics services because the LSQ only explained 55.8 percent of the variance of the CS construct indices. Likewise, there are other criteria that influence the LSQ provided, since logistical capabilities only explained 42.3 percent of the variance of the indices of the LSQ construct. Second, an analysis of the correlation coefficients of the constructs verified that the investment of one unit in the LSQ will cause an estimated increase of 0.64 units of CS. This investment will therefore lead to an estimated increase of 0.65 units of the LSQ perceived by the clients, as shown in Figure 1. It was demonstrated that in order to obtain increases in CS in relation to LSQ provided, the company must invest in its LC. Third, in the analyses of the correlation coefficients of the variables belonging to the three constructs studied, it was observed that two LC had positive effects in almost all dimensions of the logistics services quality. These capabilities referred to the company being proactive in the search for logistics solutions and integrating information with its customers. It is thus suggested that leaders of the companies supplying lubricating oils should seek to develop these two capabilities. The investments in these two capabilities, according to the obtained results, promote improvements in the logistics services quality provided, such as availability of information and quality in the service provided to customers. Fourth, regarding the influence of the LSQ dimension on CS, accurate delivery, meaning the supplier being precise with regard to the products requested by the customers, has shown influence on all attributes of CS. In the quest to achieve CS in relation to the logistics services provided, the leaders of lubricant suppliers must be careful about what has been agreed with their clients. Three other dimensions of LSQ that influenced almost all aspects of CS were: employees being friendly, reliable ordering information and agility in order confirmation. Also emphasized is the importance of suppliers providing reliable information and quality service to their clients, consistent with the studies of Lütkemeyer Filho et al. (2015), who established an interaction effect between employee courtesy and reliable information on CS.
6. Conclusion and suggestions for further studies
In the pursuit of CS, the managers of lubricant oil producers should make major investments in LC, to enable the company to be active in the search for logistics solutions, integration and provision of reliable information to its customers. The logistics services quality perceived by the customers is derived from the service capacity of the producer’s employees and the quality of information provided to the customers.
When customers are satisfied by the logistics services provided, they tend to continue doing business with the lubricating oil company, and recommend this producer to other companies. Obtaining CS can be a differentiation strategy (Barney and Hesterly, 2013), thus providing a competitive advantage for the company (Esperet al., 2007). Companies that presented a competitive advantage were identified with higher average growth and profitability than their competitors (Brito and Brito, 2012). The search for CS through the
368
REGE
25,4
improvement of LC and LSQ can be used by producers of lubricating oils in search of higher financial returns (Wrightet al., 2000).
Finally, it is suggested that new studies be conducted in order to increase the size of the sample, since the number of responses obtained (117 respondents), for the number of initial variables (34 measures), has not reached that recommended by the academic literature. Hair
et al.(2009) suggest that the number of responses should be five times greater than the
number of variables studied. The studies should also be carried out in other market segments, in order to compare the results obtained in the lubricating oil segment of Brazil and corroborate knowledge about the influence of logistical capabilities on the relation between LSQ and CS.
References
Barney, J. and Hesterly, W.S. (2013), Administração Estratégica e Vantagem Competitiva, 3ª ed., Pearson Prentice Hall, São Paulo.
Bienstock, C.C. and Royne, M.B. (2010), “Technology acceptance and satisfaction with logistics services”,The International Journal of Logistics Management, Vol. 21 No. 2, pp. 271-292. Bowersox, D.J., Closs, D.J., Cooper, M.B. and Bowersox, J.C. (2014), Gestão Logística da Cadeia de
Suprimentos, 4a ed., AMGH, Porto Alegre.
Brito, R. P. de and Brito, L.A.L. (2012),“Vantagem Competitiva, Criação de Valor e seus Efeitos sobre o Desempenho”,RAE, Vol. 52 No. 1, pp. 70-84.
Byrne, P.M. and Markham, W.J. (1993),“Global logistics: only 10% of companies satisfy customers”,
Transportation and Distribution, Vol. 34 No. 12, pp. 41-45.
Chase, R.B., Jacobs, F.R. and Aquilano, N.J. (2006),Administrac¸a˜o da Produc¸a˜o para a Vantagem Competitiva, Bookman, Porto Alegre.
Chin, W.W. (1998), “The partial least squares approach for structural equation modeling”, in Marcoulides, G.A. (Ed.),Modern Methods for Business Research, Lawrence Erlbaum Associates, London, pp. 236-295.
Christopher, M. (1999),A Logistica Do Marketing, Futura, São Paulo.
Cohen, J. (1977), Statistical Power Analysis for the Behavioral Sciences, Rev. ed., Academic Press, New York, NY.
Daugherty, P.J., Stank, T.P. and Ellinger, A.E. (1998),“Leveraging logistics/distribution capabilities: the effect of logistics service on market share”,Journal of Business Logistics, Vol. 19 No. 2, pp. 35-51. Esper, T.L., Fugate, B.S. and Sramek, B.D. (2007), “Logistics learning capability: sustaining the competitive advantage gained through logistics leverage”,Journal of Business Logistics, Vol. 28 No. 2, pp. 57-81.
Fawcett, S.E., Stanley, L.L. and Smith, S.R. (1997),“Developing a logistics capability to improve the performance of international operations”,Journal of Business Logistics, Vol. 18 No. 2, pp. 101-127. Figueiredo Filho, D.B. and Silva Junior, J.A. (2010),“Visão além do alcance: uma introdução à análise
factorial”,Campinas: Opinião Pública, Vol. 16 No. 1, pp. 160-185.
Fornell, C. and Larcker, D.F. (1981), “Evaluating structural equation models with unobservable variables and measurement error”,Journal of Marketing Research, Vol. 18 No. 1, pp. 39-50. Fornell, C., Johnson, M.D., Anderson, E.W., Cha, J. and Bryant, B.E. (1996),“The American customer
satisfaction index: nature, purpose, and findings”,Journal of Marketing, Vol. 60 No. 4, pp. 7-18. Glicor, D.M. and Holcomb, M.C. (2012),“Understanding the role of logistics capabilities in achieving supply chain agility: a systematic literature review”, Supply Chain Management: An International Journal, Vol. 17 No. 4, pp. 438-453.
Glicor, D.M. and Holcomb, M.C. (2014), “Antecedents and consequences of integrating logistics capabilities across the supply chain”,Transportation Journal, Vol. 53 No. 2, pp. 211-224.
369
Logistic
service quality
Gotzamani, K., Longinidis, P. and Vouzas, F. (2010), “The logistics services outsourcing dilemma: quality management and financial performance perspectives”,Supply Chain Management: An International Journal, Vol. 15 No. 6, pp. 438-453.
Grant, R.M. (1991),“The resource-based theory of competitive advantage: implications for strategy for strategy formulation”,California Management Review, Vol. 33 No. 3, pp. 114-135.
Hair, J.F. Jr, Anderson, R.E., Tatham, R.L. and Black, W.C. (2009),Ana´lise multivariada de dados, 6ªed., Bookman, Porto Alegre.
Hair, J.F. Jr, Babin, B., Money, A.H. and Samouel, P. (2007),Fundamentos de métodos de pesquisa em Administração, Bookman, Porto Alegre.
Hair, J.F., Hult, G.T.M., Ringle, C.M. and Sarstedt, M. (2014), A Primer on Partial Least Squares Structural Equation Modeling (PLS-SEM), Sage, Thousand Oaks, CA.
Hair, J.F., Ringle, C.M. and Sarstedt, M. (2011), “PLS-SEM: indeed a silver bullet”,The Journal of Marketing Theory and Practice, Vol. 19 No. 2, pp. 139-152.
Helfat, C.E., Finkelstein, S., Mitchell, W., Peteraf, M., Singh, H., Teece, D. and Winter, S.G. (2007),Dynamic Capabilities: Understanding Strategic Changes in Organizations, Blackwell Publishing, Malden. Henseler, J. and Sarstedt, M. (2012),“Goodness-of-fit indices for partial least squares path modeling”,
Computational Statistics, Vol. 28 No. 2, pp. 565-580.
Iacobucci, D., Saldanha, N. and Deng, X. (2007),“A meditation on mediation: evidence that structural equations models perform better than regressions”,Journal of Consumer Psychology, Vol. 17 No. 2, pp. 140-154.
Juga, J., Juntunen, J. and Grant, D.B. (2010),“Service quality and its relation to satisfaction and loyalt in logistics outsourcing relationships”,Managing Service Quality, Vol. 20 No. 6, pp. 496-510. Kottler, P. (2000),Administração de Marketing, 10a edição, Prentice Hall, São Paulo.
Lin, Y., Luo, J., Cai, S., Ma, S. and Rong, L. (2016),“Exploring the service quality in the e-commerce context: a triadic view”,Industrial Management & Data System, Vol. 116 No. 3, pp. 388-415. Liu, L. and Luo, D. (2012),“Effects of logistics capabilities on performance in manufacturing firms”,
Contemporary Logistics, Vol. 9 No. 1, pp. 8-14.
Liu, X., Grant, D.B., Alan, C.M. and Feng, Y. (2010),“An empirical examination of the contribution of capabilities to the competitiveness of logistics service providers: a perspective from China”,
International Journal of Physical Distribution & Logistics Management, Vol. 40 No. 10, pp. 847-866. Lütkemeyer Filho, M.G., RoeheVacarro, G.L. and Freitas de, E.C. (2015),“Identificação dos Fatores de Satisfação de Clientes em Serviços: um estudo em concessionárias de agronegócio”,Revista Brasileira de Gestão de Negócios, Vol. 17 No. 58, pp. 1408-1425.
Lynch, D.F., Keller, S.B. and Ozment, J. (2000),“The effects of logistics capabilities and strategy on firm performance”,Journal of Business Logistics, Vol. 21 No. 2, pp. 47-67.
Malgorzata, L.K. and Gajewska, T. (2014), “Customer satisfaction with the quality of the logistic services”,Scientific Journal of Logistics–Log Forum, Vol. 10 No. 1, pp. 13-19.
Malhotra, N.K. (2012),Pesquisa de Marketing: uma orientação aplicada, Bookman, Porto Alegre. Meiduté-Kavaliausjeiné, I., Aranskis, A. and Litvinenko, M. (2014),“Consumer satisfaction with the
quality of logistics services”,Procedia–Social and Behavioral Sciences, Vol. 110, pp. 330-340. Mentzer, J.T., Flint, D.J. and Hult, G.T.M. (2001),“Logistics service quality as a segment-customized
process”,Journal of Marketing, Vol. 65 No. 4, pp. 82-104.
Mentzer, J.T., Flint, D.J. and Kent, J.L. (1999),“Developing a logistics service quality scale”,Journal of Business Logistics, Vol. 20 No. 1, pp. 9-32.
Monteiro, T. (2015), “2015 será ano de vacas magras”, afirma Dilma. Exame Online, April 8, available at: http://exame.abril.com.br/brasil/noticias/2015-sera-ano-de-vacas-magras-afirma-dilma/ (accessed April 8, 2015).
Morash, E.A. (2001),“Supply chain strategies, capabilities, and performance”,Transportation Journal, Vol. 41 No. 1, pp. 37-54.
370
REGE
25,4
Morash, E.A., Dröge, C.L.M. and Vickery, S.K. (1996),“Strategic logistics capabilities for competitive advantage and firm success”,Journal of Business Logistics, Vol. 17 No. 1, pp. 1-22.
Novaes, A.G. (2007),Logística e gerenciamento da cadeia de distribuição, 3ªed., Elsevier, Rio de Janeiro. Panayides, P.M. and So, M. (2005),“The impact of integrated logistics relationships on third-party logistics service quality and performance”,Maritime Economics & Logistics, Vol. 7 No. 1, pp. 35-55. Rao, S., Goldsby, T.J., Griffis, S.E. and Iyengar, D. (2011),“Electronic logistics service quality (e-LSQ): its impact on the customer’s purchase satisfaction and retention”,Journal of Business Logistics, Vol. 32 No. 2, pp. 167-179.
Richey, R.G., Daugherty, P.J. and Roath, A.S. (2007), “Firm technological readiness and complementarity: capabilities impacting logistics service competency and performance”,
Journal of Business Logistics, Vol. 28 No. 1, pp. 195-229.
Richey, R.G., Genchev, S.E. and Daugherty, P.J. (2005), “The role of resource commitment and innovation in reverse logistics performance”,International Journal of Physical Distribution & Logistics Management, Vol. 35 No. 4, pp. 233-257.
Ringle, C.M., Silva, D. and Bido, D.S. (2014),“Modelagem em equações estruturais com utilização do smartpls”,REMark: Revista Brasileira de Marketing, Vol. 13 No. 2, pp. 56-73.
Saura, I.G. and Molina, M.E.R. (2011),“Logistics service quality and buyer–customer relationships: the moderating role of technology in B2B and B2C contexts”,The Service Industries Journal, Vol. 31 No. 7, pp. 1109-1123.
Saura, I.G., Francés, D.S., Contri, G.B. and Blasco, M.F. (2008),“Logistics service quality: a new way to loyalty”,Industrial Management & Data System, Vol. 108 No. 5, pp. 650-668.
Sharma, A., Grewal, D. and Levy, M. (1995),“The customer satisfaction/logistics interface”,Journal of Business Logistics, Vol. 16 No. 2, pp. 1-21.
Sindicato Nacional das Empresas Distribuidoras de Combustíveis e Lubrificantes (2015),“Anuário sindicom”, available at: www.sindicom.com.br/download/anuario_sindicom_2015_web.pdf (accessed April 19, 2015).
Stopka, O., Cerná, L. and Zitricky, V. (2016),“Methodology for measuring the customer satisfaction with the logistics services”,Nase More, Vol. 63 No. 3, pp. 189-194.
Tenenhaus, M., Esposito Vinze, V., Chatelin, Y. and Lauro, C. (2005), “PLS path modeling”,
Computational Statistics and Data Analysis, Vol. 48 No. 1, pp. 159-205.
Tontini, G. and Zanchett, R. (2010),“Atributos de satisfação e lealdade em serviços logísticos”,Gestão & Produção, Vol. 17 No. 4, pp. 801-816.
Valor Econômico (2013),“Ineficiência na entrega aumenta os níveis de estoque”, available at: www. valor.com.br/empresas/3216478/ineficiencia-na-entrega-aumenta-os-niveis-de-estoque (accessed April 19, 2015).
Wright, P., Kroll, M.J. and Parnell, J. (2000),Administração Estratégica: Conceitos, Atlas, São Paulo. Yang, S., Liu, J., Wang, K. and Miao, Y.Z.I. (2016),“An uncertain QFD approach for the strategic
management of logistics services”,Mathematical Problems in Engineering, Vol. 1 No. 1, pp. 1-10. Yang, Y.H., Huy, Y.V., Leung, L.C. and Chen, G. (2010),“An analytic network process approach to the selection of logistics service providers for air cargo”,The Journal of the Operational Research Society, Vol. 61 No. 9, pp. 1365-1376.
Zhang, Q., Vonderembse, M.A. and LIM, J.S. (2005),“Logistics flexibility and its impact on customer satisfaction”,The International Journal of Logistics Management, Vol. 16 No. 1, pp. 71-95.
371
Logistic
service quality
Appendix. Measurements and scales
Corresponding author
Daniel Winter Fernandes can be contacted at: daniel_winter_fernandes@hotmail.com
Construct/assertives Mean SD Sk Ku FL
Logistics service quality
LSQ1 The communication of the supplier company is efficient regarding delays of delivery
4.23 1.21 −0.40 −0.29 0.804 LSQ2 The deadline proposed at the moment of the request for delivery
of the goods was respected
4.30 1.18 −0.60 0.16 0.828 LSQ3 The company supplying lubricating oils is quick in confirming
the order
4.74 0.98 −0.73 0.23 0.806 LSQ4 The employees of the supplying company are able to assist when
problems arise with the orders placed
4.74 1.06 −0.90 0.79 0.794 LSQ5 The employees of the supplier company are cordial in attendance 4.97 1.00 −0.99 1.32 0.782 LSQ6 The information provided by the supplier on the orders is reliable 4.63 1.06 −0.83 0.75 0.858 LSQ7 The delivery of the supplier company is accurate with regard to
the products that were requested
4.77 0.92 −0.66 0.61 0.771 Logistics
capabilities
LC1 The supplier company is proactive in finding solutions to logistical problems before they occur
4.17 1.21 −0.49 −0.07 0.781 LC2 After the delivery of the order, the supplier follows up to check
the quality of the logistics service
3.11 1.51 0.27 −0.87 0.791 LC3 The speed of delivery of the goods, once the order has been
placed, is faster than that of other suppliers
3.91 1.22 −0.35 −0.16 0.800 LC4 The supplier company seeks to integrate information in the quest
to improve the quality of the logistics service provided
3.53 1.45 0.01 −0.80 0.885 LC5 The supplier company has the capacity to develop creative
logistics solutions for emergency situations, such as providing a prompt delivery to meet an unforeseen lack of merchandise for the customer
3.67 1.33 −0.24 −0.53 0.857
Customer satisfaction
CS1 The company supplying lubricating oils has reached the expectation of our company; therefore, we will recommend this supplier to other companies
4.71 1.08 −0.80 0.49 0.789
CS2 Our company considers itself satisfied when the supplier of lubricating oils delivers the quantity of merchandise agreed upon in the order
5.01 0.98 −1.03 0.91 0.846
CS3 The expectations of our company are met when the company that supplies lubricating oils responds to our complaints about the logistics services provided
4.91 1.17 −1.07 0.83 0.736
CS4 Our company considers itself satisfied when the supplier company delivers the request within the agreed period
4.98 0.95 −0.83 0.74 0.827 CS5 The quality of the logistics services of this company supplying
lubricating oils affects the level of satisfaction of our company, so we will do business with this supplier company in the coming years
4.69 1.07 −0.56 −0.12 0.869
CS6 The satisfaction of our company is influenced when we realize that the company supplying lubricating oils efficiently meets our product needs
4.81 0.97 −0.81 0.47 0.801
CS7 Our company believes that buying from this supplier company of lubricating oils has been a good experience
4.55 1.16 −0.85 0.77 0.879
Notes:The assertions were measured by the discordance/concordance scale, with 6 degrees of importance ranging from totally disagree (TD¼1) to totally agree (TA¼6)
Source:Research data Table AI.
Mean (M), standard deviation (SD), skewedness (Sk), kurtosis (Ku) and factor loading (FL) of the assertions in their respective constructs
For instructions on how to order reprints of this article, please visit our website:
www.emeraldgrouppublishing.com/licensing/reprints.htm
Or contact us for further details:permissions@emeraldinsight.com