J. Lepicovsky
NYMA Inc., Brook Park, Ohio
T.J. Bencic and R.J. Bruckner
Lewis Research Center, Cleveland, Ohio
Application of Pressure Sensitive Paint to
Confined Flow at Mach Number 2.5
NASA/TM—1998-107527
AIAA–97–3214
The NASA STI Program Office . . . in Profile
Since its founding, NASA has been dedicated to the advancement of aeronautics and space science. The NASA Scientific and Technical Information (STI) Program Office plays a key part in helping NASA maintain this important role. The NASA STI Program Office is operated by Langley Research Center, the Lead Center for NASA’s scientific and technical information. The NASA STI Program Office provides access to the NASA STI Database, the largest collection of aeronautical and space science STI in the world. The Program Office is also NASA’s institutional mechanism for disseminating the results of its research and development activities. These results are published by NASA in the NASA STI Report Series, which includes the following report types: • TECHNICAL PUBLICATION. Reports of
completed research or a major significant phase of research that present the results of NASA programs and include extensive data or theoretical analysis. Includes compilations of significant scientific and technical data and information deemed to be of continuing reference value. NASA’s counterpart of peer-reviewed formal professional papers but has less stringent limitations on manuscript length and extent of graphic presentations. • TECHNICAL MEMORANDUM. Scientific
and technical findings that are preliminary or of specialized interest, e.g., quick release reports, working papers, and bibliographies that contain minimal annotation. Does not contain extensive analysis.
• CONTRACTOR REPORT. Scientific and technical findings by NASA-sponsored contractors and grantees.
• CONFERENCE PUBLICATION. Collected papers from scientific and technical conferences, symposia, seminars, or other meetings sponsored or cosponsored by NASA.
• SPECIAL PUBLICATION. Scientific, technical, or historical information from NASA programs, projects, and missions, often concerned with subjects having substantial public interest.
• TECHNICAL TRANSLATION. English-language translations of foreign scientific and technical material pertinent to NASA’s mission.
Specialized services that complement the STI Program Office’s diverse offerings include creating custom thesauri, building customized data bases, organizing and publishing research results . . . even providing videos.
For more information about the NASA STI Program Office, see the following:
• Access the NASA STI Program Home Page at http://www.sti.nasa.gov
• E-mail your question via the Internet to help@sti.nasa.gov
• Fax your question to the NASA Access Help Desk at (301) 621-0134
• Telephone the NASA Access Help Desk at (301) 621-0390
• Write to:
NASA Access Help Desk
NASA Center for AeroSpace Information 7121 Standard Drive
J. Lepicovsky
NYMA Inc., Brook Park, Ohio
T.J. Bencic and R.J. Bruckner
Lewis Research Center, Cleveland, Ohio
Application of Pressure Sensitive Paint to
Confined Flow at Mach Number 2.5
NASA/TM—1998-107527
National Aeronautics and
Space Administration
Lewis Research Center
Prepared for the
33rd Joint Propulsion Conference and Exhibit
cosponsored by AIAA, ASME, SAE, and ASEE
Seattle, Washington, July 6–9, 1997
Acknowledgments
This work was supported by the NASA Lewis Research Center under contract NAS3-27186. The authors are grateful for the continuous support of Dr. Lawrence J. Bober of the NASA Lewis Compressor Branch.
Available from NASA Center for Aerospace Information
7121 Standard Drive Hanover, MD 21076 Price Code: A03
National Technical Information Service 5287 Port Royal Road Springfield, VA 22100 Price Code: A03
Summary
Pressure sensitive paint (PSP) is a novel technology that is being used frequently in external aerodynamics. For internal flows in narrow channels, and applications at elevated nonuni-form temperatures, however, there are still unresolved prob-lems that complicate the procedures for calibrating PSP signals. To address some of these problems, investigations were carried out in a narrow channel with supersonic flows of Mach 2.5. The first set of tests focused on the distribution of the wall pressure in the diverging section of the test channel downstream of the nozzle throat. The second set dealt with the distribution of wall static pressure due to the shock/wall interaction caused by a 25° wedge in the constant Mach number part of the test section. In addition, the total temperature of the flow was varied to assess the effects of temperature on the PSP signal. Finally, contami-nation of the pressure field data, caused by internal reflection of the PSP signal in a narrow channel, was demonstrated. The local wall pressures were measured with static taps, and the wall pressure distributions were acquired by using PSP. The PSP results gave excellent qualitative impressions of the pres-sure field investigated. However, the quantitative results, spe-cifically the accuracy of the PSP data in narrow channels, show that improvements need to be made in the calibration proce-dures, particularly for heated flows. In the cases investigated, the experimental error had a standard deviation of ±8.0% for the unheated flow, and ±16.0% for the heated flow, at an average pressure of 11 kPa.
Symbols
HT nozzle throat height, mm Ma Mach number
p static pressure, kPa
pE channel exit pressure, kPa
PPT plenum total pressure, kPa
Application of Pressure Sensitive Paint to Confined Flow at Mach Number 2.5
J. Lepicovsky NYMA, Inc Brook Park, Ohio 44142 T.J. Bencic and R.J. Bruckner
National Aeronautics and Space Administration Lewis Research Center
Cleveland, Ohio 44135
TPT plenum total temperature, K
v velocity, m/s
x axial distance measured from nozzle throat, mm
y vertical distance (height) measured from channel centerline, mm
Purpose of the Study
The purpose of the experimental effort reported here was twofold. The first goal was to gain experience with pressure sensitive paint (PSP) in a narrow channel with supersonic flow of Mach 2.5. The second goal was to verify the distribution of the wall static pressure in the test section of a small supersonic channel dedicated to evaluating optical measurement tech-niques that rely on particle tracers (refs. 1 and 2). More specifically, the study aimed at determining the wall pressure distributions in the diverging portion of the nozzle and in the region where an oblique shock, generated by a wedge inserted in the flow, interacted with the channel sidewall.
Technical Approach
The novel PSP technology is becoming well established in external aerodynamics and in wind tunnel measurements (ref. 3). For internal flows and applications with elevated and nonuniform temperatures, however, there are still unresolved problems. The most significant of these internal flow problems are (1) securing suitable optical access; (2) assessing the accuracy of calibration procedures; (3) deriving corrections to the PSP calibration for temperature variations; and (4) deter-mining the effect of internal reflections on the PSP signal in a confined space. Securing optical access is a mechanical design problem that must be solved on an individual basis. To inves-tigate the other problems, experiments were carried out in a narrow supersonic channel. During the tests, local wall pres-sures were measured using static taps, and wall pressure
2 NASA/TM—1998-107527 distributions were determined using PSP. In addition, the total
temperature of the flow was varied to assess the effects of temperature on the PSP signal.
The investigations were carried out in the test channel at two locations with strong static pressure gradients. The first set of measurements was taken in the diverging section of the channel inlet nozzle, where there is inherently a high pressure gradient that accelerates the flow. The second set was taken in the constant Mach number section of the channel. Here, a wall static pressure variation was obtained from the interaction of an oblique shock wave with the channel wall. The oblique shock was generated by a wedge inserted in the flow, and the shock wave position was determined by shadowgraph flow visualization.
Test Apparatus
The supersonic channel with a test section free stream Mach number of 2.5 was designed as a research tool in which flow seeding methods could be developed for measuring flow veloc-ity by optical techniques (ref. 1). A diagram of the test facilveloc-ity is shown in figure 1. The flow apparatus consists of a cylindrical
plenum with an internal volume of 1 m3; the plenum has an exit bellmouth and an attached convergent-divergent nozzle, followed by an 813-mm-long straight duct (test section) that maintains supersonic flow along its entire length. The nozzle was designed for an exit Mach number of 2.5. The throat area is 25 mm wide by 36 mm high (HT), for a plenum-throat contraction ratio of 650. Figure 2 shows the flow channel with the front sidewall removed. To measure static pressure along the contour midline, the upper contour of the nozzle and the test section are instrumented with 16 taps, which are 0.5 mm in diameter. Three additional static taps are located along the centerline on the channel sidewall, either in the front or rear part of the channel, depending on the assembly. A three-dimensional view of the test section is shown in figure 3, along with the 25° wedge that generated an oblique shock wave when it was inserted in the test section. The wedge is 17.8 mm wide, so it did not extend to the sidewalls; there was a 3.6-mm gap on each side between the wedge and the wall. Both sidewalls have access windows of 19-mm-thick optical glass and can be turned around to give optical access either to the front or rear half of
Figure 1.—Supersonic test channel.
Plenum Test section Wedge Nozzle throat
Figure 3.—Three-dimensional view of the test section.
Main frame
Nozzel inserts
Wedge Wall with
access window
Figure 4.—Oblique shock wave generator.
C-96-0535
x/HT [1]
0 5 10 15 20
C-96-0532
Figure 2.—Test section with front sidewall removed (HT = 36 mm).
the test section. Figure 4 is a closeup of the test section with the 25° wedge in place.
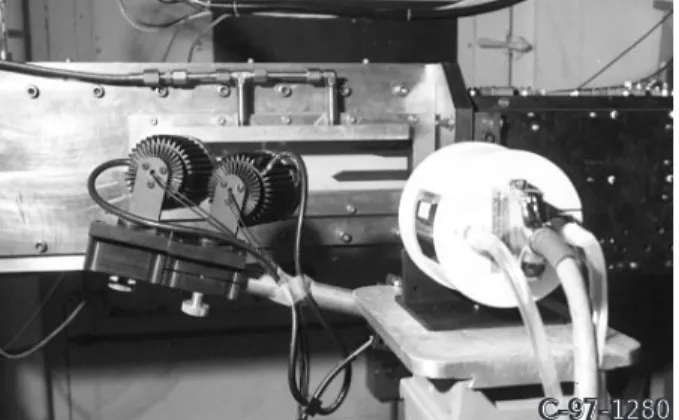
The PSP used in this experiment was developed at McDonnell Douglas Aerospace (ref. 4). It is based on oxygen-quenched photoluminescence, with excitation and signal wavelengths in the visible range (blue and yellow). Figure 5 shows two blue-light excitation lamps and a CCD camera in front of the test section. The signal from the PSP was recorded by this camera, and the data were reduced with commercial and inhouse-developed software (refs. 5 and 6). The PSP signal was cali-brated in situ; conversion factors were adjusted for each data set with respect to the static pressure tap data recorded on the sidewall in the view field of the CCD camera.
The flow visualization apparatus used was a single-pass shadowgraph optical setup that is described in detail in refer-ence 7. An exposure time of 0.5 s was selected for the shadowgraph picture.
Experimental Results
The investigation was carried out in two parts. The first part focused on the wall pressure distribution in the inlet section of the test channel (the diverging channel downstream of the nozzle throat). The second part dealt with the wall static pressure distribution due to the shock/wall interaction caused by a 25° wedge in the constant Mach number part of the test section. The channel was operated at seven test conditions, six with unheated flow and one with elevated temperature flow. The test conditions are summarized in Table I. Static pressure distributions along the midline of the upper contour were recorded for each test point. The resulting average static pres-sure distribution (for all test conditions) normalized by the corresponding plenum total pressure is shown in figure 6. The corresponding Mach number distribution is given in figure 7. These figures show that the test section maintains a constant Mach 2.44 flow along its entire working part (downstream of
x/HT = 6). The standard deviation from an average value for the
Figure 5.—PSP apparatus setup.
C-97-1280C-97-1280
TABLE I.—TEST CONDITIONS Test label Plenum
total pressure, PPT, kPa Channel exit pressure, PE, kPa Plenum total temperature, TPT, kPa C-140 C- 170 C- 205 C- 240 C- 255 C- 270 H- 170 143.55 173.96 203.97 237.03 255.13 270.16 169.69 14.34 13.87 16.11 17.16 24.39 19.37 12.66 292.4 291.6 291.8 292.2 292.5 292.8 424.8
Figure 6.—Pressure ratio distribution in the test section.
0.20 0.15 0.10 Static pr essur e, p/P PT [1] 0.05 0.00 20 15 10 Axial position, x/HT [1] 5 0
Sidewall centerline taps Contour midline taps
Figure 7.—Mach number distribution in the test section.
3.0 2.5 2.0 Mach number , Ma [1] 1.5 20 15 10 Axial position, x/HT [1] 5 0
Sidewall centerline taps Contour midline taps
static pressure ratio is ±1.0%, and for the Mach number is
±1.1%. Velocity distributions for the unheated and heated flows are given in figure 8. The standard deviation for the flow velocity is ±0.5%.
4 NASA/TM—1998-107527
Nozzle Throat Area
The first set of PSP data was taken in the diverging inlet section of the channel. Figures 9 and 10 show wall pressure maps for the test conditions corresponding to labels C-140 (fig. 9), the lowest plenum pressure run, and C-255 (fig. 10), the highest plenum pressure run. Both pressure maps are non-dimensionalized by the plenum total pressure. At first glance, the maps resemble each other, but a closer examination reveals some minor differences. Generally, the maps indicate a rapid pressure drop from the nozzle throat with convex-shaped isobars. Immediately beyond the nozzle throat, the pressure falls faster along the upper and lower contour than along the nozzle centerline. As the flow moves into the area of the largest divergence, the flow along the centerline starts to accelerate faster than the flow along the upper and lower curved walls, and the pressure distribution across the channel height equal-izes. At that location and some distance beyond, however, the flow at the centerline is still accelerating faster than that along the curved walls, and the pressure in the center of the channel drops below the level of the pressure at the contours. Finally, as the flow approaches the constant width portion of the channel, the flow stops accelerating, reaches a constant veloc-ity, and the wall pressure becomes constant across the channel height.
The preceding observations are summarized in figure 11, which shows five vertical distributions of the wall static pressure retrieved from the PSP data at various axial stations. The evolution of the flowfield is clearly discernible, starting from the static pressure convex profile shortly beyond the nozzle throat (x/HT = 0.7), moving through a somewhat
equal-ized profile (x/HT = 1.3), then going on through concave
profiles (x/HT = 1.9 and x/HT = 2.5), and finally reaching the
constant pressure distribution at x/HT = 4.3.
The differences in pressure along the channel height gener-ate strong secondary flows in this portion of the channel. A streamline pattern of the wall boundary layer flow was obtained by a method analogous to oil-smear pictures (see fig. 12); these photographs reveal the extent of the secondary flow. From the captured pattern, the maximum angle of the boundary layer streamline was estimated to be 6.0° with respect to the main flow direction at x/HT = 4.0. This means that the velocity
component perpendicular to the mean flow at this station reaches 55 m·s –1 (the axial velocity at that location is about 550 m·s –1), which is slightly above a local Mach number of 0.2. The PSP data for test condition C-255 show a static pressure distribution in the front part of the nozzle along the centerline of the sidewall; this is depicted as a solid line in figure 13, which also shows the static pressure data for the sidewall taps (circles) and the midline upper contour taps (inverted tri-angles). The double line represents the PSP data for the cornerline between the sidewall and the upper contour. Clearly, the continuous PSP signal supplies more information about the pressure field than can the sparsely spaced static taps. For example, a local pressure maximum at x/HT = 1.5 could not be
detected from the tap data. The local maximum in the centerline PSP pressure data shows that the expansion process in the diverging part of the nozzle is not smooth and perhaps indi-cates the existence of a shock structure in this part of the channel. The cornerline pressure distribution (double line) and its relation to the centerline distribution are in agreement with the observed boundary layer flow (fig. 12). The flow in the boundary layer moves away from the centerline up to x/HT= 1.4 because the pressure at the centerline is higher than in the corner; then the flow starts back toward the centerline once the pressure in the corner exceeds the pressure at the centerline.
Both the cornerline and centerline pressures are noticeably lower than the midline pressure on the contour surface. This large pressure difference is also confirmed by the static tap data at x/HT = 2.4. It appears, then, that there must be a large
pressure gradient along the width of the narrow contour side (normal to the nozzle plane) that drives a strong corner vortex in this part of the channel.
In order to judge the reliability and repeatability of the PSP data, the centerline pressure distributions for several test conditions were plotted on the same graph (see fig. 14). The data from midline contour taps and sidewall centerline taps, expressed as ratios of local-to-plenum total pressure, are identical for four of the test conditions investigated (C-140, C-170, C-205, and C-255); they collapse onto a single curve for stations downstream of x/HT = 2. For axial stations below x/HT = 2, however, the PSP data visibly deviate from each
other, with increasing differences toward the nozzle throat. At present, this discrepancy in the PSP data is being treated as an increased error band; therefore the accuracy of the static pressure PSP data was estimated in this particular case to have a standard deviation of ±3.0% for x/HT > 2 and ±11.0% for
x/HT < 2.
Figure 8.—Flow velocity distributions in the test section.
700 600 Flow velocity , v [m.s –1 ] 500 400 20 15 10 Axial position, x/HT [1] 5 0
Sidewall centerline taps Contour midline taps Sidewall centerline taps Contour midline taps Heated flow
Figure 9.—Sidewall static pressure map (test condition C-140). Flow direction 0.20 0.19 0.18 0.17 0.16 0.15 0.14 0.13 0.12 0.11 0.10 0.09 0.08 0.07 0.06 Pressure field scale, p/PPT
Figure 10.—Sidewall static pressure map (test condition C-255).
Flow direction 0.20 0.19 0.18 0.17 0.16 0.15 0.14 0.13 0.12 0.11 0.10 0.09 0.08 0.07 0.06 Pressure field scale, p/PPT
Figure 11.—Evolution of the static pressure profiles (test condition C-140). 0.17 0.13 Pr essur e, p/P PT [1] 0.09 0.05 1.0 0.5 0.0
Channel height, y/HT [1] –0.5 –1.0 x/HT 0.7 1.3 1.9 2.5 4.3
Figure 12.—Sidewall boundary layer flow pattern.
C-97-1288 C-95-4620
6 NASA/TM—1998-107527 The reason for the discrepancy is not obvious. The Reynolds
number nearly doubles between the test conditions of C-140 and C-255, and it is reasonable to expect that the effects of differences in the boundary layer development (displacement thickness) can change the effective nozzle throat and influence the flowfield and wall static pressures. A similar effect should also be felt by the contour taps, but apparently is not. Therefore, the likely reason for the PSP discrepancy for x/HT < 2 is
imprecision in the calibration constants of the individual PSP data sets. As mentioned earlier, the PSP was calibrated in situ for each test condition. Only data from the static taps on the sidewall centerline could be used for calibration because large
differences were detected between the sidewall and contour pressures in this portion of the channel. Ideally, the calibration pressure spread should encompass the range of expected meas-ured values. Unfortunately, the sidewall taps were in the region of very small pressure variations; thus large errors in the calibration constants could have been introduced. Such errors are evidenced in the converted data by large deviations that are proportional to the pressure levels. The data in figure 13 seem to follow such a trend. At present, however, no decisive conclusion can be reached about the reason for the scatter in the PSP data for stations below x/HT = 2. Additional work is needed
to resolve this question.
Shock/Wall Interaction Region
The second set of PSP data was acquired in the test section of the supersonic channel. A 25° wedge was inserted in the Mach-2.5 flow to generate an oblique shock wave. The shock impinged on the channel sidewalls and generated a pattern of elevated static pressure in the region of the shock-wave/boundary-layer interaction. The static pressure levels in this region were recorded by using the PSP technique.
A shadowgraph image of the oblique shock wave generated at test condition C-140 by the wedge in the flow is shown in figure 15 (ref. 7). Figure 16 shows the sidewall pressure pattern for the same test condition, with the image of the shock superimposed (during postprocessing) on the pressure data. At the wedge tip in the composite picture, the static pressure pattern is lagging behind the shock. This happens because the wedge does not extend to the sidewalls (there is a 3.6-mm gap between the wedge and the wall); therefore the shock’s pres-ence in the flow is felt on the sidewall some distance down-stream of the tip. Further from the wedge tip, the shock exhibits slight curvature because the shock is controlled not only by the wedge angle but also by additional influences, namely the expansion fan emanating from the turning corner of the wedge and the wall constraints. Static pressure maps for two more test conditions, C-170 and C-270, with the shock in the flow are given in figures 17 and 18. They show very good repeatability of the pressure pattern.
Figure 13.—Axial distribution of static pressures (test condition C-255). 0.20 0.15 0.10 Static pr essur e, p/P PT [1] 0.05 0.00 Axial position, x/HT [1]
Sidewall centerline taps Contour midline taps Centerline PSP data Cornerline PSP data 6 4 2 0
Figure 14.—Comparison of pressure distributions for different test conditions (C-140, C-170, C-205, and C-255). 0.20 0.15 0.10 Static pr essur e, p/P PT [1] 0.05 0.00 Axial position, x/HT [1]
Sidewall centerline taps Contour midline taps Centerline PSP data
6 4
2 0
Figure 15.—Shadowgraph of an oblique shock wave (test condition C-140).
Figure 16.—Static pressure map of the oblique-shock/wall interaction with superimposed shock shadowgraph (test condition C-140).
Flow direction 0.130 0.124 0.118 0.112 0.106 0.100 0.094 0.088 0.082 0.076 0.070 0.064 0.058 0.052 0.046 Pressure field scale, p/PPT
Figure 17.—Static pressure map of the oblique-shock/wall interaction (test condition C-170). Flow direction 0.130 0.124 0.118 0.112 0.106 0.100 0.094 0.088 0.082 0.076 0.070 0.064 0.058 0.052 0.046 Pressure field scale, p/PPT
Figure 18.—Static pressure map of the oblique-shock/wall interaction (test condition C-270). 0.130 0.124 0.118 0.112 0.106 0.100 0.094 0.088 0.082 0.076 0.070 0.064 0.058 0.052 0.046 Pressure field scale, p/PPT Flow direction
8 NASA/TM—1998-107527 The pressure distribution along the channel centerline, as
taken from the PSP data, is shown in figure 19 (test condition C-170). The data from the sidewall centerline static taps and contour midline taps are also shown in the same figure. The centerline and contour midline tap data for x/HT = 15.2 and x/HT = 15.9 are in excellent agreement. Both measurements indicate a uniform static pressure field ahead of the wedge. At
x/HT = 16.6, the centerline tap is in the region of elevated static pressure caused by the shock-wave/boundary-layer interac-tion, whereas the contour midline tap is still in the undisturbed flow.
The sidewall tap data were used for the in situ calibration of the PSP signal. The selection of the sidewall centerline was appropriate because the pressure range of the taps data is close to the pressure range of the PSP data. Consequently, the calibration constants of the PSP signal were determined with higher accuracy than they were for the nozzle throat area. The higher accuracy of the PSP calibration procedure is demon-strated in figure 20, where the centerline PSP data for five test conditions are plotted on a single graph. As seen here, the data for all test conditions collapse onto a single curve with minimal deviations, contrary to the data presented in figure 14 for the nozzle throat area. The standard deviation of the PSP data is
±0.9%. There is, however, another problem in this graph, which is discussed in the following paragraphs.
The PSP data in figure 20 collapsed very well onto the same curve. However, the PSP data indicate a pressure gradient in the undisturbed flow ahead of the wedge, which is noticeably larger than the pressure gradient recorded by the centerline taps. The gradient of the pressure ratio, (∆p/PPT)/∆x, for the
PSP data in figure 20 (between the first two centerline static taps) is 0.305*10–3 mm–1. For the tap data, it is only 0.106*10–3 mm–1. This means, for example, that for a plenum total pressure of 170 kPa and an axial range of 51 mm (from
x/HT = 15.2 to x/HT = 16.6), the static pressure rises 0.9 kPa
according to the tap data, but rises 2.6 kPa according to the PSP data. The average pressure level in the test section for the undisturbed flow was 11 kPa.
The reason for the difference in the pressure gradients recorded by the PSP and the taps is not at all clear. Currently, a linear function between the PSP signal intensity and pressure values is used for calibration. We suggest that a higher order calibration curve should be explored in an attempt to resolve this difference. In any case, at present this discrepancy must be incorporated in the PSP experimental error band. The standard deviation error band of the PSP data in this particular applica-tion is therefore ±8.0%.
Effects of Elevated Temperature
The signal of most pressure sensitive paints is noticeably sensitive to temperature variation, which can significantly affect its accuracy. Several schemes have been proposed to compensate for temperature effects (ref. 8). But they are rather involved, and more importantly, they require a detailed knowl-edge of the temperature field of the surface investigated. If the temperature changes are not large (<80 K), particularly when the spatial temperature variations are small (<10 K), then the in situ method can be used to calibrate the PSP signal.
In order to assess the temperature effects, the total tempera-ture of the flow was increased, and the experiment in the shock/ wall interaction region was repeated. The total temperature in the plenum was raised from 292 to 425 K. Although the actual surface temperature was not measured, calculations based on
Figure 19.—Static pressure distribution along the channel centerline (test condition C-170).
0.20 0.15 0.10 Static pr essur e, p/P PT [1] 0.05 0.00 Axial position, x/HT [1]
Sidewall centerline taps Contour midline taps Centerline PSP data
18 17
16 15
Figure 20.—Static pressure distributions along the channel centerline for cold flow test conditions (C-140, C-170, C-205, C-240, and C-270). 0.20 0.15 0.10 Static pr essur e, p/P PT [1] 0.05 0.00 18 17 16 Axial position, x/HT [1] 15
Sidewall centerline taps Contour midline taps Centerline PSP data
the flow static temperature and heat losses through the channel sidewall indicate a temperature increase of about 50 K on the surface investigated.
The results for the unheated flow and the flow with the elevated temperature, at the same plenum pressure, are given in figures 17 and 21 (test conditions C-170 and H-170, respectively). The general outlines of both pressure fields look similar, but small scale differences are immedi-ately visible. First, the pressure contour map of the heated flow looks fuzzy in comparison with the unheated flow. The pressure contour lines are jagged and not well defined. Second, the shock-wave imprint on the sidewall looks wider, particularly at low pressure levels (at the transition from the shock imprint to the undisturbed flow). Third, across the channel height the pressure distribution in the undisturbed flow clearly shows lower pressures at the upper
Figure 21.—Static pressure map of the oblique-shock/wall interaction (test condition H-170). Flow direction 0.150 0.142 0.134 0.126 0.118 0.110 0.102 0.094 0.086 0.078 0.070 0.062 0.054 0.046 0.038 Pressure field scale, p/PPT
and lower channel walls. Conversely, in the unheated flow the pressure field at the same location is quite uniform. Finally, the contour plot of the heated flow indicates that the increase in wall pressure was more rapid ahead of the wedge in the undisturbed flow region than was the case for the unheated flow.
Additional differences between the heated and unheated flows can be observed in the axial distributions along the channel centerline (see figs. 19 and 22). The pressure distribu-tion for the heated flow exhibits very high noise (signal jitter, which can be smoothed out by applying a running average method). Also, the PSP data for the heated flow clearly indicate that the pressure gradient is noticeably higher in the undisturbed flow than in the unheated flow. The trend of the PSP data ahead of the wedge visibly differs from the trend of the static tap data in the same region.
Figure 22.—Static pressure distribution along the channel centerline (test condition H-170).
0.20 0.15 0.10 Static pr essur e, p/P PT [1] 0.05 0.00 Axial position, x/HT [1]
Sidewall centerline taps Contour midline taps Centerline PSP data
18 17
16 15
10 NASA/TM—1998-107527 The growing difference between the PSP data and the tap
data with increasing temperature is a significant problem, and it must be included in the experimental error band as it was for the unheated flow. The standard deviation of the PSP data for the heated flow is estimated as ±16%— that is double the value at the unheated flow conditions. The difference in the interpre-tation of the PSP data for the heated and unheated cases indicates the strong effect of the flow temperature on the calibration of the PSP signals. It appears that even the “safe” method of in situ calibration does not guarantee highly accurate PSP data for the elevated temperature cases. Additional atten-tion must be paid to such cases to improve the accuracy of PSP and its reliability in applications with elevated temperature flows.
Problem of Internal Reflection
One problem in the application of PSP to flows in narrow channels is that of signal misinterpretation due to signal reflec-tions from neighboring walls. In external aerodynamics and large wind tunnel applications, this is only a marginal problem, restricted to a few configurations. In internal flow applications, however, this signal contamination is practically inevitable.
Figures 23 and 24 dramatically demonstrate the problem of internal reflections. Figure 23 shows a skewed picture of the test section where the back wall was replaced by a window. No PSP was applied here. A mirror image of the wedge face (specular reflection) is clearly seen; actually, there are two images—one from the inner surface and the other from the external surface of the glass. Figure 24 shows a similar situa-tion; this time, however, the back wall was solid and painted with PSP (test condition C-140). The wedge was also painted. The PSP signal from the wedge face is superimposed on the signal from the solid wall (ghost image). The region of reflected signal is manifested as a region of elevated pressure on the sidewall. Clearly, if an experimenter were not aware of the PSP signal reflection, the sidewall pressure map interpolation would be completely false. The same flowfield is shown in figure 16, but the observation angle in that case was chosen so as to suppress the recording of reflected signals (ghost image).
In simple geometries and in situations where it is possible to arrange for observation angles perpendicular to the surfaces investigated, the danger of data contamination due to internal reflections is minimized. However, in many situations, particu-larly in turbomachinery applications, the surfaces investigated can be observed only at oblique angles, the surrounding sur-faces are very close and highly curved, and thus, the danger of ghost images and pressure map contamination is very high.
There is no generic solution for eliminating ghost images and signal contamination in curved narrow channels. The experi-menter must be aware of this danger. It is good practice to apply PSP to only one surface at a time and paint the remaining surfaces with antireflection coatings. If possible, the recording
Figure 23.—Optical reflection of the wedge face on the channel back sidewall.
C-96-0533
Figure 24.—PSP signal reflection of the wedge face pressure field on the channel backwall pressure field (test condition C-140). 18.4 17.6 16.8 16.0 15.2 14.4 13.6 12.8 12.0 11.2 10.4 9.6 8.8 8.0 7.2 Pressure field scale, [kPa]
camera should be placed perpendicular to the surface to be investigated. Finally, in situations where optical access allows observation only at oblique angles, two data sets should be recorded, each taken at different illumination and recording angles. Because the position of a ghost image depends on the observation angle, the pressure maps retrieved from the two data sets will be identical within the experimental error band only if they are free of ghost images. Only then do they represent the reflection-free pressure field of the surface.
Conclusions
Experience gained with the pressure sensitive paint tech-nique applied to supersonic flow in a narrow channel leads to the following conclusions:
1. The PSP technique is an excellent qualitative tool for acquiring images of wall static pressure fields in internal flow applications, if signal internal reflections are avoided.
2. The accuracy of the PSP data acquired in narrow channels lags behind the accuracy of the wall tap data; therefore, the calibration procedure must be improved.
3. The standard deviation of the experimental error band was determined to be ±8.0% for the unheated flow at a pressure level of 11 kPa.
4. Elevating the temperature of the flow generates a high level of noise in the PSP data (signal jitter) and noticeably decreases the accuracy of the data.
5. The standard deviation of the PSP data with a wall tem-perature rise of 50 K increased to ±16.0% at a pressure level of 11 kPa.
6. Signal internal reflection at certain observation angles can severely contaminate and distort the image of the investi-gated pressure field.
References
1. Bruckner, R.J.; and Lepicovsky, J.: A Supersonic Tunnel for Laser and Flow-Seeding Techniques. AIAA Paper 94–1824 (NASA TM–106588), 1994. 2. Lepicovsky, J.; and Bruckner, R.J.: Seeding for Laser Velocimetry in Confined Supersonic Flows With Shocks. NASA TM–107265, 1996. 3. Morris, M.J., et al.: Aerodynamic Applications of Pressure-Sensitive
Paint. AIAA Paper 92–0264, 1992.
4. Crites, R.C.: Pressure Sensitive Paint Technique. VKI-LS-1993-05, 1993. 5. Bencic, T.J.: Experience Using Pressure Sensitive Paint in NASA Lewis Research Center Propulsion Test Facilities. AIAA Paper 95–2831, 1995. 6. Lepicovsky, J., et al.: Modern Experimental Techniques in Turbine Engine
Testing. NASA TM–107383, 1996.
7. Lepicovsky, J.; Schodl, R.; and Bruckner, R.J.: Evaluation of NASA/DLR Test Channel for Optical Diagnostic Studies. NASA TM–107507, 1997. 8. Morris, M.J.; and Donovan, J.F.: Application of Pressure- and
This publication is available from the NASA Center for AeroSpace Information, (301) 621–0390.
REPORT DOCUMENTATION PAGE
2. REPORT DATE
19. SECURITY CLASSIFICATION OF ABSTRACT
18. SECURITY CLASSIFICATION OF THIS PAGE
Public reporting burden for this collection of information is estimated to average 1 hour per response, including the time for reviewing instructions, searching existing data sources, gathering and maintaining the data needed, and completing and reviewing the collection of information. Send comments regarding this burden estimate or any other aspect of this collection of information, including suggestions for reducing this burden, to Washington Headquarters Services, Directorate for Information Operations and Reports, 1215 Jefferson Davis Highway, Suite 1204, Arlington, VA 22202-4302, and to the Office of Management and Budget, Paperwork Reduction Project (0704-0188), Washington, DC 20503.
NSN 7540-01-280-5500 Standard Form 298 (Rev. 2-89)
Prescribed by ANSI Std. Z39-18 298-102 Form Approved OMB No. 0704-0188 12b. DISTRIBUTION CODE 8. PERFORMING ORGANIZATION REPORT NUMBER 5. FUNDING NUMBERS 3. REPORT TYPE AND DATES COVERED
4. TITLE AND SUBTITLE
6. AUTHOR(S)
7. PERFORMING ORGANIZATION NAME(S) AND ADDRESS(ES)
11. SUPPLEMENTARY NOTES
12a. DISTRIBUTION/AVAILABILITY STATEMENT
13. ABSTRACT (Maximum 200 words)
14. SUBJECT TERMS 17. SECURITY CLASSIFICATION OF REPORT 16. PRICE CODE 15. NUMBER OF PAGES 20. LIMITATION OF ABSTRACT Unclassified Unclassified Technical Memorandum Unclassified National Aeronautics and Space Administration
Lewis Research Center Cleveland, Ohio 44135 – 3191 1. AGENCY USE ONLY (Leave blank)
10. SPONSORING/MONITORING AGENCY REPORT NUMBER 9. SPONSORING/MONITORING AGENCY NAME(S) AND ADDRESS(ES)
National Aeronautics and Space Administration Washington, DC 20546– 0001 May 1998 NASA TM—1998-107527 AIAA–97–3214 E–10842 WU–523–26–13–00 17 A03 Application of Pressure Sensitive Paint to Confined Flow at Mach Number 2.5
J. Lepicovsky, T.J. Bencic and R.J. Bruckner
Wall pressures; Supersonic flow; Experimental techniques Unclassified - Unlimited
Subject Category: 07 Distribution: Nonstandard
Prepared for the 33rd Joint Propulsion Conference and Exhibit, cosponsored by AIAA, ASME, SAE, and ASEE, Seattle, Washington, July 6–9, 1997. J. Lepicovsky, NYMA Inc., 2001 Aerospace Parkway, Brook Park, Ohio 44142 (work funded by NASA Contract NAS3-27186); T.J. Bencic and R.J. Bruckner, NASA Lewis Research Center. Responsible person, T.C. Bencic, organization code 5810, (216) 433–5690.
Pressure sensitive paint (PSP) is a novel technology that is being used frequently in external aerodynamics. For internal flows in narrow channels, and applications at elevated nonuniform temperatures, however, there are still unresolved prob-lems that complicate the procedures for calibrating PSP signals. To address some of these probprob-lems, investigations were carried out in a narrow channel with supersonic flows of Mach 2.5. The first set of tests focused on the distribution of the wall pressure in the diverging section of the test channel downstream of the nozzle throat. The second set dealt with the distribution of wall static pressure due to the shock/wall interaction caused by a 25° wedge in the constant Mach number part of the test section. In addition, the total temperature of the flow was varied to assess the effects of temperature on the PSP signal. Finally, contamination of the pressure field data, caused by internal reflection of the PSP signal in a narrow channel, was demonstrated. The local wall pressures were measured with static taps, and the wall pressure distributions were acquired by using PSP. The PSP results gave excellent qualitative impressions of the pressure field investigated. However, the quantitative results, specifically the accuracy of the PSP data in narrow channels, show that improvements need to be made in the calibration procedures, particularly for heated flows. In the cases investigated, the experimental error had a standard deviation of ±8.0% for the unheated flow, and ±16.0% for the heated flow, at an average pressure of 11 kPa.

![Figure 11.—Evolution of the static pressure profiles (test condition C-140).0.170.13Pressure, p/PPT [1]0.090.05 1.00.50.0](https://thumb-us.123doks.com/thumbv2/123dok_us/1876351.2773950/9.918.490.832.672.1045/figure-evolution-static-pressure-profiles-test-condition-pressure.webp)
![Figure 13.—Axial distribution of static pressures (test condition C-255).0.200.150.10Static pressure, p/PPT [1]0.050.00 Axial position, x/H T [1]](https://thumb-us.123doks.com/thumbv2/123dok_us/1876351.2773950/10.918.144.421.92.746/figure-axial-distribution-pressures-condition-static-pressure-position.webp)

![Figure 20.—Static pressure distributions along the channel centerline for cold flow test conditions (C-140, C-170, C-205, C-240, and C-270).0.200.150.10Static pressure, p/PPT [1]0.050.00 181716Axial position, x/HT [1]15](https://thumb-us.123doks.com/thumbv2/123dok_us/1876351.2773950/12.918.137.418.316.986/figure-static-pressure-distributions-centerline-conditions-pressure-position.webp)


