What was the surface temperature in central Antarctica
during the last glacial maximum ?
Thomas Blunier
a;, Jakob Schwander
a, Je¤ro“me Chappellaz
b,
Fre¤de¤ric Parrenin
b, Jean Marc Barnola
ba Climate and Environmental Physics, Physics Institute, University of Bern, Sidlerstrasse 5, CH-3012Bern, Switzerland b CNRS Laboratoire de Glaciologie et Ge¤ophysique de l’Environnement (LGGE), BP 96, 38402St Martin d’He'res Cedex, France
Received 10 June 2003; received in revised form 11 November 2003; accepted 13 November 2003
Abstract
The temperature increase at Vostok (Antarctica) from the last glacial maximum to the present warm period is about 8‡Cbased on the deuterium isotope profile. The bore hole temperature (temperature profile in the ice sheet) indicates that the temperature difference may have been much larger, about 15‡C. The temperature dependent gas occlusion process is the key to evaluate the two scenarios. Atmospheric air penetrates the porous firn layer of the ice sheet and gets trapped at the firn ice boundary. Consequently the air is younger than the surrounding ice when it gets enclosed in bubbles. This age difference (vage) between ice and enclosed gas is temperature and accumulation rate dependent.
Therefore it is possible to estimate paleotemperatures from a knownvage. We use the linkage between chronologies
of CH4 and water isotopes from Byrd station and Vostok to obtain an experimental vage for Vostok. This
experimentalvage is then compared to modeledvage for the two temperature scenarios. Our results indicate that the
temperature reconstruction deduced from the water isotopic composition is the more probable one. 9 2003 Elsevier B.V. All rights reserved.
Keywords: ice core; Antarctic temperature; gas occlusion; last glacial maximum
1. Introduction
Local temperature from ice cores can be recon-structed using the temperature dependence of the isotopic composition of precipitation. The iso-topic composition is translated into a local surface temperature with a linear relationship between the annual mean temperature and the annual mean
isotope value. The slope is that of today’s spatial relationship ; thus assuming that the temporal slope (at one site) is identical to the spatial slope (today). These paleotemperature reconstructions have been questioned by surface temperature es-timates from bore hole temperature measurements
[1^3]. The temperature at the surface of the ice sheet de¢nes the heat £ow to depth. The resulting temperature pro¢le, measured in a bore hole of a deep drilling, can be used to reconstruct past sur-face temperature by inverse modeling. Unfortu-nately bore hole temperature measurements have not the time resolution to resolve fast climatic
* Corresponding author. Tel. : +41-(0)31-631-44-71.
E-mail address:[email protected](T. Blunier).
Earth and Planetary Science Letters 218 (2004) 379^388
R
changes such as Dansgaard^Oeschger events or the Younger Dryas, nor do they give access to surface temperature changes older than the late glacial. However, the bore hole approach is well suited to reconstruct the long term glacial^inter-glacial temperature di¡erence. The result of this exercise is a signi¢cantly lower last glacial (LG) temperature than suggested from the water iso-tope variations for both Greenland and Antarctic sites.
For central Greenland the spatial relation be-tween N18O and temperature is 0.67x/‡Ctoday [4,5]. Based on the bore hole temperature, and con¢rmed by various independent studies, the re-lation was rather 0.33x/‡Cin the past [2,3,6^8].
Thus the glacial^interglacial temperature di¡er-ence was on the order of 20‡C. The relation based on the bore hole temperature remained probably
valid over the fast interstadial temperature
changes to the early Holocene [6^8]. Model stud-ies suggest that, for central Greenland, the slope in the past is di¡erent of today’s spatial slope due to a change in the precipitation seasonality (see [9] and references therein).
For central Antarctica the spatial relationship between the water isotopic composition and sur-face temperature estimates a temperature di¡er-ence of 7^10‡Cbetween the LG and the present interglacial [10,11]. Today the slope between water isotopes and local temperature is 6.04x/
‡Cfor ND for Vostok [11], and 0.99x/‡Cfor N18O for Byrd station[10]. Model calculations in-dicate that this spatial relationship was basically valid throughout the LG [11^14]. A study based on the thermal fractionation of nitrogen and ar-gon isotopes at 108 kyr BP, the transition of iso-tope stage 5d/5c[15], suggests that the spatial
re-lationship may slightly underestimate the
temperature di¡erence between 108 kyr BP and today by 20 S 15%[15]. On the other hand deute-rium excess data suggest that the Holocene^LG temperature di¡erence is slightly reduced com-pared to the spatial relationship [16]. This study is an extension to the spatial relationship and takes into account temperature changes at the source region of precipitation at Vostok.
The water isotope based temperature recon-struction is questioned by a study based on bore
hole temperature measurements at Vostok which roughly doubles the Vostok glacial^interglacial temperature di¡erence. Salamatin et al.[1] estab-lished an independent time scale for the Vostok ice core. This time scale is based on the assump-tion that the orbital signal (harmonics of Milan-kovich periods) is imprinted in the surface tem-perature and therefore also in the bore hole temperature record. Using this chronology Sala-matin et al. are able to compare the bore hole temperature record to bore hole temperature rec-ords modeled from surface temperature. They
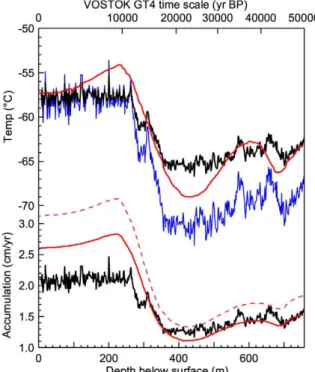
Fig. 1. Temperature and accumulation rate time series for Vostok used as input for the densi¢cation model. Heavy black lines: Temperature [23] and accumulation rate [32] used for the ‘standard’ (TWI) scenario. Light black (blue) line : For this scenario (TBH2) the TWI temperature record was stretched so that the increase from the last glacial to the Holocene becomes 15‡C. Grey (red) lines: Original tempera-ture and accumulation rate from Salamatin et al.[1] (¢g. 5, Scenario 1) used for our scenario TBH1. Dashed line : TBH1 with a 20% increased accumulation rate. For the calculation of the TBH scenarios we used the corresponding time scale from Salamatin et al. For the presentation in Fig. 3 we transferred the results to the GT4 time scale. (For colour see online version.)
observe that the modeled temperature agrees best to the measured temperature when the isotopic surface temperature (slope 6.04x/‡C) is allowed
more intense precession oscillations. The result is a LG surface temperature which is 15‡Clower than during the early Holocene, nearly doubling the estimate from today’s spatial relationship be-tween the water isotopic composition and surface temperature (see Fig. 1). The isotopic value is linked to the temperature where snow forms. In Antarctica this is assumed to be just above the inversion layer. Today the inversion layer temper-ature change is 0.67 times the surface tempertemper-ature variation at Vostok [11]. Salamatin et al. suggest that the relationship between inversion and sur-face temperature was not constant in the past to explain the disaccord between isotope and bore hole based temperature estimates.
An independent way to judge past temperature estimates comes from the gas occlusion process. The uppermost part of the ice sheet called ¢rn is permeable. Thus gases get occluded but in a depth of 50^150 m below surface. The consequence is that the occluded gas is younger than the sur-rounding ice. The ¢rni¢cation process and the re-sulting age di¡erence (vage) and the associated close o¡ depth (COD) are sensitive to temperature and accumulation rate. The processes are well understood and it is possible to calculate vage with a model. The model allows to investigate which temperature results in a vage compatible with observedvage. With this method it was pos-sible to show that the Greenland surface temper-ature derived from bore hole tempertemper-ature is the more probable one for the fast temperature changes in the LG [6]. We will apply the vage method to the Vostok ice core to evaluate the surface temperature reconstructions derived from water isotope (TWI) and bore hole temperature
(TBH) over the last 50 kyr.
2. Outline of the method
For the Greenland sites an empirical estimate of vage was deduced from climatic events re-corded simultaneously in the gas and in the ice record, namely the atmospheric CH4
concentra-tion and N18O [6]. The reconstruction was thus based on data from one core.
For Antarctic sites the global CH4 signal
(ne-glecting the bipolar concentration di¡erence of a few percent) is generally not synchronous to the N18O or ND signal [17]. Therefore water isotopes and CH4 records from two Antarctic ice cores
from sites with very di¡erent accumulation rate/ temperature conditions have to be combined to deduce an empirical vage.
Accumulation and temperature vary largely over the Antarctic continent and vage changes from a few hundred to several thousand years depending on the site. Varying the glacial temper-ature estimate will also change vage by centuries to millennia depending on the site. Starting from synchronized isotope records from two sites, the two CH4 records will be synchronous only if the
proper temperature scenario is used. This pro-vides us with the tool to test temperature scenar-ios. The more vage di¡ers between the two sites the more sensitive is the test. Byrd and Vostok stations have very di¡erent climatic conditions. Whilevage at Byrd station is only a few hundred years under present day conditions, reaching up to V1 kyr for the LG, this di¡erence reaches
several thousand years for Vostok. As for the Greenland debate [6] we will compare calculated vage estimates for di¡erent temperature scenarios to observed vages. To obtain an experimental vage for Vostok the procedure is as follows (see Section 4for details and discussion) : (1) The Byrd station and Vostok isotope records are put on the same time scale by synchronizing the records. (2) The gas age for the Byrd station CH4 data is
calculated (see also Section 3). (3) The Vostok CH4 record is synchronized to the Byrd CH4
rec-ord. From this exercise a gas age is assigned to each Vostok depth where there is a CH4 value.
Vostokvage is the di¡erence between ice age and gas age for individual CH4 samples.
3. vvage calculation
vage under di¡erent climatic conditions can be assessed by the determination of the depth of the ¢rn^ice transition and the age of the ice at this
depth using a ¢rn densi¢cation model on one hand and calculation of the age of the air at the transition depth with a di¡usion model on the other hand. Generally the two terms are separated by one to two orders of magnitude, the age of the ice at the ¢rn^ice transition being in the range of centuries to millennia and the age of the air being a few decades at most. The densi¢cation was cal-culated according to Schwander et al. [6]making use of a dynamical version of the empirical densi-¢cation model by Herron and Langway [6,18] from the surface density (taken as 350 kg m33)
to a density of 550 kg m33 and the semi-empirical
model by Pimienta and Barnola [19] for denser strata. The model includes the heat transfer in the ¢rn. This is important calculating vage over periods of climate change where the ¢rn temper-ature versus depth is not constant in time a¡ect-ing the densi¢cation process.
In order to calculate the age of the ice at the bubble COD the close o¡ density under past cli-matic conditions has to be known. Based on total gas content measurements Martinerie et al. [20] describe the close o¡ density as a function of tem-perature and pure ice density. A present day ¢rn air study at central Greenland shows that the air is isolated at a density 14 kg m33 lower than
estimated from total gas content measurements
[6]. This di¡erence is due to the presence of a non-di¡usive zone above the COD. For our vage calculations we reduce the close o¡ density obtained by the Martinerie equation by 14 kg m33 assuming that the density di¡erence between
air occlusion and air isolation is also applicable to other sites.
The age of the air at the COD is relatively small compared to the age of the ice. Under present day conditions it is less than 2% (Byrd and Vostok stations) of thevage and its portion is decreasing for colder climate. Therefore we parameterize the age of the air according to the Greenland results
[6] assuming that the di¡usive equilibration time is proportional to the square of the ¢rn thickness and that di¡usivity is proportional to T1:85 [21].
vage can now be calculated as the di¡erence be-tween the age of the ice deduced from the densi-¢cation model and the approximated age of the air.
Data used to determine the parameters of the densi¢cation model cover a temperature range
from 313 to 357‡Cand accumulation rates
from 0.02 to 0.5 m water equivalent based on present day conditions at various sites. Also the data used to obtain the close o¡ density cover the
temperature range from 313 to 357‡C. This
range includes all present and past temperature and accumulation rates for Byrd station over the last 50 kyr. Under present day conditions, the close o¡ ages given by the Pimienta^Barnola model deviate by less than 4% from observations
[19].
4. Observedvvage and COD at Vostok
We now experimentally assess vage and COD for the Vostok ice core. To do this we need to deduce the Vostok gas time scale independently. We obtain this time scale by synchronizing the Vostok CH4 record to the Byrd CH4 record. We
arbitrary chose the Vostok GT4 time scale as the reference time scale for our study. The choice of the reference time scale has some in£uence on the resulting vage which we will discuss later.
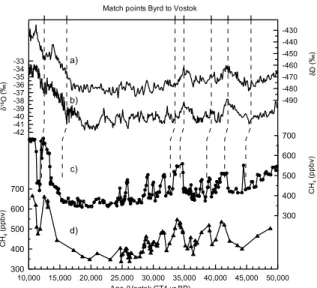
First the Byrd station time scale has to be synchronized to the Vostok GT4 reference time scale. Although Byrd and Vostok isotope records do not change in concert at all times, e.g. Byrd station indicates a temperature minimum before the deglaciation which is not seen in the Vostok record, they share major temperature events al-lowing a reasonable synchronization. We have matched the ByrdN18O record [22]to the Vostok ND record [23] by linear interpolation between match points chosen at prominent spots (match points are shown in Fig. 2). Obviously this is not a high precision synchronization. We estimate that the match is o¡ by no more than 1 kyr at the match points, with an increasing uncertainty of 100 yr per 1000 yr distance from the nearest match point. The synchronization is con¢rmed by the close match of the Vostok [24] and Byrd
[25]10Be peak located in the middle of two match
points around 37 kyr BP on the GT4 time scale. An independent match of the isotopic signals is within the estimated uncertainty [26].
We now calculate a Byrd gas age time scale applying the densi¢cation model. vage for Byrd station is calculated for two temperature scenar-ios. The higher scenario (TWI) is derived from
today’s spatial relation between temperature and N18O for Byrd [10]. For the lower temperature scenario (TBH) we refer to the results from
Sala-matin et al. [1] and increase the LG^Holocene temperature di¡erence to 15‡C. The accumulation rate was calculated following the approach from Jouzel et al. [23] assuming a linear relation be-tween accumulation rate and the derivative of the rate between water vapor partial pressure and temperature with respect to temperature. vages forTWI andTBH di¡er byV700 yr during
the last glacial maximum and less elsewhere. To account for some uncertainty in the Byrd station accumulation rate we decrease/increase the calcu-lated accumulation rate by 10% forTBH andTWI,
respectively. This increases the di¡erence between
vage for TWI and TBH by V150 yr for the last
glacial maximum. We continue with the mean gas age time scale from the two scenarios.
To obtain a gas age time scale for Vostok we synchronized the Vostok methane record with the Byrd methane record now on the GT4 time scale. We used a Monte Carlo method to search for a maximal correlation between the CH4 records[6].
Fig. 2 shows the result of this synchronization. We obtain an experimental vage for Vostok subtracting the gas age from the ice age at the same depth. That is for each CH4 data point in
the Vostok record. To estimate the total uncer-tainty of the experimental vage we use a boot-strap method which propagates the uncertainty of the isotope synchronization from Byrd and Vostok, the range of vage for Byrd for the two temperature scenarios (including S 10% accumu-lation variation), and the uncertainty of the syn-chronization of the CH4 records.
In a similar way we are able to deduce COD from the gas age and ice age time scales. We start out from the vdepth, the layer of ice between ice and gas of the same age. This layer was thinned during its £ow from the surface to the actual depth in the ice sheet. To obtain the COD we have to take into account this thinning of the initial ice layer which is calculated from the GT4 time scale and the densi¢cation from ¢rn to ice. The initial equivalent ice layer is V0.7
times the COD. Variations of this value are low within 5% for all climate conditions regarded here. We are now able to compare this experimen-talvage and COD for the Vostok ice core to the modeled values.
5. Validityof the densi¢cation model for Vostok glacial conditions
Vostok glacial conditions have no present day analog and we have no direct evidence that the densi¢cation model remains valid for these condi-tions. All the models presently in use are to some point empirical. The parameters are tuned to the present density pro¢les. The modeled vage for Vostok glacial conditions could deviate from the truevage due to an imperfect parameterization of
Fig. 2. Isotopic and CH4data from the Vostok and Byrd ice cores. All data are presented on the Vostok GT4 time scale [32]. Dotted lines indicate where the Byrd N18O record was
matched to the Vostok ND record. Ages in between these
points were interpolated linearly. The dotted lines also show where the match points are found in the Byrd CH4 record. The age di¡erence between a match point in the N18O and
the CH4 record equalsvage. (a)ND record from Vostok
sta-tion [23]. (b) N18O record from Byrd station [22]. (c) Byrd
CH4 record [17]. (d) Vostok CH4 record [32]. The Vostok CH4 record is matched directly to the Byrd CH4 record (see text).
the densi¢cation process itself or due to a £awed estimate of the close o¡ density. For Vostok the age of the ¢rn layer where the air is isolated from the atmosphere calculated by di¡erent models agrees within about S 100 yr for present condi-tions [27]. For glacial conditions the model
pre-dicted vages deviate more. However, for the
whole range of purely empirical to more or less physical models the range of predicted vages is only about S 500 yr [27]. We are therefore con-¢dent that the densi¢cation model is reasonable also for Vostok last glacial conditions.
Another critical point is the estimated density, and the corresponding depth, where the air is ¢-nally isolated from the atmosphere. The close o¡ density can be determined in several ways. We calculate close o¡ density based on the study of total air content from several sites [20,28] and correct it for the non-di¡usive zone (see above for details). Not applying this correction leads to an increasedvage of about 1 kyr. On the other hand total air content has been measured along the Vostok core and past close o¡ density can be estimated directly from these measurements, as-suming that the atmospheric pressure at the close o¡ did not change. Still, there exist only a few total air content measurements over the period examined here [20]. Arnaud et al. [27] compare vage calculated with close o¡ densities estimated directly from past total air contents at Vostok to vage calculated with the method used here extrap-olating from present total air contents from di¡er-ent sites. The resulting vages deviate only by a few hundred years.
An experimental estimate for the COD is the di¡usive column height (DCH) derived from the gravitational enrichment of N15N with depth under constant (steady state) climatic conditions
[29]. The DCH is always smaller than the COD as it does not include the convective zone on top and the non-di¡usive zone at the bottom of the ¢rn column [29]. For high accumulation sites DCH from N15N are generally in agreement with the densi¢cation model. However, for low accumula-tion sites like Vostok the DCH for the glacial period derived from N15N values are up to 60 m lower than the calculated COD [29^31]. This is also the case at the Vostok 5d/5c transition where
Caillon et al. [15] ¢nd an experimental COD of 123^135 m and a DCH of 84^86 m calculated from N15N measurements. Such a large di¡erence can hardly be explained by an increased convec-tive or non-di¡usive zone during the glacial. We do not have an explanation for this discrepancy.
Fig. 3. vage (A) and COD (B) for the Vostok ice core on
the GT4 time scale [32]. Black lines: Model calculations ob-tained with the ‘standard’ (TWI) Vostok temperature[23]and GT4 accumulation rate (today’s surface temperature has been taken as357.3‡C). The grey (yellow) areas showvage
and COD obtained with TWI and GT4 accumulation rates varied by S 10%. Thin dashed (orange) lines: Model calcula-tions obtained with a temperature estimate taking into ac-count the changes in the precipitation source region based on deuterium excess measurements [16]. Thin black (blue) lines: Model calculations obtained with the TBH2 scenario and GT4 accumulation rate. Grey (red) lines: Model calcula-tions obtained for the TBH1 scenario (Salamatin et al. [1], ¢g. 5, Scenario 1 and the corresponding time scale) (heavy line) and with a 20% increased accumulation rate (dashed line). Heavy green dashed lines: COD obtained from N15N
[29] (12 m have been added to account for the convective zone[34]). vage has been obtained using the model with the
standard parameters forcing close o¡ at the N15N implied
COD. Triangles: vage and COD obtained independently by
synchronizing the Byrd and Vostok records (see text). (For colour see online version.)
Indeed the empirically determined COD of 123^135 m at the Vostok 5d/5c transition, and probably also at termination III [31], is compat-ible with the modeled COD. This and the coher-ency between models of di¡erent make gives us con¢dence in the vage models also for climatic conditions exceeding the range of the calibration. It is at present still the best estimate for COD and vage. The accuracy for vage calculations is ex-pected to be within 10% of vage for Vostok [27].
6. Results and discussion
We now compare observed vage and COD at
Vostok with calculated vage and COD for TBH and TWI estimates (Fig. 3). Calculations were
made for the following scenarios (see Fig. 1):
TWI with the standard isotope temperature [23]
and accumulation rate corresponding to the GT4 time scale [32], TBH1 where temperature
and accumulation rate correspond to Scenario 1 in ¢g. 5 of Salamatin et al.[1],TBH2 is identical to TWI but the temperature increase from the last
glacial to the Holocene is stretched to become 15‡C [1]. Present day temperature was taken as 357.3‡C [33] for all calculations. We also
com-pare our empirical vage and COD to COD and
vage deduced from N15N data. N15N is a measure for the DCH which does not account for the well mixed convective zone. We obtain an estimate of
COD by adding 12 m [34] to the DCH obtained
from the N15N data [29].
Surprisingly the experimentally deduced COD ¢ts best COD deduced from N15N measurements between 45 and 15 kyr BP. As for the model simulations none of the calculated scenarios is able to reproduce the empirical data perfectly. Under the assumption that the densi¢cation mod-el is in principle still valid for the Vostok glacial conditions we observe that the TBH scenarios are
unlikely. On the other hand vage (COD) calcu-lated with the ‘standard’ isotopic temperature re-construction (TWI) ¢t much better to the
experi-mentalvage (COD) reconstruction (Fig. 3, heavy black line). However, also here the calculated vage is often beyond the range of the experimen-talvage.
Using the COD deduced from the N15N values we can use the model to calculate avage by
forc-ing close o¡ at the COD deduced from N15N.
Here it is relatively irrelevant which of the above temperature and accumulation rate scenarios is used. The consequence would be a close o¡ at a density of about 750 kg m33, which is in complete
disagreement with gas content results. Alterna-tively the COD can be forced to ¢t the N15N de-duced COD by starting out from a higher surface density. However, the magnitude of the surface density would have to be 600 kg m33. Such a
high density at the top of the ¢rn column di¡ers dramatically from values observed under dry sin-tering conditions and seems highly unlikely. How-ever, if it should turn out to be true this would hinder an interpretation in terms of temperature scenarios as the resulting vage is barely sensitive to the two temperature scenarios. For now we do not think that the N15N based reconstruction for COD is a real alternative.
Is it possible to bring experimental vage and model calculations into agreement accounting for the uncertainties of the model input parame-ters? vage is not only dependent on temperature but also on accumulation rate. For the Vostok ice core accumulation rate and time scale are linked by an ice £ow model. Orbital frequencies are im-printed in the Vostok time series [32,35] and the Vostok time scale attributes variations at orbital frequencies a correct age. Uncertainties linked with ice thinning in the depth range considered here are small. According to the GT4 time scale the annual layer thickness at 760 m below surface (corresponding to 50 kyr) is still 80% of the initial accumulation rate. Consequently the Vostok time scale and therefore also the accumulation rate is correct on average. However, the Vostok time scale may be and probably is temporary o¡set by several millennia. This uncertainty of the ice core time scale is obvious comparing time scales of di¡erent ice cores[17,26,35]. For Vostok a tem-porary o¡set time scale results in a temtem-porary o¡-set accumulation rate reconstruction and
there-fore to an o¡set vage. Parrenin et al. [35]
estimate the uncertainty of the Vostok GT4 time scale to about S 10% at 50 kyr BP. Accordingly the accumulation rate has an uncertainty of
roughly S 10% as well. For the TBH scenarios to
agree with the experimental data the accumula-tion rate would have to be increased throughout the core by more than 20% for TBH1, and over
40% for TBH2. This is clearly outside the
uncer-tainty of this parameter. Further, Salamatin et al.
[1]suggest also a larger glacial^interglacial di¡er-ence of the inversion layer temperature (10‡C). If the relationship between accumulation rate and the derivative of the rate between water vapor partial pressure and temperature with respect to temperature [23] remains valid, the low temper-ature of theTBH scenario results in a lower
accu-mulation rate (compared to GT4) which conse-quently leads to an increased vage. In summary, the bore hole temperature scenario with or with-out adjusted accumulation rate seems unlikely.
For the TWI scenario increasing the
accumula-tion rate by 10% does also not bring our modeled vage in full agreement with the data. However, the model approach by Arnaud et al. [27] leads tovages about 500 yr smaller than with our mod-el[33]. Together with a 10% higher accumulation this model is in agreement with our data. We also calculated vage for the source region corrected isotopic temperature [16] and GT4 accumulation rate. Temperatures are slightly higher compared to the uncorrected isotopic temperature which re-sults in a slightly smallervage and a better match to the experimental data. In summary the discrep-ancy between experimentalvage andvage for the
TWI model calculation disappears with a slightly
higher temperature and a 10% increased accumu-lation rate. However, a higher accumuaccumu-lation rate is not compatible with the fact that the Vostok time scale is rather too young compared to other ice cores between 50 and 10 kyr BP [26]. This signi¢es that the accumulation rate should rather be decreased to adjust the time scale to other ice core chronologies. A way out of this dilemma may be to keep the accumulation rate and to slightly change the ice £ow to make the time scale older over the last part of the glacial. This results in a larger experimentalvage bringing experimen-tal and model vage together holding on to the GT4 accumulation rate.
We are aware that all densi¢cation models lack strong veri¢cation by data for Vostok glacial
con-ditions, if we except the unique study on the 5d/5c transition [15]. However, the agreement between di¡erent models and their proven ability to simu-late the close o¡ process for high accumulation sites make it unlikely that they are largely o¡set for Vostok glacial conditions. We conclude that
experimentally deduced vages for Vostok are
within the model and accumulation rate uncer-tainty for the TWI temperature estimate which is
calculated according to today’s relationship be-tween temperature and isotopic signal. All uncer-tainties are not able to bring the modeled vage estimate in agreement with the TBH temperature
estimate based on measurements of the Vostok bore hole temperature.
The model uncertainty hinders a detailed tem-perature reconstruction from experimental vage in Antarctica, at least for the moment. Additional information concerning the temperature change
may come from more detailed CH4 records or
from additional N15N measurements which ob-serve thermal fractionation over periods of tem-perature change [15].
Acknowledgements
This work was supported by the University of Bern, the Swiss National Science Foundation, the EECproject Pole-Ocean-Pole (EVK2-2000-22067) and the Programme National d’Etude de la
Dy-namique du Climat of CNRS. We thank
FrancYoise Vimeux for discussion and Kurt Cu¡ey and anonymous reviewers for constructive
com-ments.[BARD]
References
[1] A.N. Salamatin, V.Y. Lipenkov, N.I. Barkov, J. Jouzel, J.R. Petit, D. Raynaud, Ice core age dating and paleo-thermometer calibration based on isotope and tempera-ture pro¢les from deep boreholes at Vostok Station (East Antarctica), J. Geophys. Res. 103 (1998) 8963^8977. [2] K.M. Cu¡ey, G.D. Clow, R.B. Alley, M. Stuiver, E.D.
Waddington, R.W. Saltus, Large arctic temperature change at the Wisconsin^Holocene glacial transition, Sci-ence 270 (1995) 455^458.
[3] S. Johnsen, D. Dahl-Jensen, W. Dansgaard, N. Gunde-strup, Greenland palaeotemperatures derived from GRIP
bore hole temperature and ice core isotope pro¢les, Tellus 47B (1995) 624^629.
[4] W. Dansgaard, Stable isotopes in precipitation, Tellus 16 (1964) 436^468.
[5] S.J. Johnsen, W. Dansgaard, J.W.C. White, The origin of Arctic precipitation under present and glacial conditions, Tellus 41B (1989) 452^468.
[6] J. Schwander, T. Sowers, J.-M. Barnola, T. Blunier, B. Malaize¤, A. Fuchs, Age scale of the air in the summit ice: Implication for glacial^interglacial temperature change, J. Geophys. Res. 102 (D16) (1997) 19483^19494. [7] J.P. Severinghaus, E.J. Brook, Abrupt climate change at
the end of the last glacial period inferred from trapped air in polar ice, Science 286 (1999) 930^934.
[8] M. Leuenberger, C. Lang, J. Schwander, N15N
measure-ments as a calibration tool for the paleothermometer and gas-ice age di¡erences. A case study for the 8200 B.P. event on GRIP ice, J. Geophys. Res. 104 (D18) (1999) 22163^22169.
[9] J. Jouzel, Calibrating the isotopic paleothermometer, Sci-ence 286 (1999) 910^911.
[10] G.de Q. Robin, TheNvalue-temperature relationship, in:
G.de Q. Robin (Ed.), The Climatic Record in Polar Ice Sheets, Cambridge University Press, London, 1983, pp. 180^184.
[11] J. Jouzel, F. Vimeux, N. Caillon, G. Delaygue, G. Ho¡-mann, V. Masson-Delmotte, F. Parrenin, Magnitude of isotope/temperature scaling for interpretation of central Antarctic ice cores, J. Geophys. Res. Atmos. 108 (D12) (2003), art. no. 4361.
[12] G. Delaygue, J. Jouzel, V. Masson, R.D. Koster, E. Bard, Validity of the isotopic thermometer in central Antarctica limited impact of glacial precipitation seasonality and moisture origin, Geophys. Res. Lett. 27 (2000) 2677^2680. [13] M.B. Hendricks, D.J. DePaolo, R.C. Cohen, Space and time variation ofN18O andND in precipitation: Can
pa-leotemperature be estimated from ice cores?, Glob. Bio-geochem. Cycles 14 (2000) 851^861.
[14] M. Werner, M. Heimann, G. Ho¡mann, Isotopic compo-sition and origin of polar precipitation in present and glacial climate simulations, Tellus 53B (2001) 53^71. [15] N. Caillon, J.P. Severinghaus, J.M. Barnola, J.
Chappel-laz, J. Jouzel, F. Parrenin, Estimation of temperature change and of gas age ice age di¡erence, 108 kyr BP, at Vostok, Antarctica, J. Geophys. Res. Atmos. 106 (D23) (2001) 31893^31901.
[16] F. Vimeux, K.M. Cu¡ey, J. Jouzel, New insights into Southern Hemisphere temperature changes from Vostok ice cores using deuterium excess correction, Earth Planet. Sci. Lett. 203 (2002) 829^843.
[17] T. Blunier, E.J. Brook, Timing of millennial-scale climate change in Antarctica and Greenland during the last gla-cial period, Science 291 (2001) 109^112.
[18] M.M. Herron, C.C. Langway Jr., Firn densi¢cation : An empirical model, J. Glaciol. 25 (1980) 373^385.
[19] J.-M. Barnola, P. Pimienta, D. Raynaud, Y.S. Korotke-vich, CO2^climate relationship as deduced from the
Vos-tok ice core: A re-examination based on new measure-ments and on a re-evaluation of the air dating, Tellus 43 (1991) 83^90.
[20] P. Martinerie, V.Y. Lipenkov, D. Raynaud, J. Chappel-laz, N.I. Barkov, C. Lorius, Air content paleo record in the Vostok ice core (Antarctica) : A mixed record of cli-matic and glaciological parameters, J. Geophys. Res. 99 (1994) 10565^10576.
[21] L. Andrussov, Di¡usion in Gasen, in: K. Scha«fer (Ed.), Landolt-Bo«rnstein. Zahlenwerte und Funktionen aus Physik, Chemie, Astronomie, Geophysik, Technik Vol. 2 (5a), Springer, Berlin, 1969, pp. 516^565.
[22] S.J. Johnsen, W. Dansgaard, H.B. Clausen, C.C. Lang-way Jr., Oxygen isotope pro¢les through the Antarctic and Greenland ice sheets, Nature 235 (1972) 429^434. [23] J. Jouzel, C. Lorius, J.R. Petit, C. Genthon, N.I. Barkov,
V.M. Kotlyakov, V.M. Petrov, Vostok ice core : A con-tinuous isotope temperature record over the last climatic cycle (160,000 years), Nature 329 (1987) 403^408. [24] G.M. Raisbeck, F. Yiou, J. Jouzel, J.R. Petit, N.I. Barkov,
E. Bard,10Be deposition at Vostok, Antarctica, during the last 50,000 years and its relationship to possible cosmo-genic production variations during this period, in: E. Bard, W.S. Broecker (Eds.), The last Deglaciation: Abso-lute and Radiocarbon Chronologies, NATO ASI Series Vol. I 2, Springer, Berlin, Heidelberg, 1992, pp. 127^140. [25] J. Beer, S.J. Johnsen, G. Bonani, R.C. Finkel, C.C. Lang-way, H. Oeschger, B. Stau¡er, M. Suter, W. Woel£i,10Be peaks as time markers in polar ice cores, in: E. Bard, W.S. Broecker (Eds.), The Last Deglaciation: Absolute and Radiocarbon Chronologies, NATO ASI Series Vol. I 2, Springer, Berlin, Heidelberg, 1992, pp. 141^153. [26] J. Schwander, J. Jouzel, C.U. Hammer, J.-R. Petit, R.
Udisti, E. Wol¡, A tentative chronology for the EPICA Dome Concordia ice core, Geophys. Res. Lett. 28 (2001) 4243^4246.
[27] L. Arnaud, J.-M. Barnola, P. Duval, Physical modeling of the densi¢cation of snow/¢rn and ice in the upper part of polar ice sheets, in: T. Hondoh (Ed.), Physics of Ice Core Records, Hokkaido University Press, Sapporo, 2000, pp. 285^305.
[28] P. Martinerie, D. Raynaud, D.M. Etheridge, J.-M. Bar-nola, D. Mazaudier, Physical and climatic parameters which in£uence the air content in polar ice, Earth Planet. Sci. Lett. 112 (1992) 1^13.
[29] T. Sowers, M. Bender, D. Raynaud, Y.S. Korotkevich,
N15N of N2 in air trapped in polar ice: A tracer of gas
transport in the ¢rn and a possible constraint on ice age^ gas age di¡erences, J. Geophys. Res. 97 (1992) 15683^ 15697.
[30] K. Kawamura, Variations of atmospheric components over the past 340,000 years from Dome Fuji deep ice core, Antarctica, Ph.D. thesis, Tohoku University, 2000. [31] N. Caillon, J.P. Severinghaus, J. Jouzel, J.-M. Barnola, J.
Kang, V.Y. Lipenkov, Timing of atmospheric CO2 and Antarctic temperature changes across termination III, Sci-ence 299 (2003) 1728^1731.
[32] J.R. Petit, J. Jouzel, D. Raynaud, N.I. Barkov, J.M. Bar-nola, I. Basile, M. Bender, J. Chappellaz, M. Davis, G. Delaygue, M. Delmotte, V.M. Kotlyakov, M. Legrand, V.Y. Lipenkov, C. Lorius, L. Pepin, C. Ritz, E. Saltzman, M. Stievenard, Climate and atmospheric history of the past 420,000 years from the Vostok ice core, Antarctica, Nature 399 (1999) 429^436.
[33] C. Goujon, J.-M. Barnola, C. Ritz, Modelling the densi-¢cation of polar ¢rn including heat di¡usion: Application
to close-o¡ characteristics and gas isotopic fractionation for Antarctica and Greenland, J. Geophys. Res., in press. [34] M.L. Bender, T. Sowers, J.-M. Barnola, J. Chappellaz, Changes in O2/N2 ratio of the atmosphere during recent decades re£ected in the composition of air in the ¢rn at Vostok Station, Geophys. Res. Lett. 21 (1994) 189^192. [35] F. Parrenin, J. Jouzel, C. Waelbroeck, C. Ritz, J.M.
Bar-nola, Dating the Vostok ice core by an inverse method, J. Geophys. Res. Atmos. 106 (D23) (2001) 31837^31851.
![Fig. 3. vage (A) and COD (B) for the Vostok ice core on the GT4 time scale [32]. Black lines: Model calculations ob-tained with the ‘standard’ (T WI ) Vostok temperature [23] and GT4 accumulation rate (today’s surface temperature has been taken as 357.3‡C](https://thumb-us.123doks.com/thumbv2/123dok_us/1896007.2777078/6.816.428.750.270.646/vostok-calculations-standard-vostok-temperature-accumulation-surface-temperature.webp)
