THE VALUE OF ADMINISTRATIVE BEHAVIORS: A COMPARATIVE STUDY OF SPECIAL EDUCATION TEACHERS AND BUILDING
ADMINISTRATORS IN KANSAS
by
CASEY L. EWY
B.S., Kansas State University, 1995 M.S., Kansas State University, 2000
AN ABSTRACT OF A DISSERTATION
Submitted in partial fulfillment of the requirements for the degree
DOCTOR OF EDUCATION
Department of Special Education College of Education
KANSAS STATE UNIVERSITY Manhattan, Kansas
Finding qualified teachers is a growing concern to school districts nationwide. Special Education is one of those areas that is highly in need. Researchers have suggested the reason for these shortages is not recruitment of special education teachers, but the retention of special education teachers. The research has also shown that lack of effective building administrative support may be a critical factor in a teachers’ decision to stay or leave the field. This study was developed to determine what administrative behavior special education teachers value the most. Additionally, this study sought to find out if there were differences in the administrative behaviors that special education teachers value and what building administrators perceive to be of value.
A survey was sent electronically to a random sample of convenience to 200 special education teachers and 200 building administrators in the state of Kansas; 276 surveys were returned. The survey collected data to determine the perceived value of administrative support behaviors by the special education teachers, and any differences of the perceived value of administrative supports by the building administrators. The survey items were categorized into four
subgroups of administrative behaviors: emotional, environmental, technical, and instructional.
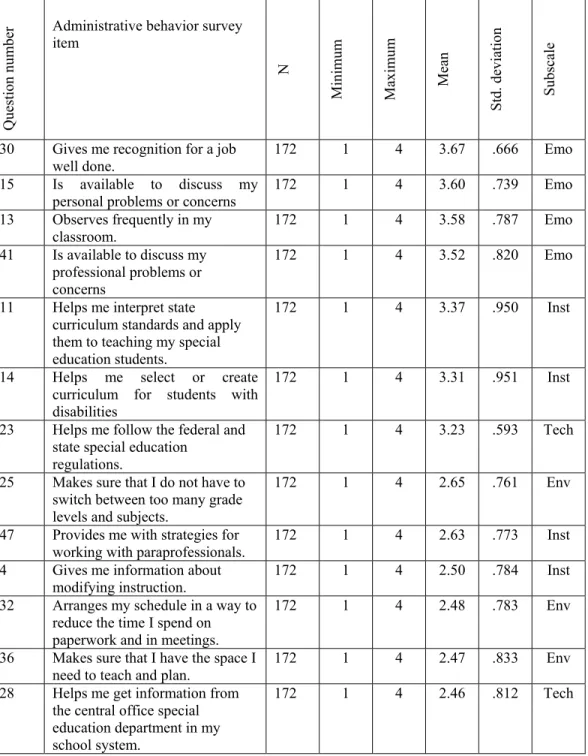
The administrative behaviors of most value to the special education teachers were those that were emotional in nature. Respondents reported that the most valued support actions included providing praise and acknowledging that the
the teacher’s judgment. Findings also indicated that there were statistically significant differences between what administrative supports special education teachers valued and what building administrators perceive to be of value to special education teachers, with the exception of the technical administrative support actions.
These findings suggested that it would benefit school districts positively to implement strategies to evaluate the emotional support provided and desired by their special education teachers as one method to reduce special education teacher attrition. One way of ensuring administrators provide these supports is to hold them accountable, perhaps through policy change in the evaluation process. With recent legislation such as No Child Left Behind, mandating all students receive a quality education form qualified teachers despite the current shortage of special education teachers; administrators must implement strategies to reduce teacher attrition.
STUDY OF SPECIAL EDUCATION TEACHERS AND BUILDING ADMINISTRATORS IN KANSAS
by
CASEY L. EWY
B.S., Kansas State University, 1995 M.S., Kansas State University, 2000
A DISSERTATION
Submitted in partial fulfillment of the requirements for the degree
DOCTOR OF EDUCATION
Department of Special Education College of Education
KANSAS STATE UNIVERSITY Manhattan, Kansas
2007
Approved by: Approved by:
________________ ________________
Co-Major Professor Co-Major Professor
Finding qualified teachers is a growing concern to school districts nationwide. Special Education is one of those areas that is highly in need. Researchers have suggested the reason for these shortages is not recruitment of special education teachers, but the retention of special education teachers. The research has also shown that lack of effective building administrative support may be a critical factor in a teachers’ decision to stay or leave the field. This study was developed to determine what administrative behavior special education teachers value the most. Additionally, this study sought to find out if there were differences in the administrative behaviors that special education teachers value and what building administrators perceive to be of value.
A survey was sent electronically to a random sample of convenience to 200 special education teachers and 200 building administrators in the state of Kansas; 276 surveys were returned. The survey collected data to determine the perceived value of administrative support behaviors by the special education teachers, and any differences of the perceived value of administrative supports by the building administrators. The survey items were categorized into four
subgroups of administrative behaviors: emotional, environmental, technical, and instructional.
The administrative behaviors of most value to the special education teachers were those that were emotional in nature. Respondents reported that the most valued support actions included providing praise and acknowledging that the
the teacher’s judgment. Findings also indicated that there were statistically significant differences between what administrative supports special education teachers valued and what building administrators perceive to be of value to special education teachers, with the exception of the technical administrative support actions.
These findings suggested that it would benefit school districts positively to implement strategies to evaluate the emotional support provided and desired by their special education teachers as one method to reduce special education teacher attrition. One way of ensuring administrators provide these supports is to hold them accountable, perhaps through policy change in the evaluation process. With recent legislation such as No Child Left Behind, mandating all students receive a quality education form qualified teachers despite the current shortage of special education teachers; administrators must implement strategies to reduce teacher attrition.
Table of Contents
List of Figures ix
List of Tables x
Acknowledgements xii
Chapter 1: Introduction 1
Statement of the Problem 3
Purpose of the Study 5
Research Questions 6
Statement of Significance 7
Theoretical Foundation 9
Summary of the Methodology 14
Delimitations 14
Limitations 15
Definitions 16
Summary 17
Chapter 2: Review of the Literature 19
Introduction 19
Origins of Special Education 22
Administrative Responsibilities 26
Special Education Teachers 40
Attrition of Special Education Teachers 42
Summary 55
Chapter 3: Design of the Study 57
Overview of the Methodology 57
Statement of Research Questions 58
Population and Sample 59
Instrumentation 61
Data Analysis 67
Human Subjects and Ethics Precautions 68
Summary 69
Chapter 4: Results 70
Survey Results: Sample Characteristics 72
Teaching Model 72
Plans for the Next School Year 74
Number of Principals 74
Number of Assistant Principals 75
Demographic Summary 75
Presentation of the Data: Research Questions 76
Research Question 1 77
Research Question 2 82
Summary 96
Chapter 5: Interpretations, Conclusions, and Recommendations 99
Research Questions 101 Summary of Results 101 Research Question 1 101 Research Question 2 102 Summary 102 Interpretation of Findings 104
Conclusions and Recommendations 106
Recommendations for Further Research 107
Summary 108
References 111
Appendix A: IRB Approval Letter 119
Appendix B: State of Kansas Map 121
Appendix C: Survey Email
123
Appendix D: Notice of Informed Consent
125
Appendix E: Survey Items Grouped by Subscale 127 Appendix F: Permission to Use and Modify Balfour’s Survey
132
Appendix G: Survey Instrument 132
Appendix H: Email to Superintendents and Special Education Directors
142
List of Figures
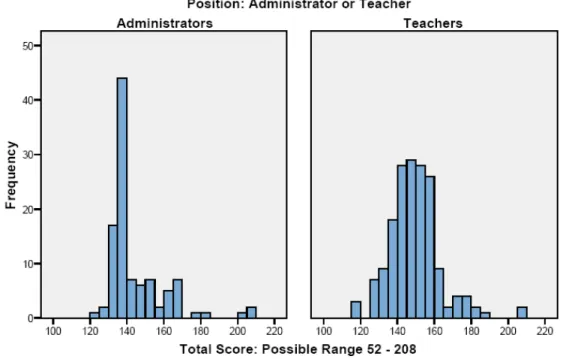
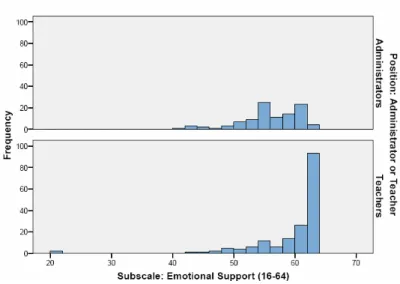
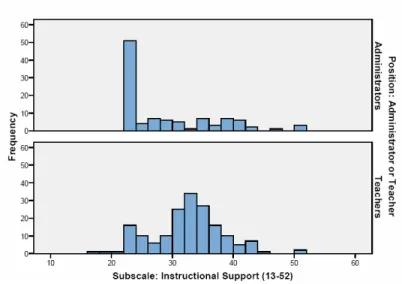
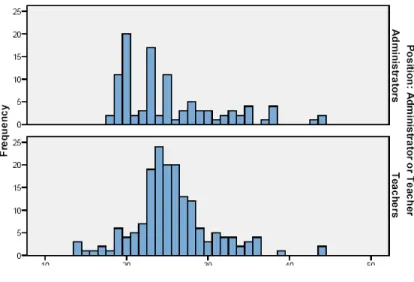
Figure 1: Total Mean Survey Scores of Administrators and Teachers 84 Figure 2: Comparison of Emotional Support by Position 90 Figure 3: Comparison of Environmental Support by Position 90 Figure 4: Comparison of Instructional Support by Position 91 Figure 5: Comparison of Technical Support by Position 92
List of Tables
Table 1: Important Leadership Characteristics as Indicated by
Percent of Responses of Strongly Agree and Agree 32
Table 2: Leadership Style and Climate 37
Table 3: Number of Items in Each Subcategory 63 Table 4: Reliability of Coefficients for Subscales and Total (N=13) 64
Table 5: Support Action Subscale 65
Table 6: Reliability Coefficients for Subscale and Total 66
Table 7: Teaching Model 73
Table 8: Grade Level Taught Analysis 73
Table 9: Plans for the Next School Year 74
Table 10: Number of Assistant Principals 75
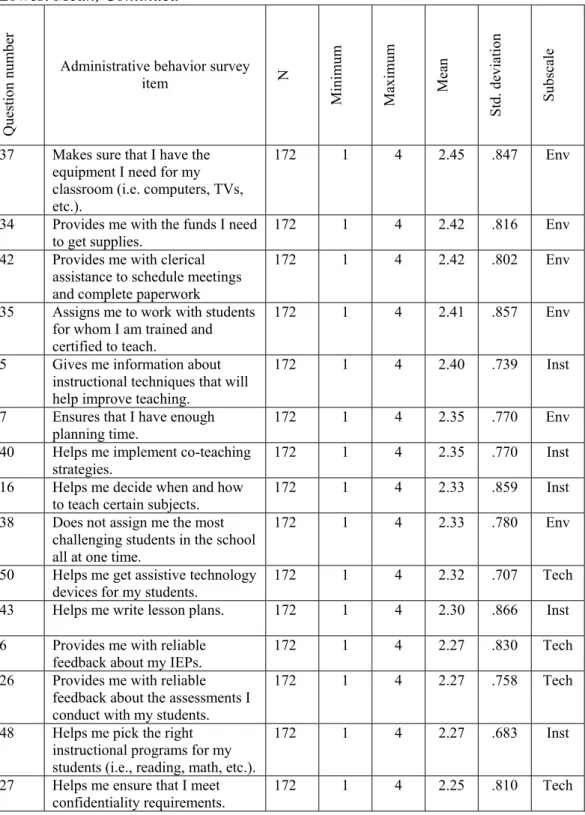
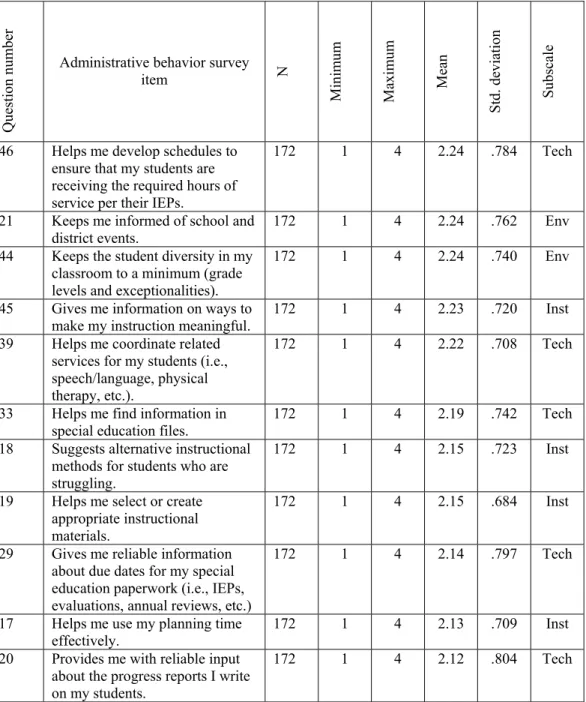
Table 11: Average Score for Each Survey Item, Arranged From Highest Mean to Lowest Mean
78
Table 12: Descriptive Statistics for the Total Score by Position 83 Table 13: Levene’s Test of Equality of Error Variances 84 Table 14: ANOVA Table for Subgroup Mean Scores 86 Table 15: Subscale Items With Minimum and Maximum Scores 87 Table 16: Total Group Scores for Each Subscale 88
Table 17: Teachers' Scores by Subscale 88
Table 19: Comparison of Building Administrators and Special Education Teachers Using the Emotional Subscale
93
Table 20: Comparison of Building Administrators and Special Education Teachers Using the Environmental Subscale
94
Table 21: Comparison of Building Administrators and Special Education Teachers Using the Instructional Subscale
95
Table 22: Comparison of Building Administrators and Special
ACKNOWLEDGMENTS
I would like to thank the following people who provided the impetus and support that helped make this endeavor possible. Thank you to Dr. Kevin Emery for his amazing guidance and support in working with the data and research. He was always available to answer emails, phone calls, and arrange meetings. He helped me to understand what statistical research is all about and how to actually apply it.
Thank you to Mrs. Vickie Kline, my current building administrator who demonstrates all of the administrative supports mentioned in this study. She is exactly the building principal that I want to become. She demonstrates so much caring for everyone that works for her. She makes me want to be a better teacher and be a better person on a daily basis. I truly enjoy working for her.
Thank you to my students, past and present, each of you has touched my life in one way or another. Each of you helps to make me a better educator, whether you realize it or not. Each of you have so many wonderful gifts to give, it is such a shame that more people do not realize your amazing abilities.
Thank you to my parents, who have constantly given me support my entire life. They have always backed me in any endeavor; and have always been there when I needed help of any kind. I am forever indebted to them. I am proud to be their daughter.
A final thank you to my husband and son. I learn so much from both of you every day. The love and respect that I receive from both of you, is more than any person could ever ask for. You both put up with my anxiety attacks and sleepless nights and never complained; I am truly blessed to be loved by both of you.
Chapter 1 Introduction
With the movement for more accountability within education, finding quality educators is a growing concern. According to the National Center for Education Statistics, between 2001 and 2013, the number of teachers in elementary and secondary schools is expected to rise. Schools are having difficulty finding quality educators (National Center for Educational Statistics, 2006). The shortage of educators has been attributed to family discouragement, lack of financial incentives, poor working conditions, competition from other fields, and lack of respect by the students and for the profession (Futrell, 2000). Researchers have offered several solutions to reduce the teacher shortage: increase pay, implement strategic recruiting efforts, offer mentor programs, and increase training programs (Bradley, 1999).
There is also a growing shortage of qualified teachers. The National Center for Education Statistics (2006) estimated that in the United States, more than 12% of all newly hired teachers enter the workforce without any training at all. Though the need for highly qualified educators varies by region and
discipline, this need is especially high in science, math, and special education (Merrow, 1999). The special education teacher shortage and retention problem contains many variables. Attrition, rather than a lack of teacher candidates, is a
major contributing factor to the dwindling supply of educators (Ingersoll, 2002). Researchers have offered many explanations for teacher attrition, including role problems, excessive paperwork, and lack of job satisfaction (Boe, Bobbitt, & Cook, 1997; Boe, Bobbitt, Cook, & Barkanci, 1998; Boe, Cook, Bobbitt, & Weber, 1996; Nichols & Sosnowsky, 2002; Wisniewski & Gargiulo, 1997).
Researchers have also suggested that teachers leave because of low job satisfaction (Boe, Bobbitt, Cook, Whitener, & Weber, 1997; Coleman, 2001; Council for Exceptional Children, 2001; Embich, 2001). According to the National Education Association (2005), teachers leave the profession because they feel overwhelmed by the expectations and the lack of support in the classroom. Only 11% of public school public school teachers were highly satisfied with their positions, as reported by the National Center for Educational Statistics (2006). Teachers most often cited lack of administrative support as a reason for dissatisfaction with their positions (Bruton, 2001; Levine, B., 2001). However, a positive work environment characterized by communication and collaboration with building-level administration reduces special education teacher attrition (Weiss, 2001).
The accumulated research has shown that administrative support is a contributing factor to teacher attrition; therefore, actions that teachers consider valuable should be identified. This study attempted to identify the types of
the administrative supports that special education teachers value with the supports that building administrators perceive as being valuable to special education teachers.
Having such research data can help to create policies and programs to increase the administrative supports identified as valuable. Researchers have directly linked administrative support to teacher job satisfaction and working conditions (Coleman, 2001; Council for Exceptional Children, 2001; Embich, 2001; Gersten, Keating, Yovanoff, & Harniss, 2001). Therefore, increased support may contribute to a reduction in teacher attrition, including special education teacher attrition (Fore, Martin, & Bender, 2002). Building
administrators may not realize exactly what supports special education teachers value and may be focusing their efforts on items that have little value to special educators.
Statement of the Problem
Special education teachers have left in substantial numbers when compared to general education teachers (Boe, Bobbitt, & Cook, 1997; Boe, Bobbitt, Cook, & Barkanci, 1998; Boe, Cook, et al. 1996; Nichols & Sosnowsky, 2002; Wisniewski & Gargiulo, 1997). Attrition in special education accounted for 10% of all educator attrition; nearly double that of general educators who leave
the special education teaching field (Fore et al., 2002). Therefore, viable tactics to retain special education teachers must be developed.
Researchers and practitioners have developed strategies, programs, and incentives to recruit and retain teachers; but if teachers are leaving the field in such numbers, these efforts may be in vain. Using the image of a revolving door, Ingersoll (2002) argued that teacher shortages are not a function of increasing student enrollment but of teacher attrition. Numerous factors, both singly and collectively, have contributed to teacher attrition, including burnout, classroom conditions, lack of administrative support, excessive paperwork, professional isolation, physical exhaustion, challenging student behaviors, role ambiguity, and the diverse instructional needs of the students (Boe, Bobbitt, Cook, 1997;
Coleman, 2001; Council for Exceptional Children, 2001; Embich, 2001; Miller, Brownell, & Smith, 1999).
Although lack of administrative support has been identified as a cause of teacher attrition, according to Weiss (2001), researchers have failed to identify clearly those administrative supports valued by special education educators. Educators need to receive the supports they desire. Balfour (2001) found that special education teachers were not receiving the support they expected from their administrators. Like Weiss, Balfour was unsuccessful in identifying specific support actions valued by special education teachers. Both researchers recommended further examination of support actions that are provided.
In addition, the literature concerning administrative support of special education teachers specific to the perceptions of support that is valued by their administrators is limited (Lund-Glassman, 1999). Likewise, few researchers have investigated differences in the amount of support provided to special education teachers versus the support that building administrators view as important.
Additionally, researchers have not identified support actions perceived as valuable by special education teachers. Studies conducted by Tobias (2000), Geter (1997), and Lund-Glassman (1999) recommended additional research to investigate further the differences between teachers and building administrators. Therefore, this study addressed the different administrative support actions that special education teachers value and compared the administrative supports that special education teachers value with the supports that building administrators perceive as valuable to special education teachers.
Purpose of the Study
Although researchers have identified administrative support as one factor that contributes to job satisfaction, little evidence exists on specific administrative support actions valued by special education educators as compared to the
perceptions of valuable support actions from the building administrators' view. The purpose of this study was to fill a gap in the research that relates to special education teacher attrition by identifying areas of administrative support
perceived as valuable to special education teachers as compared to the supports that building administrators perceive as valuable to special education teachers. Recent studies have failed to identify specific sources of administrative support (Balfour, 2001; Weiss, 2001). Additionally, researchers have not ascertained the specific needs of special education teachers (Balfour, 2001; Sirk, 1999). Because of limited research available in this area, this study was designed to determine any differences between what special education teachers value and what building administrators perceive as valuable regarding the amount of support received and to identify the supports valued by special education educators. Resulting data may illuminate the need to increase or decrease the type of administrative support to special education educators.
Research Questions
Two questions related to the perceived value of administrative support from special education educators were addressed:
1. What types of administrative supports do special education teachers value?
2. Is there a statistically significant difference between the administrative supports that special education teachers value and the supports that building administrators perceive as valuable to special education teachers?
These research questions led to the null hypothesis in this study: There is no statistically significant difference between the administrative supports that special education teachers value and the supports that building administrators perceive as valuable to the special education teachers. The alternate hypothesis was the following: There is a statistically significant difference between the administrative supports that special education teachers value and the supports that building administrators perceive as valuable to the special education teachers.
Statement of Significance
The existing literature indicated researchers have been unable to provide reliable and consistent information on the perceived value of specific
administrative supports or comparisons between special education educators and building administrators regarding the value of administrative support. Lund-Glassman (1999) and Tobias (2000) recommended additional research to investigate these differences further. Additionally, Balfour (2001) and Weiss (2001) recommended further research to identify specific support actions that are perceived as valuable by special education educators. Therefore, a critical
examination of supports should provide valuable information to the field of special education (Balfour, 2001; Weiss, 2001). Theoretically, providing the desired support actions should reduce special education teacher attrition (Kreger,
1999; Weiss, 2001), thus alleviating somewhat the teacher shortage by preserving current personnel.
Results from this study could be utilized to create policies and programs to increase those administrative supports identified as valuable. The retention of qualified teachers should represent a partial solution to the teacher shortage and facilitate school compliance with federal mandates (Ingersoll, 2002).
Additionally, teacher turnover has cost school systems an average of 25% of their annual salary expenses (Gately, n.d.). Increasing valued support actions by administrators could reduce special education educator attrition, assist in compliance with federal regulations, and reduce expenses (Fore et al., 2002). Results could also be used to help design and prepare future building
administrators concerning which types of support special educators perceive as valuable. Building administrators could then focus their efforts on the specific supports of value to the special education educators.
This study was grounded in a theoretical foundation, including current special education law, theories on teacher attrition, and research regarding special education. The following section provides a brief description of this foundation, which is discussed in more detail in the literature review in chapter 2.
Theoretical Foundation
Providing a quality education to every child is a priority in America. Evident by numerous school reform initiatives, Americans desire school reform and educational accountability. The landmark enactment of the Education for all Handicapped Children Act (1975) afforded children with handicapping conditions an equal right to education and held local and state agencies accountable for serving students with disabilities. More recently, the Individuals with Disabilities Education Act (IDEA) of 1990, the 1997 amendments (IDEA 97), and the
reauthorization in 2004 provided schools specific guidelines related to serving students with disabilities. Each piece of educational legislation defined
chronologically and incrementally the provisions afforded to students with disabilities and tied federal funds to compliance.
The No Child Left Behind Act (NCLB) mandated accountability through annual testing, research-based instruction, and placement of a qualified teacher in every classroom. Each mandate exemplified challenges in differing magnitude across the United States that had to be addressed to receive federal funding. In addition, the success of each mandate could be achieved only if school divisions have qualified teachers, defined as teachers who have been certified by the state to teach in a particular subject area.
NCLB required school administrators to ensure that a qualified teacher instructs each student. Thus, as the special education population grew, the
responsibilities of the administrator as educational leader grew as well. However, administrators might not be adequately prepared. Despite spending a large amount of their time on special education-related issues, administrators in a study by Bravenec (1998) perceived themselves as inadequately prepared and expressed the need for further training. In a study by Stanley and Wilcox (1999), a majority of principals expressed the need for formal training in special education, but only 60% indicated they had some type of special education training. Without the appropriate knowledge and ability, administrators were unable to support special education teachers effectively.
The supports that special education teachers value might be significantly different than those that building administrators perceive to be valuable. Various researchers (Balfour, 2001; Bare-Oldham, 1999; Geter, 1997; Lund-Glassman, 1999; Sirk, 1999; Tobias, 2000) have examined the differences between elementary and secondary special education teachers and their perceptions of leadership, school climate, and job satisfaction. Each study revealed differences between elementary and secondary teacher perceptions. Drawing on their own research, Lund-Glassman and Tobias recommended further exploration of differences between special education teachers and building administrators. Identifying the support actions valued by special education teachers may assist administrators in implementing strategies that teachers actually value to increase satisfaction among teachers and, theoretically, to decrease attrition.
Compounding this problem for administrators is an apparent shortage of qualified teachers, particularly special education teachers (Ingersoll, 1999, 2001). According to Ingersoll (2001), the most important problem facing American schools is the shortage of qualified teachers. Unfortunately, school division administrators have reported a lack of qualified teacher applicants, so often positions have been filled by unqualified personnel or left vacant (Center for Personnel Studies in Special Education, 2002). An additional related problem involves teachers qualified to teach one subject but hired to teach out of their fields. In 2003-2004, nearly 47,500 special education positions were filled by uncertified personnel (Center for Personnel Studies in Special Education, 2005).
Additional variables have compounded the shortage of qualified teachers in special education. IDEA 97 clearly defined the procedures for identifying students with disabilities, preventing schools from arbitrarily denying students special education services. This legislative component increased the number of students being identified that, in turn, necessitated more teachers being needed in special education (Ingersoll, 1999). This was only one facet of the
multidimensional problem. Colleges have not been producing enough special education teachers to fill the vacancies (Hirsch, 2001). Students enrolled in teacher preparatory programs have compounded the shortage by choosing not to accept positions in education (Hirsch, 2001). Thus, a commonality among localities has been the shortage of special education teachers.
An additional factor has affected the availability of qualified special education teachers: teacher attrition and turnover (Office of Special Education Programs, 1998). The data on levels of attrition and migration have revealed that special education teachers leave their assignments in far greater numbers than general education teachers (Boe, Bobbitt, & Cook, 1997; Boe, Bobbitt, Cook, & Barkanci, 1998; Boe, Cook, et al., 1996; Nichols & Sosnowsky, 2002;
Wisniewski & Gargiulo, 1997; Zabel & Zabel, 2002). Nationally, 20% of special education educators have left the field, compared to 13% of general education teachers (Boe, Bobbitt, Cook, Whitener, et al., 1997). This phenomenon has been attributed to burnout, poor classroom conditions, lack of administrative support, excessive paperwork, professional isolation, exhaustion from work load, various student behaviors, role ambiguities, and the diverse instructional needs of the students (Boe, Bobbitt, Cook, Whitener, et al., 1997; Coleman, 2001; Council for Exceptional Children, 2001).
Job satisfaction has been one contributing factor to attrition (Ingersoll, 1999). Researchers have linked effective administrative support directly to increased job satisfaction levels and positive perceptions of working conditions (Coleman, 2001; Council for Exceptional Children, 2001; Embich, 2001; Gersten et al., 2001; Morgan, 2000; Sirk, 1999). According to Morgan (2000), job
satisfaction was the most significant predictor of special education teachers’ intent to stay. In turn, most significant to teachers’ job satisfaction was principal support
(Sirk, 1999). Thus, increasing effective administrative support could be theorized as a contributing factor to reducing special education teacher attrition.
There has been ample evidence that administrators play pivotal roles in the teachers’ levels of job satisfaction (Bruton, 2001; Levine, B., 2001). Those
administrators who provided effective support to special education educators have increased the odds of retaining qualified teachers (Sirk, 1999).
Increased support from administrators could diminish teacher attrition and, therefore, teacher shortages (Ingersoll, 2002). Boyer and Gillespie (2000)
identified providing instructional feedback, maintaining communication, allowing for collaboration with peers, playing a role in decision making, and empathizing with teachers as strategies administrators can implement to support teachers. However, the relationship between these variables and the decisions made regarding their profession has been largely unknown.
A gap in the literature exists regarding research identifying specific support actions administrators can implement that are valued by special education teachers. According to the Council for Exceptional Children (2000), most
administrators have not been prepared adequately or do not realize what supports are needed to increase special education educator job satisfaction and thus
increase retention. This lack of knowledge has decreased the probability that administrators can provide effective support or effectively provide the supports that the special education teachers need. After conducting studies on
administrative support, Balfour (2001) and Weiss (2001) recommended additional investigation of effective administration supports.
Summary of the Methodology
This was a comparative study to identify administrative support actions valued by special education teachers. The study sought to compare those administrative supports that special education teachers value with the
administrative supports that building administrators perceive to be valuable. The survey was distributed online through Kansas State University to special
education educators and to building administrators in the state of Kansas. The population pool was a sample of convenience to ensure adequate response numbers. The survey contained questions pertaining to support actions identified as having or lacking value.
The data were collected and analyzed with a univariate analysis of
variance (ANOVA), using the Statistical Package for the Social Services software to determine significant differences between the total mean score and within the four subscales in the surveys.
Delimitations
This study included a random and proportionate sampling of special education educators and building administrators employed in the state of Kansas
during the 2006-2007 school year. Educators and building administrators
employed in private schools were not included in this study. Data were collected during the 2006-2007 school year.
Limitations
This survey was limited to special education educators and building administrators employed full-time in the state of Kansas during the 2006-2007 school year. Results could be generalized only to populations similar to the state of Kansas. In addition, the survey instruments collected the participants'
perceptions at the time the responses were provided (Dawson, 1997); teacher perceptions might change over time. The survey was sent out online through Kansas State University; teachers or building administrators unfamiliar or unable to use the survey system might be unwilling to respond or to complete the survey.
However, the use of an Internet survey increased the credibility of responses (Dillman, 2000), and it was assumed that the participants provided honest answers. Responses were confidential and had no impact on the individual, thus reducing the potential for response bias. It should be noted also that,
according to Doyle (1985), only a relationship between variables can be determined, not a direction of causation for the relationship of the responses. Random assignment did not occur; therefore, any conclusions of cause and effect were less definite but still plausible as there were limited threats to internal
reliability. The survey did not ask for certain specific demographic information, such as: gender, length of service, licensure status, or size of school population. The respondents can not be categorized or evaluated using those demographic factors.
Definitions
The following terms have been defined according to the purpose of this study:
Administrator. This term encompasses the assistant principal or principal within the school building who is responsible for implementing, supervising, and evaluating special education programs (Balfour, 2001).
Attrition. Attrition refers to educators leaving their teaching positions to seek employment elsewhere, including other school divisions, or to retire (Levine, B., 2001).
Elementary special education educator. This term refers to educators responsible for servicing students receiving special education services from kindergarten through Grade 5.
Emotional subscale. The emotional subscale were administrative support behaviors that were based upon feelings and emotions.
Environmental subscale. The environmental subscale were administrative support behaviors that were based upon the school’s physical characteristics.
In-service. Professional development training provided for practicing principals and faculty usually is noted as staff development or in-service.
Instructional subscale. The instructional subscale were administrative support behaviors that were based upon the action, or practice of teaching.
Job satisfaction. The perceived value of various factors attained through completion of roles and tasks within a position (Morgan, 2000).
Qualified teacher. A qualified teacher is one who has been fully licensed or certified by the state and who has not had any certification or licensure requirements waived on an emergency, temporary, or provisional basis (Kansas Department of Education, 2005).
Secondary special education educator. A secondary special education educator is responsible for servicing students in special education within Grades 6-12.
Technical Subscale. The technical subscale were administrative support behaviors that were based upon the mechanics and specifics of the school. Summary
Building-level administrative support is essential to retention of quality teachers (Weiss, 2001). Researchers have revealed that teachers who are not satisfied with administrative support are less satisfied with their roles as special education teachers (Ingersoll, 1999; Sirk, 1999). Teachers who perceived themselves as receiving insufficient administrative support cited this as a
mitigating factor in their decision to leave education (Gersten et al., 2001).
Teachers who perceived receiving higher levels of administrative support reported planning to remain in education (Sirk 1999). In addition to these findings, some researchers have reported that special education teachers and building
administrators may hold differing perceptions on what administrative support is valued (Sirk, 1999).
The literature suggested that administrative support influences the decision of special education teachers to remain in education (Sirk, 1999). This study was designed to identify the administrative supports valued by special education educators and how those compared to what building administrators felt were valuable supports to give to special education teachers. The results could be useful to administrative educators on the college level as well as professional development personnel within the schools to improve the climate and culture of the school and in turn increase the opportunities for teaching and learning.
Chapter 2 of this dissertation presents the literature related to the historical significance of special education, administrative responsibilities, comparisons of perceptions, attrition of special education teachers, and the role of administrative support. Chapter 3 contains an explanation of the survey design and development, methodology, and data collection procedures. Chapters 4 and 5 contain analysis of the data, interpretations of the study results, and implications for practice and future research.
Chapter 2
Review of the Literature
Introduction
Recent legislation, the NCLB (2002), mandates that a qualified teacher teach every child. Securing highly qualified teachers poses a daunting task in an era of teacher shortages. Nationally, researchers have estimated that schools need to hire over 2 million teachers within the next decade (Bradley, 1999). According to Boe and Gilford (1992), there is a great shortage of quality teachers and an even greater shortage of highly qualified teachers. A minimum of 6 out of every 10 students had teachers without the appropriate credentials in science and mathematics during the 2001-2002 school year (National Center for Educational Statistics, 2003). “While the shortage of teachers for most subjects is being felt in pockets across the country, the scarcity of special education teachers is nearly universal” (Bradley, 1999, p. 36). During the 1996-1997 school year, 4,000 special education teaching positions were left vacant; and 33,000 teaching positions were filled by unqualified teachers (Coleman, 2001). Not surprisingly, special education educators have been identified as the most prevalent and pervasive component of the shortage (National Center for Educational Statistics, 2006).
As a result of legal decisions and legislation specifically defining special education, special education populations have soared as has the need for special education teachers. To exacerbate this situation, educators have been leaving the field rapidly, and enrollment in teaching preparation programs has been low (Office of Special Education Programs, 1998). Thus, positions often have been filled by unqualified teachers or left vacant (U. S. Department of Labor, 2005). The shortages have been due partly to the growth of the field over the past 25 years, resulting from increased identification of students following the federal and state mandates for students with disabilities (Zabel & Zabel, 2001). The long-term shortage of qualified special education teachers has continued to mount (U.S. Department of Labor, 2005).
Despite the shortage of teachers, administrators are responsible for ensuring that students receive a quality education by qualified teachers (U.S. Department of Labor, 2005). It has been widely accepted that qualified teachers are necessary ingredients to a quality education. Additionally, IDEA 97 supports the notion that high quality teachers are imperative to ensure a quality education for students with disabilities. However, qualified special education teachers are in short supply. Not only have universities failed to produce the quantity of special education teachers needed, but student enrollment in public school has steadily increased as well. Adding attrition to those factors has only served to intensify the special education teacher shortage (Ingersoll, 2002). Upon review of the research,
Boyer and Gillespie (2000) found an average 9% of special educators leave the field and another 7% resort to teaching regular education.
Attrition or turnover (teachers leaving education or changing positions within education) accounted for an estimated 66%-75% of recently hired teachers in the 2003-2004 school year (U.S. Department of Education, 2005). According to the U.S. Department of Education (2005), barriers associated with retention of quality teachers were lack of opportunities to advance, poor working conditions, lack of respect for the profession, and weak school leadership. The Center for Personnel Studies in Special Education (2005) reported that 14,000 special education educators left the profession all together and over 20,000 special education teachers transferred out of special education during the 2003-2004 school year. Attrition of special education teachers accounted for 10% of all educators (Fore et al., 2002). The factors associated with special education teacher attrition must be examined and understood to increase retention.
Research included in the review of the literature was found using an exhaustive search of the Wilson Omni Database, the ERIC database, research journals, and Digital Dissertations Abstract International. The reference sections of the literature reviewed were scrutinized for additional sources and research.
The following section presents information pertaining to the history of special education and legislative decisions that have affected special education, administrators’ responsibilities within special education, elementary and
secondary teachers and administrators, special education teachers, and administrative support.
Origins of Special Education
Public schools developed in response to social needs, values, and the inequalities of American society. According to Katz, (1987), “Nineteenth-century education promoters…helped to engineer…public education as both the
cornerstone and key agency for the solution of virtually every major social problem” (p. 23). Public education became viewed as a fundamental birthright in America, fomenting a democratic society (Levine, B. 2001). Unfortunately, this birthright was not afforded immediately to children with special needs, who were neglected by public schools (Yell, Rogers, & Rogers, 1998). Students with special needs were denied education despite compulsory attendance laws. As recently as 1969, court rulings upheld states’ rights to deny education to the “feeble minded,” making it illegal for parents to attempt to enroll in school a child who had been excluded previously (Weber, 1992, pg. 32).
Throughout the early 1900s, children with disabilities were educated in separate private or state facilities, while public schools catered to the average child. Advocates for children with disabilities argued that separate institutions did not provide the best environment for their education (Wright & Wright, 2002). The Fourteenth Amendment, providing citizens equal protection under the law, in
combination with the Brown v. Board of Education (1954) ruling, which struck down the premise that separate schooling is equal schooling, provided a platform for special education students and their advocates. This began a litigious journey to provide all students equal educational opportunity, including students with disabilities. Advocacy groups formed; and parents began to challenge the schools’ decisions to deny, limit, or exclude special education students from school and their general education peers (Yell et al., 1998).
This pattern of advocacy for rights of children with special needs persisted until federal legislators passed sweeping reforms in 1975 regarding the education of handicapped children. The Education for All Handicapped Children Act (1975) stated that children with a handicapping condition “have a right to education, and we have a duty to establish a process by which State and local agencies may be held accountable for providing education services for all handicapped children” (Wright & Wright, 2002, p. 1427). Special education was defined as a free, appropriate education with “specifically designed instruction provided by the school district or other local education agency that meets the unique needs of students identified as disabled” (Bursuck & Friend, 2002, p. 2). Finally, special education students were guaranteed legally certain fundamental rights in the most least restrictive environment. Specifically, least restrictive environment required “that to the maximum extent appropriate, children with disabilities, including children in public or private institutions and other care facilities, are educated
with children who are not disabled” (Individuals with Disabilities Act, 1990, §1412 [a] [5]). The Education for All Handicapped Children Act was reauthorized in 1990 as the IDEA, which was reauthorized in 1997 and again in 2004 to
encompass more explicit guidelines.
As opposed to other areas in education where the bulk of policy has been determined at the state and local levels, most, but not all, special education policy has been derived from federal statutes, particularly IDEA (Rotherham, 2002). Each piece of legislation chronologically and incrementally defined the provisions afforded to students with special needs, specifically increasing services to be provided. Finn, Rotherham, and Hokanson (2001) found the following:
Although the federal program was initially intended to address the educational needs of the severely disabled, today approximately 90 percent of special education students have lesser disabilities, such as a specific learning disability, speech and language delays, mild mental retardation, or an emotional disorder. (p. 3)
Initially, broad terms were used to identify students eligible for special education and placement options. IDEA 97 specifically defined terms such as "eligibility" and "Individual Education Plans" (IEP) and identified members of the IEP team, timelines, and even disciplinary procedures. IDEA 97 also addressed the supervision of instruction expressly by a person who “is qualified to provide or supervise the provision of specially designed instruction to meet the unique needs of children with disabilities” (Crabtree, Gartin, & Murdick, 2002, p. 78). Dorn, Fuchs, and Fuchs (1996) noted that special education is not a place but a
service, and increasingly this service is being implemented in the general
education setting. The demand for inclusion, a term used to describe a variety of methods for including special needs students in the regular education setting, has been fueled by the federal mandate to provide special services in the least
restrictive environment (Cronis & Ellis, 2000). Integrating these students within the general education curriculum and setting presented unique challenges for schools.
The most current legislation proposed and signed into law by President George W. Bush paralleled the public’s concern for increased accountability of schools (NCLB, 2002). Provisions of this act mandated that 95% of special needs students must take state standardized tests by the 2013-2014 school year, special needs students must be assessed annually, and qualified teacher must teach all students. “Qualified” was defined as a teacher who has passed “rigorous” state assessments, holds at least a bachelor’s degree, and does not have a license obtained through waivers or provisional certification (Kansas Department of Education, 2005). Special education students and teachers were to be held accountable to the same standards as those in general education. This act indeed added to the already tumultuous history of special education.
Over the years, special education requirements developed to include that students with special needs were to be served through appropriate education plans (IDEA, 1997). In addition, qualified teachers must teach these students. The next
section of the review presents the responsibilities of administration to ensure that each child receives a quality education provided by a qualified teacher.
Administrative Responsibilities
Changing student demographic curricular priorities, along with a mounting shortage of qualified teachers and administrators, have had serious implications for American schools (Boe, Bobbitt, Cook et al., 1997; Tirozzi, 2001). As the educational system evolved, so did the role of building level administrators. School leaders were no longer viewed as managers; instead, they were instructional leaders (Cotton, 2003). Principals who serve as instructional leaders, according to Brigham and Lowe (2000), were the most significant determining factors of effective schools.
“Principals for the 21st century will need the skills necessary to cope with change processes and challenges associated with educating diverse student populations” (Brigham & Lowe, 2000, p. 5). Special education was a part of this change and led the way with a growing population. In 1990, special education services were provided to 4,361,751 students nationally. Ten years later, the 2000 school year, the population grew to 5,683,707 students, a 30% increase (U.S. Department of Education, 2001). Building-level administrators were responsible for not only serving these students but also supervising special education teachers. As discussed earlier, federal mandates outlined rigorous standards and
expectations of special education programming. “The principal’s role is critical to success as public schools strive to meet the challenge of implementing the new IDEA requirements” (Warger, Eavy & Assoc., 2001, p. 1).
In addition, NCLB policy explicitly outlined expectations and
accountability for special education students. Bowling, Marshall, and Patterson (2000) asked, “What should principals know about special education?” (p. 9). They conducted 25 in-depth interviews with 4 principals, 6 central office administrators, 11 current and former special education and classroom teachers, and 4 parents. The respondents indicated that principals should have a basic understanding of special education services, laws, regulations, court cases, funding, local policies, implications, and district policies pertaining to responsibilities; they should also partake in educational advancement in the complex field of special education. Prior studies of administrative programs suggested that minimal preparation exists addressing the special needs population (Bravenec, 1998; Brigham & Lowe, 2001; Kreger, 1999). In addition, the
perceptions of current administrators concerning their level of competence in administrating students with special needs were weak, particularly amid the medley of IDEA regulations (Brigham & Lowe, 2001). Administrators lacking knowledge of special education issues left school systems not only without effective leaders but also without teachers. Without the appropriate knowledge
and ability, how would administrators effectively support special education teachers?
The Council for Exceptional Children (1997) identified 35 key skills as being significant for administrators interacting with students with special needs (Stanlye & Wilcox, 1999). Stanley and Wilcox developed a survey based on these key skills. Respondents indicated their competencies as skilled, adequate, or inadequate. The survey was distributed to a sample of 240 general education administrators, 240 special education directors, and 240 special education teachers and received a return rate of 22%. After employing chi-square tests to determine differences in frequencies, Stanley and Wilcox reported a trend of inadequacy in the perceptions of administrators as they rated themselves against the competencies outlined by the Council for Exceptional Children. In isolation, the results of their survey should be interpreted cautiously because of the low return rate and the reliance on self-reporting of the participants’ competencies (Stanley & Wilcox, 1999). However, the study did support other educational literature that suggested many administrators lack necessary skills needed to serve the special needs population effectively. Without these skills, administrators’ abilities were limited to relate and provide needed support, potentially affecting the support provided to special education teachers. Lack of administrative support could decrease levels of job satisfaction among teachers (Sirk, 1999).
According to Patterson, Marshall, and Bowling (2000), administrators, “must manage intricacies ranging from allocating classroom space, responding to parent concerns, and hiring and assigning special education assistants, to ensuring that grab bars are installed in the bathrooms” (p. 42). Administrators were
confronted with new diverse issues: accountability, conflicts among constituents, the need for collaboration between regular education and special education teachers, and the commingling of other responsibilities (Patterson et al.).
Looking at the critical needs of Texas school principals in relation to special education, Bravenec (1998) focused on the preparation content of
building-level principals. Using a stratified random sampling strategy, Bravenec distributed surveys to 100 elementary and 100 secondary principals and received a total response rate of 70.5%. Data collected through ordinal responses were analyzed using cross-tabulations. Bravenec found that 71.9% of the principals indicated dedicating one fourth of their time to special education-related issues, such as IEP meetings, discipline, supervision, and implementing legal regulations. In addition, 73% of the principals specified being 51% to 100% responsible for evaluation of special education programming, but only 60% of principals agreed or strongly agreed that they were adequately prepared for their position. Based on the responses, the need for more preparatory programs in special education was apparent, with 80% of the respondents agreeing or strongly agreeing with the necessity of more training. Bravenec’s study outlined, in broad areas, the need for
administrative preparatory programs and current training in special education issues.
Administrators needed broad training in special education as well as in specific special education programs. Early childhood special education programs appeared to be in limbo of administrative leadership. According to Kreger (1999), not only did a gap exist in administrative training to facilitate programming effectively, but principals were also unclear as to who was responsible for overseeing these programs. Through her study, Kreger challenged two assumptions: (a) Principals are adequately prepared for special education
administration, and (b) there is no difference in preparation needs between school-age and early-childhood special education teachers.
Kreger (1999) surveyed 319 current elementary school principals in Ohio public schools that served early childhood special educational programs. The survey, with a 56.1% return rate, asked principals to respond to questions
concerning their own competencies in regard to early childhood special education, preparation, and demographic information and added comments on their role as an administrator. The respondents were asked to rank 5 out of 20 areas for
additional training from most important to least important. Using frequency data, principals indicated the need and desire for more training, particularly in legal issues and best practices for effective instruction. In addition, in the comment section of the survey, a predominant number of participants (>50%) indicated
their need for further training: “I believe that preparation programs should include courses in special education and early childhood” (p. 75). Because the focus of her study was on early childhood special education administrators, the results could not be generalized to elementary and secondary special education administrators.
Administrative leadership was essential for effectively implementing quality special education practices. Morton (2000) conducted a study of a Baltimore, Maryland, school system, analyzing the characteristics of effective school leaders for inclusive practices in special education. A survey was distributed within Baltimore Public Schools to all special education teachers (N=683). With 37% (n=118) of elementary teachers, 32% (n=68) of middle school teachers, and 27% (n=43) of high school teachers responding, a total return rate of 33.5% (N=229) was produced. Special education teachers rated
administrative characteristics they perceived as imperative to being a valuable leader from strongly disagree (1) to strongly agree (6). Morton found that educational leaders (a) are effective when they have knowledge of the special education field (64% strongly agree, 27% agree, 91% total), (b) are supportive of practices (80% strongly agree, 15% agree, 95% total), and (c) are caring (72% strongly agree, 22% agree, 94% total). When comparing frequency distributions, Morton observed subtle differences between the frequencies of strongly agree and agree totals between elementary, middle, and high school teachers (see Table 1).
Morton identified no differences among desired leadership characteristics and grade level taught. However, this statement could be unfounded as he failed to investigate statistically significant relationships between the grade levels; he simply compared frequency data totals. Identifying relationships within the data could determine if statistically significant differences between grade levels exist regarding desired leadership characteristics. There was no indication of statistical analysis for significant relationships in Morton’s research.
Table 1
Important Leadership Characteristics as Indicated by Percent of Responses of Strongly Agree and Agree
P
Agreement Elementary Middle High school
Support 95 97 93
Knowledge 91 87 83
Care 94 94 93
Note. From Characteristics of Principal as a Leader as Perceived by Teachers of Special Education pg. 76, by C. S. Morton, 2000, University of Toledo.
The study (Morton, 2000) identified the amount of agreement toward characteristics perceived as important qualities of leader principals but fell short in identifying the current status of administrators' skills in Baltimore. However,
Morton’s results should be interpreted cautiously, given the limited population size, limited sample area, and low return rate.
In another study, Nardone (1999) hypothesized that administrators in the El Paso Independent School District, El Paso, Texas, did not have an adequate knowledge base of special education. He collected data from 157 elementary and secondary principals and assistant principals, with an overall return rate of 83.5%. Using frequency distribution, he found that 98.1% of the sampled population had received some type of training in special education, but only 7.6% had a degree in special education. Nardone’s findings also indicated no statistically significant increase in knowledge regardless of experience, education, or training. In the knowledge section of the questionnaire, 68% scored below the mastery level of 70%. Nardone interpreted these results as “frightening” for students in special education, leaving the school system vulnerable to litigation for failing to accurately facilitate legally mandated special education practices, pg 3.
Administrators who are prepared inadequately would be equally unprepared to meet the support needs of special education teachers (Littrell, Billingsley, & Cross, 1994). The data were not analyzed for differences between elementary and secondary administrators’ knowledge; however, Nardone did recommend further research to determine if differences exist between grade levels.
An administrator’s lack of knowledge in the field of special education left both the school system and the teachers vulnerable. Researchers indicated that
knowledgeable, supportive principals increased the likelihood that special educators would remain in the field (Littrell et al., 1994; Miller et al., 1999). A supportive principal, in fact, was an incentive for these teachers to remain in the field. Insufficient principal support was a significant reason for special education teachers’ exiting the field (Gersten et al., 2001).
Without an adequate knowledge base, principals might lack the skills necessary to provide support to teachers. Principals must have knowledge about special education and a basic understanding of special education services, among other areas (Bowling et al., 2000). Researchers demonstrated that administrators not only lack this critical basic knowledge (Nardone, 1999; Stanley & Wilson, 1999) but also desire more training to gain necessary skills (Kreger, 1999).
Based upon the review of available studies, it seemed reasonable to ascertain that administrators need direction to meet effectively the needs of special education teachers. With a growing population of students in special education and rising teacher attrition rates, knowledgeable administrators capable of providing effective supports were needed more than ever (Ingersoll, 2001). Compounding a documented deficit in administrator knowledge regarding special education, little research existed to guide administrators in the different needs of elementary and secondary teachers.
Bare-Oldham (1999) investigated the relationship between administrative leadership styles and teacher job satisfaction. She randomly surveyed 250
elementary and 250 secondary teachers in Kentucky. She obtained a 56% return rate overall (elementary, 53%, n=142; secondary, 47%, n=128). Bare-Oldham used two survey instruments to measure leadership styles and job satisfaction. Answers were elicited through a Likert-type scale. Comparing the norm means on teacher job satisfaction, with scores of 1-3 being low and scores of 4-6 being high, Bare-Oldham found that the sample appeared to have moderately high job
satisfaction (M=4.35). These results would indicate the need to investigate elementary and secondary teachers as separate groups with separate needs from their leaders. Although these descriptive statistics indicated a difference for these two samples, no statistical tests were utilized to test for this to be true in the population. Bare-Oldham used descriptive statistics, comparing means, to decipher the differences. The results of her findings in respect to differences between elementary and secondary teachers should be viewed very cautiously as no statistical significance was found.
Researching school climate, Tobias (2000) sought to investigate if there were differences among teachers’ perceptions of their principals and their perceptions of school climate. He self-selected 18 elementary, 5 middle, and 5 high schools in which to survey teachers. He sent 400 surveys to teachers within these schools and achieved a total return rate of 49% (N=195). The return rate of each group was not reported. This would make any results about grade-level comparisons suspect as the data reflected an insufficient sample size. The teachers
rated both their satisfaction with leadership and their perceptions of the building climate. The responses were elicited through a Likert-type scale; 1 indicated strong agreement and 5 indicated strong disagreement.
Tobias’s (2000) results indicated statistically significant differences between elementary, middle, and high school teachers in both their perceptions of leadership and climate (Table 2). Although Tobias’s study provided interesting and needed comparisons of elementary and secondary teacher perceptions, his conclusions must be accepted with caution. Not only was his return rate less than 50%, but he also failed to report the return rate of the subgroups separately. Differences within the numbers of these groups were not indicated. Additionally, information needed to evaluate the statistical tests he implemented were absent from his document. He recommended further research to investigate the
differences between elementary, middle, and high school leadership as well as climate variables.
In 1997, Geter sought to examine critically principal attitudes toward inclusion. Using random sampling, he surveyed 550 principals in the state of Georgia, yielding 351 responses (elementary, 60%, n=205; and high school, 40%, n=134). A secondary question of his research pertained to the differences in attitudes toward inclusion between elementary and high school principals. The survey instrument consisted of four subgroupings of questions on inclusive
had 8 questions (Cronbach alpha, .9119), inclusion had 4 questions (Cronbach alpha, .8537), traditional limiting disabilities had 5 questions (Cronbach alpha, .6821), and classroom factors had 7 questions (Cronbach alpha, .7116).
Table 2
Leadership Style and Climate
Region Leadership total Climate total
Elementary 28.9 25.7
Middle 36.2 29.8
High school 35.1 32.9
Statistical significancea F=8.46, p<.0004 F=15.14, p<.0001
Note. adf and post hoc tests were not reported by the author. From Leadership and
School Climate: Teachers’ Perceptions pg. 91, by G. Tobias, 2000, St. Louis, MO: Saint Louis University.
In Geter’s (1997) study, the only significant difference among the subgroups between elementary and high school principals was the inclusion category itself (p=.003). This category measured the principal’s perceptions of which students should participate in inclusive programs. Findings revealed that, overall, elementary principals were more positive toward inclusion than were high school principals. Although the survey was deemed valid and reliable through statistical tests, Geter provided no supporting documentation for the development of the questions. The limited and varied number of questions in each subgroup
might have distorted the results (Huck, 2000). The area that produced findings of significant differences only had four questions. Increasing the questions in each subgroup would render more reliable results, yet .85 is considered respectable.
In examining communication styles, Lund-Glassman (1999) sought to identify communication styles of principals and their relationship to school climate. She surveyed teachers in eight school districts, a total of 68 schools (46 elementary and 22 secondary) in the states of Washington and Oregon. Of the 2,320 surveys sent, 86% were returned; but of those returned, only 65% (1,521 teachers and 68 principals) were completed adequately enough to utilize. The secondary teachers completed a survey designed for assessing the climate of a secondary setting. (Junior high schools were included in this group.) The elementary teachers completed a different survey designed for assessing the climate of the elementary setting. (Middle schools were included in this group.) The teachers’ responses from each school were calculated, and a total score was established on a scale of 1 (low climate) to 4 (high climate) for each school. These numbers were then correlated with different variables. A predominate variable, communication style, was correlated by utilizing an additional survey, with all subgroups completing the same instrument. The sample rated their leaders'
communication style as a careful transmitter (1), frank (2), informal (3), a careful listener (4), and an open/two-way communicator (5).
A chi-square indicated significant differences between the communication style (X2=5.2750, p=.02) of elementary and secondary principals. Additionally, Lund-Glassman (1999) made comparisons using descriptive means and reported that secondary principals were rated more often as careful listeners and careful transmitters, whereas elementary principals were rated more often as frank and open/two-way communicators. No statistical significance was apparent
concerning the climates of the elementary and secondary schools; it would be inappropriate to make comparisons in this study based on descriptive statistics. Lund-Glassman (1999) indicated that differences exist in the
communication styles of elementary and secondary principals. Regrettably, the study contained a number of methodological flaws. The utilization of two different instruments to measure the communication styles of elementary and secondary principals rendered the correlation results vulnerable to skepticism. In addition, Lund-Glassman failed to report the response rate of secondary teachers and elementary teachers separately. Finally, the sample was based on
convenience, limiting the ability to generalize the results. Lund-Glassman recommended further research to determine differences in the communication styles of elementary, middle, and high school principals.
The studies reviewed presented evidence of differences between teachers and administrators (Bare-Oldham, 1999; Geter, 1997; Lund-Glassman, 1999; Tobias, 2000). The research findings varied in the amount and significance of the
differences between the elementary and secondary levels. Lund-Glassman found significant differences in the communication styles of elementary and secondary principals. If these results were accepted, it could be theorized that administrators interact differently based on the level they are serving. Lund-Glassman and Tobias recommended further research in the differences between elementary and secondary levels.
Special education teachers have been subjected to the same concerns of differing needs. Deciphering the different needs of special education teachers could assist in providing more effective administrative support, thereby reducing attrition rates. The next section of the literature review examines more specifically the needs of special education teachers.
Special Education Teachers
The growing shortage of qualified special educators poses a tremendous problem to school divisions in the delivery of special education services
(Wisnieski & Gargiulo, 1997). Teachers play a pivotal role in student success. According to Finn et al. (2001) and Kanstoroom and Finn (1999), students are more successful when taught by competent, certified teachers who are teaching in their certified content areas. This section presents research on the needs of
qualified special education teachers. Additionally, information is presented on teacher attrition and its effects on school systems.