Best Practice Document
Splunk Log Management
Version / date: V1.1 / 02-‐03-‐2016 Original language: Serbian
Original title: “Splunk log menadžment“ Original version / date: Version 1.0 / 10-‐02-‐2016
Contact: [email protected], [email protected], [email protected] AMRES is responsible for the contents of this document. The document was developed by the AMRES-led Network Monitoring working group.
Parts of the report may be freely copied, unaltered, provided that the original source is acknowledged and copyright preserved.
The research leading to these results has received funding from the European Union’s Horizon 2020 research and innovation programme under Grant Agreement No. 691567 (GN4-‐1).
Executive Summary
1
1
Log management
2
2
Generating and collecting log messages
4
2.1
Basic
configuration
of
the
syslogl ng
software
for
the
needs
of
the
eduroam service
4
2.2
RADIUS log messages
6
3
Splunk software
8
3.1
Splunk Software installation
8
3.2
Splunk Software configuration
9
3.3
Splunk fields
13
4
Log data analysis
17
4.1
Splunk search, selection, and displaying of log messages
19
4.2
Reports and panels
20
4.3
Analysis of the eduroam service in AMRES
22
5
Conclusions
24
Appendix A
26
A.1
All users
26
A.1.1
Dashboard panels
26
A.1.2
Dashboard in the XML format
27
A.2
AMRES users
29
A.2.1
Dashboard panels
29
A.2.2
Dashboard in the XML format
31
A.3
Use per institution
35
A.3.1
Dashboard panels
35
A.3.2
Dashboard in the XML format
36
A.5
Foreign users
45
A.5.1
Dashboard panels
45
A.5.2
Dashboard in the XML format
46
References
49
Glossary
50
Table of Figures
Figure 2.1: Procedure of log messages generating and collecting for the eduroam
scenario
5
Figure 3.1: The Splunk web application home page view
9
Figure 3.2: Procedure of specifying the port in the process of the Splunk web application
configuration
10
Figure 3.3: Procedure of specifying of the log messages sourcetype in the process of the
Splunk web application configuration
11
Figure 3.4 View of selected options in the process of the Splunk web application
configuration
12
Figure 3.5. Home page of the Splunk web application after the configuration
12
Figure 3.6. View of all log messages of the selected host
13
Figure 3.7. Selection of an event sample as the starting step of a new field selection 14
Figure 3.8. Procedure of defining the name of a new field
15
Figure 3.9. Validation and view of the newly created field values
15
Figure 3.10. A view of selected parameters in the process of a new field selection
16
Figure 4.1. View of the Splunk web application home page
17
Figure 4.2. View of all log messages of the host specified in the search field
18
Figure 4.3. Example of the use of SPL for search.
19
Figure 4.4. Example of the graphic presentation of data obtained by search
20
Figure 4.5. Example of a
Dashboard
of the Splunk web application
21
Executive Summary
Log messages are automatically documented events in the form of chronological records containing
different information about the IT system and the network. Log message management is of huge
importance for every NREN and enables efficient and quality analysis of the service functioning and
usage, as well as the network as a whole. Furthermore, a possibility for fast and simple search of a
number of generated log messages, troubleshooting and selection of esential data for future
reference is of great importance. The Splunk Log Management Software is a comprehensive tool that
enables collection and browsing of a large number of log messages of different types, creation of
dynamic reports, and graphic presentation of the desired results. This paper considers and explains in
detail the processes of collecting and analysing the eduroam service log messages, and gives examples
of the Splunk web application usage in displaying and analysing the service statistics and end user
behavior.
1
Log management
The log file management is a complex process aimed at generating, transmitting, storing, and then
analysing a large amount of data within the information system
[1].
Log files consist of chronological
records that contain different information and automatically documented events in the system and
the network themselves. Initially, logs were used for identification of security incidents and resolution
of problems, and nowadays, they have a lot of additional and equally important functions. They are
used for optimisation of the service and network performance, monitoring of the user behaviour, and
generation of data useful for research and analysis of their activities.
The growth of the number, scope, and diversity of logs is followed with the increase of the need for
log message management. Log file management is a key segment of protection and maintenance of
the functioning of the service and network. Capacity for collection of different log messages from
several sources at one place as well as their automatic browsing and analysis are of enormous
importance for any IT surroundings. A number of tools and software ensure fast and successful
problem analysis and prompt effect and action without necessity for manual collection, organisation,
and browsing of a huge amount of data. Using these opportunities and functionalities, an organisation
can maintain the network and services in a very efficient way.
Different log records carry information of different importance in specific situations. Therefore, there
are typical logs that carry primary detailed information for any of them. Others carry additional, less
important information, which can be helpful when analysing events obtained from the primary logs.
NREN (National Research and Education Network) has multiple benefits from the log collection and
management process. In this manner, keeping of all details in the form of records for a certain time
period is enabled. Routine reviews and analysis of logs are crucial for the identification of incidents,
problems in the functioning of the network and service, and their troubleshooting. Furthermore, they
may have a major role in the analysis of end user behaviour, and may be a part of internal research
and establishment of the bases and identification of operational trends and long-‐term problems
[1,
2].
The paper describes management of logs within AMRES NREN, which monitor services and
applications in the AMRES (Academic Network of Serbia) network. AMRES monitors the operation and
use of several services, and implementation and functioning of the Splunk Log Management Software
has been considered in terms of eduroam service. Chapter
Error! Reference source not found.
escribes the way in which logs are generated, and gives a view of the basic configuration of the syslog-‐
ng protocol. Installation of the Splunk application and configuration for collecting log messages are
considered in Chapter 3. Additionally, adjustment of the way fields are displayed in for various types
browsing, displaying and analysing the selected results are described in Chapter 4. Examples of the
use of this tool in the analysis of end user behaviour of the eduroam service in AMRES are also given.
2
Generating and collecting log messages
The infrastructure of log record management encompasses hardware, software, network and devices
that are used for their generating, collecting, storing, analysis, and use
[1].
This term also includes
several functionalities that represent an addition to previously noted processes. Some of them are
also log parsing (extracting of data from the log so that the parsed values can be used as inputs for
other log processes). The process of collection and storage implies reduction, compression,
conversion, archiving of logs, and rotation of log files according to a certain schedule and verification
of their integrity. The final step is log analysis. Log analysis consists of records mapping from one or
more sources (based on the IP address, DNS name, event type, etc.), log display, and creation of
reports.
There are various ways of log generating and collecting. In accordance with the safety policy of NREN,
some software that implements the syslog protocol may be prohibitted. In AMRES, for the needs of
monitoring the operation of some services of importance, all three software variants that are available
for Linux platform are used:
•
syslog;
•
syslog-‐ng;
•
rsyslog.
2.1
Basic configuration of the syslog-‐ng software for the
needs of the eduroam service
Logs for three services: IP telephony, eduroam, and federation of identity (iAMRES) are sent to the
Splunk server. Although it was not planned that each service uses separate software, such division
eventually occurred in accordance with the needs. Logs generated by the Asterisk service are sent for
the IP telephony (using the syslog software
[3]
). Log messages contain information such as duration
of a call, identifier of the calling user, and the called user, etc.
The f Identity Federation is in its pilot-‐phase, therefore the goal is to collect statistics of the use of
some web services available within iAMRES. What was the extent of the use of a service can be
concluded based on the log messages which, besides the name of the web service, contain user name
and data on whether the user has given their consent for sending of data. Splunk receives these
As one of the most important services, eduroam also requires sending of most detailed log messages
using the syslog-‐ng software
[5]
. Based on the log messages, corresponding statistics of the use are
generated on the Splunk server. Messages that are sent are obtained as a result of an authentication
attempt, and are generated by RADIUS
daemon.
Detailed explanation of all messages and individual
parameters from those messages is given in Chapter 2.2.
The procedure of generating and sending logs differs depending on the service monitored. As this
document is focused on analysis of log messages of the eduroam service, Figure 2.1 shows the way of
communicaton among systemic components that are located on the same server (RADIUS server,
syslog-‐ng
daemon
) and the remote Splunk server.
Figure 2.1: Procedure of log messages generating and collecting for the eduroam scenario
More advanced configuration parameters of the syslog-‐ng service will be described in more detail in
AMRES BPD “Deployment of syslog monitoring.” The fundamental level of configuration is based on
three components:
•
source;
•
destination and
•
log section.
source s_local { system(); internal(); }; destination d_test_splunk { udp("ip.add.re.ss" port(514)); }; log { source(s_local); destination(d_test_splunk); };
The location in which this file is located on the server depends on the way of software installation. In
this document, syslog-‐ng is installed from source, so the full path to the configuration file is
/usr/local/etc/
. A part that represents the default UDP port for the syslog protocol is denoted
in the configuration, and log sending to a remote location is enabled through such port.
2.2
RADIUS log messages
The FTLR server is a RADIUS server through which authentication requests pass during an attempt to
connect to eduroam. These authentication requirements can derive from users in the AMRES network,
as well as from foreign users. The AMRES FTLR (Federation Top-‐Level RADIUS) servers are using the
FreeRADIUS software
[6]
. According to the initial configuration, this software records all
authentication requests in the
radius.log
file. The result of authentication can be a “Login OK” or
“Login incorrect” message. With the use of the FreeRADIUS linelog module, these messages are
rewritten so as to be compliant with the RADIUS RFC 2865 recommendation
[7]
, and for unsuccessful
authentication, they have the value “Access-‐Reject”, whereas they have the value “Access-‐Accept” for
successful authentication. An example of configuration of the linelog module is given below:
linelog splunk {
filename = syslog format = ""
reference = "%{%{reply:Packet-Type}:-format}"
Access-Accept ="Access-Accept: IdP=%{tolower:%{Realm}}
MAC=%{Calling-Station-Id} AP=%{Called-Station-Id} RP=%{Operator-Name}" Access-Reject ="Access-Reject: IdP=%{tolower:%{Realm}}
MAC=%{Calling-Station-Id} AP=%{Called-Station-Id} RP=%{Operator-Name}"
This data is then sent to the syslog-‐ng software, which filters, rewrites, and directs log messages to
the remote Splunk server. The attribute “Called-‐Station-‐ID” is in the
Base Radio MAC:SSID
format (e.g.
00-‐00-‐00-‐00-‐00-‐00:eduroam), which is not understandable sufficiently. To obtain a recognisable value
for AP, the attribute “Called-‐Station-‐ID” in the AP part of the message, the rewrite section of the
syslog-‐ng software is used, by which this attribute is rewritten in a format that relates to the AP
location (e.g. cisco1142-‐rcub-‐studenjak5).
Jan 28 15:37:21 ftlr1 radiusd[31369]: Access-Accept: IdP=etf.bg.ac.rs MAC=48-50-73-f2-80-5c AP=cisco1142-rcub-studenjak5 RP=1rcub.bg.ac.rs
The RADIUS log message consists of the following data:
•
Access-‐Accept/Access-‐Reject – authentication result;
•
IdP – domain of the institution;
•
MAC – MAC address of the user device;
•
AP – string based on which the location of AP is determined;
3
Splunk software
To collect and analyse log messages, AMRES uses the Splunk software. Splunk is a comprehensive tool
that enables browsing of a large number of log messages of different types, creation of dynamic
reports and graphic display of the desired results. Of special importance is the search language, which
makes it possible to make quality analysis and resolution of problems, which ensures time savings in
cases where prompt report drafting is necessary
[8]
.
Although limitation of 500 MB of indexed data per day seems too low, experience within AMRES has
shown that Splunk light free version is more than a sufficient tool that enables administrators to collect
and search through logs from different sources, monitor the service and the behaviour of end users in
a fast and efficient manner. The deficiency of this software version is impossibility of accessing the
web application through external authentication sources, because it allows only one administrator
account. Additionally, creation of rules based on which email notifications are sent in case of
unwanted behaviour of the service monitored is not possible.
3.1
Splunk Software installation
The Splunk Light installation package
[9]
is available for the Windows, Linux, and Mac operating
systems. AMRES uses this software on the Linux platform.
After the Splunk-‐light rpm package is downloaded, the package is installed with the following
command:
rpm -ivh splunklight-6.2.5-272645-linux-2.6-x86_64.rpm
After the successful installation, the software should be started. Therefore, the following is entered
within the
/opt/splunk/bin
directory through the command line:
./splunk start --accept-license
To have Splunk started automatically at any time, the following command should be entered within
the same directory:
./splunk enable boot-start
3.2
Splunk Software configuration
Splunk enables collection of log messages from several different sources. Chapter 2.1 describes the
syslog protocol, using data from a remote location which is sent to the Splunk server. To make indexing
of these log messages and then the search possible, it is necessary to configure the Splunk web
application to accept logs from the desired location.
After the user logs on to the web application, the page from Figure 3.1 is shown. Clicking on the button
“Add Data” opens a new page.
Figure 3.1: The Splunk web application home page view
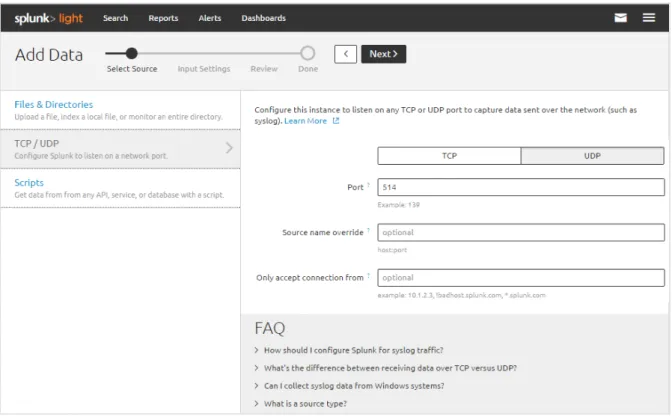
Afterwards, selection of the option “Monitor” opens the menu within which the first step is setting of
the sources of log messages sent towards the Splunk server. To enable the Splunk server to receive
log messages from remote servers, setting of the standard port for the syslog protocol is necessary.
As confirmation of the received datagrams is not necessary, syslog uses the UDP port 514. These
options should be selected when entering data on the remote syslog server, as shown in Figure 3.2.
Receipt of logs on the Splunk server from the syslog port can be limited to:
•
one or more IP addresses;
•
one or more hosts, based on the DNS name.
In case it is necessary to allow/deny Splunk to accept connection by the UDP port 514 of the certain
Figure 3.2: Procedure of specifying the port in the process of the Splunk web application configuration
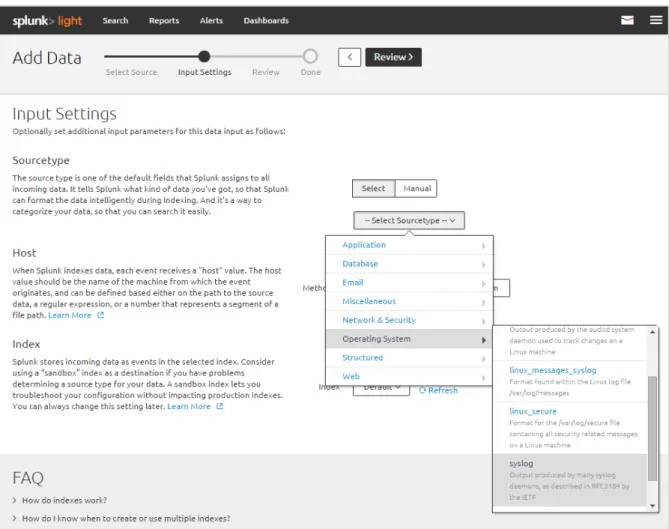
In the next step, the type of software generating log messages is selected. Predefined types such as
Java, mail server, web server, operating systems, etc., exist on the Splunk application. As syslog-‐ng
software is used in AMRES for the monitoring of the eduroam service, the syslog type is selected as
an example of the configuration shown in Figure 3.3. The “host” field for an event can be the IP
address, the hostname, or the DNS name of the server. The hostname and DNS name mainly represent
the same parameter of the server. If Splunk is on the same server that generates log messages, use of
the hostname is recommended.
Figure 3.3: Procedure of specifying of the log messages sourcetype in the process of the Splunk web application configuration
Figure 3.4 View of selected options in the process of the Splunk web application configuration
Upon the completed configuration, the home page displays all hosts from which log messages are sent
on to the Splunk server (Figure 3.5).
3.3
Splunk fields
By clicking on the desired host, the screen displays all log messages that match the defined criteria:
source, sourcetype (Figure 3.6). As it can be seen, fields that can be classified in two categories are
selected on the left:
•
Numerical fields represented with the character “#”;
•
String fields represented with the character “a”.
Figure 3.6. View of all log messages of the selected host
The fields are the constituent part of records about an event. They are the
key=value
pairs that
describe the event itself. The process of their recognising and selecting can be automatic for certain
basic fields, whereas for others, a procedure of additional selection is possible
[10]
. When a field
appears in the record of events without key values, Splunk uses the rules based on regular expressions
so that the field is selected and completed. This functionality is of great importance for the selection
of a field in the non-‐structured records of events, where the events themselves can be shown by
different patterns. Based on the part of the log message that is selected (i.e. form), Splunk generates
a regular expression that encompasses all data of similar characteristics. Splunk provides a possibility
for its verification as well as for manual creation of regular expressions for advanced users.
As it has been noted, Figure 3.6 shows on the left automatically selected fields. The view of the record
of events within the eduroam service shows that the data
Access-‐Accept
and
Access-‐Reject
is not
defined in the key=value format. To have them shown as parameters, additional selection of a relevant
field is necessary. In the left bottom corner, clicking on the option “Extract New Field” starts selecting
a new field from non-‐structured data. This first step is shown in Figure 3.7. In this phase, a selection
of a event record sample is required.
Figure 3.7. Selection of an event sample as the starting step of a new field selection
As it is seen in Figure 3.8, the desired value for which it is necessary to define the name of the field,
“Field Name” is noted. In this way, Splunk creates a regular expression that denotes similar events and
selects a field. As one criterion of the analysis of use of the eduroam service, AMRES monitors the
number of successful (
Access-‐Accept
) and failed (
Access-‐Reject
) authentications. Hence, for this
application, the aforementioned values are assigned the field name
auth
.
Figure 3.8. Procedure of defining the name of a new field
Based on the previously defined field name, a view of the created field and its values, on the sample
of 1000 log messages is given (Figure 3.9). Splunk shows values of the field expressed in the sum
(
Count
) or in percentage (
%
).
Figure 3.9. Validation and view of the newly created field values
At the end of the procedure, a log message selected for sample based on which the field was created
is shown. The previous settings and the regular expression that encompasses all values for the field
4
Log data analysis
The home page of the Splunk web application shows the DNS names for all hosts which are defined as
those which will send log messages onto the Splunk server. This page is the starting point during any
logging on to Splunk, and the final point after the completion of configuration. Besides the domain
names of hosts, the total number of log messages for each host and the moment of receipt of the last
log are shown, which can be seen in Figure 4.1. Data which represents the moment when last log
message was received can be a good tool for diagnosis in cases where it is necessary to establish
whether there is communication between the Splunk server and the remote server on which log
messages are generated.
Figure 4.1. View of the Splunk web application home page
Clicking on the host in the home page opens a new view with Figure 4.2. This group of log messages is
defined only with one parameter in the search field
host=“ftlr1.amres.ac.rs“
. The Splunk web
Figure 4.2. View of all log messages of the host specified in the search field
The desired log messages are selected with the use of the Search Processing Language (SPL).
Commands, arguments, and functions of this language are entered in the search field. Search can
select events directly from the indexed data, e.g. verification of errors and analysis of safety problems.
Furthermore, this language can be also used for statistic calculations over a certain group of log
messages. In this manner the first search that selects events is realised and then one or more
commands for the search are applied. Such a type of search mainly requires specification of a field
and use of at least one command for the display of statistics
[11]
. As the use of the application has
been considered with the example of the eduroam service, the paper describes monitoring and
analysis of the eduroam service as well as a view of usage statistics. Figure 4.3 shows an example of a
search which results in a total number of different successfully authenticated MAC addresses in Serbia.
Figure 4.3. Example of the use of SPL for search.
4.1
Splunk search, selection, and displaying of log
messages
Clicking on one of the hosts at the home page shows log messages, depending on the selected time
interval on the right side of the search field. If there is a need to monitor real-‐time log messages, an
option that refreshes the view on every 30 seconds or every minute can be selected. Statistics of use
of a service can be best displayed if log messages are collected in a longer time interval. In the Splunk
web application, there are predefined options (e.g. “All time”) that enable simple creation of reports.
Moreover, a time period that gives a smaller sample of log messages as a result can be defined (e.g.
“Date & Time Range”), which makes analysis easier.
As it is seen in Figure 4.3, the result of the search is given in the tab “Statistics.” Besides the numerical
display of received results, Splunk offers a possibility for graphic presentation, the forms of which are
given in Figure 4.4 within the “Visualisation” tab. To make this option functional, the search command
must contain the timechart option. The “Format” tab enables finer setting of the view and differs
depending on the selected option.
Figure 4.4. Example of the graphic presentation of data obtained by search
4.2
Reports and panels
Search within the Splunk web application enables detailed analysis of log messages and facilitates
monitoring of performance and use of the service. Any created search can be kept as a report, for
further reference. The kept reports can then be changed. Installation of the application automatically
generates five reports:
•
Errors in the last 24 hours;
•
Errors in the last hour;
•
Licence Usage Data Cube;
•
Messages by minute last 3 hours;
•
Splunk errors last 24 hours.
Furthermore, a Dashboard panel can be created from every search as well as from every report.
Dashboard within the Splunk application is a common overview of created reports or searches, which
can be in different formats.
Splunk is of great importance for the eduroam service usage monitoring. The search language and the
graphic view of the received data offer a number of possibilities for selection and display of desired
data. AMRES monitors a number of parameters important for eduroam, which can be divided into five
•
All users;
•
AMRES users;
•
use by institution;
•
use by location;
•
foreign users.
Dashboard
has been created for these important groups of information. Any Dashboard consists of
panels created from the search or the report made. An example of a Dashboard is shown in Figure 4.5.
Figure 4.5. Example of a Dashboard of the Splunk web application
Another useful functionality of the Splunk application is export of the received results. Splunk offers
an option for generating of documents in the PDF, CSV, XML, and JSON format, which significantly
facilitates, and at the same time increases the quality of analysis of the received information.
4.3
Analysis of the eduroam service in AMRES
AMRES monitors and selects data from log messages and generates statistics about different aspects
of use of the eduroam service. Thus, each of the previously stated Dashboards consists of a higher
number of panels.
Dashboard can be also created in an XML format. The Splunk Light version does not offer a possibility
of entry of the XML code directly through the application. In this case, it is necessary to enter files
directly into the
/opt/splunk/etc/users/admin/search/local/data/ui/views
directory on the server. At the end of the paper, the part Appendix A gives all Dashboards in the XML
format, as well as searches for every panel with which AMRES monitors this service.
NOTE:
The Splunk Software version that is currently used in the AMRES production differs from the
version shown in the document, so therefore, some functionalities are different, such as for example
the XML syntax for the graphic representation of the collected logs
[12]
. In earlier versions, the
FlashChart is implied, whereas a newer version uses JSChart.
The “All users” Dashboard shows data selected with the following panels:
•
Total number of different successfully authenticated MAC addresses;
•
Total number of different successfully authenticated IdPs;
•
Number of different MACs successfully authenticated per IdP;
•
Number of requests per IdP;
•
Use per location;
•
Use per AP;
•
Use per RP.
The “AMRES users” Dashboard includes the following panels:
•
Total number of different successfully authenticated MAC addresses in Serbia;
•
Total number of different successfully authenticated MAC addresses in the world;
•
Total number of different successfully authenticated MAC addresses in total;
•
Total number of different successfully authenticated IdPs in Serbia;
•
Total number of different successfully authenticated IdPs in the world;
•
Total number of different successfully authenticated IdPs in total;
•
Number of different MACs successfully authenticated per IdP in Serbia;
•
Number of different MACs successfully authenticated per IdP in the world;
•
Number of different MACs successfully authenticated per IdP in total;
•
Number of requests per IdP in Serbia;
•
Number of requests per IdP in the world;
•
Use per RP
The “Use by institution” Dashboard consists of the following panels:
•
Total number of different MAC addresses of the selected institution;
•
Total number of different MAC addresses of the selected institution successfully authenticated
in Serbia;
•
Total number of different MAC addresses of the selected institution successfully authenticated
abroad;
•
Number successfully authenticated different MAC addresses of the selected institution per
different RPs;
•
Use of eduroam by users of the selected institution per location in AMRES;
•
Use of eduroam by users of the selected institution per APs in AMRES;
•
Use of eduroam by users of the selected institution per RP.
The following “Use by location” dashboard is configured in the same manner as the previous one. The
panels are as follows:
•
Total number of different successfully authenticated MAC addresses of home users in the
selected location;
•
Total number of different successfully authenticated IdPs of home users in the selected
location;
•
Total number of different successfully authenticated MAC addresses of foreign users in the
selected location;
•
Total number of different successfully authenticated IdPs of foreign users in the selected
location;
•
Number of different successfully authenticated MAC addresses in the selected location;
•
Number of different MAC addresses at every AP of the selected location;
•
Number of different successfully authenticated MAC addresses on APs of the selected
institution monthly;
•
Number of requests per IdP in total in the selected location.
AMRES also monitors use of eduroam service by foreign users. For that purpose, it selects the
following data:
•
Total number of different successfully authenticated MAC addresses;
•
Total number of different successfully authenticated IdPs;
•
Number of different successfully authenticated MAC addresses per IdP;
•
Number of requests per IdP;
•
Use of eduroam by foreign users per location in AMRES;
•
Use of eduroam by foreign users per AP in AMRES;
•
Use of eduroam by foreign users per RP.
5
Conclusions
The Splunk Light Software, with all its limitations, offers great opportunities to an NREN to collect log
messages and in this way efficiently and qualitatively monitors and analyses the operation and use of
the service in the network.
The Splunk Light Software does not have a possibility for setting and sending email warnings in case
of alarming situations within the service monitored. Still, this version is more than a sufficient tool that
enables administrators to collect and search logs from different sources, monitor the service and the
behaviour of users in a fast and efficient manner. However, only one administrator account is allowed
within the application and there are no possibilities for creating new accounts, whether administrator
or user ones. Additionally, the access to the web application is limited to local sources of
authentication and does not offer a possibility of connection with external sources of authentication.
Although this version has limitation of 500 MB received data a day, practice has shown that it can fully
cover the needs of a middle-‐sized NREN. This certainly depends on the quantity of logs that the service
generates and on the type of service that is monitored.
Even though the primary role of the Splunk software is collection and analysis of logs, in some
situations, it can also be used as a tool for monitoring of the operation of the service. An example may
be the case where messages do not arrive through the syslog protocol to the remote server where
logs are collected.
Besides the Splunk Software, there are other open-‐source tools that enable analysis of logs in real
time such as Elastic
[13]
.
Appendix A
This chapter provides Dashboards in XML format and search strings for panels, based on which AMRES
monitors and analyses use of eduroam service.
A.1
All users
A.1.1
Dashboard panels
•
Total number of different successfully authenticated MAC addresses
sourcetype="syslog" host="ftlr1.amres.ac.rs" auth="Access-Accept" | stats dc(MAC)
•
Total number of different successfully authenticated IdPs
sourcetype="syslog" host="ftlr1.amres.ac.rs" auth="Access-Accept" | stats dc(IdP)
•
Number of different MACs successfully authenticated per IdP
sourcetype="syslog" host="ftlr1.amres.ac.rs" auth="Access-Accept" |timechart dc(MAC) by IdP limit=1000
•
Number of requests per IdP
sourcetype="syslog" host="ftlr1.amres.ac.rs" auth="*" |eval
macs=case(auth="Access-Accept", MAC) | eval macn=case(auth="Access-Reject", MAC)|rename IdP as Institucija | stats dc(macs) as MAC,
dc(macn) as MAC_fail,count(eval(auth="Access-Accept")) as Auth, count(eval(auth="Access-Reject")) as Auth_fail by Institucija | sort MAC desc
•
Use per location
sourcetype="syslog" host="ftlr1.amres.ac.rs" auth="*" AP="cisco*" OR
AP="lancom*" OR AP="linksys*" |rex field=AP "cisco.+-.+-(?<id>\D+)*" | rex field=AP "lancom.+-.+-(?<id>\D+)*"| eval
macs=case(auth="Access-Accept", MAC) |eval macn=case(auth="Access-Reject", MAC)|rename id as Institucija |stats dc(macs) as MAC, dc(macn) as MAC_fail, Accept")) as Auth,
sourcetype="syslog" host="ftlr1.amres.ac.rs" auth="*" AP="cisco*" OR AP="lancom*" OR AP="linksys*" | eval macs=case(auth="Access-Accept", MAC) |eval macn=case(auth="Access-Reject", MAC) | stats dc(macs) as MAC, dc(macn) as MAC_fail, count(eval(auth="Access-Accept")) as Auth, count(eval(auth="Access-Reject")) as Auth_fail by AP | sort MAC desc
•
Use per RP
sourcetype="syslog" host="ftlr1.amres.ac.rs" auth="*" | eval macs=case(auth="Access-Accept", MAC) |eval macn=case(auth="Access-Reject", MAC)|stats dc(macs) as MAC, dc(macn) as MAC_fail,
Accept")) as Auth, count(eval(auth="Access-Reject")) as Auth_fail by RP | sort MAC desc
A.1.2
Dashboard in the XML format
<form> <label>All users</label> <fieldset> <input type="time"/> </fieldset> <row> <table><title>Ukupan broj različitih uspešno autentifikovanih MAC adresa
ukupno</title>
<searchTemplate> sourcetype="syslog" host="ftlr1.amres.ac.rs" auth="Access-Accept" | stats dc(MAC)</searchTemplate>
</table> <table>
<title>Ukupan broj različitih uspešno autentifikovanih IdP-ova
ukupno</title>
<searchTemplate> sourcetype="syslog" host="ftlr1.amres.ac.rs" auth="Access-Accept" | stats dc(IdP)</searchTemplate>
</table> </row> <row> <chart>
<title>Broj različitih MAC uspešno autentifikovanih po IdP
ukupno</title> <searchTemplate>
sourcetype="syslog" host="ftlr1.amres.ac.rs" auth="Access-Accept" |timechart dc(MAC) by IdP limit=1000
</searchTemplate>
<option name="charting.axisLabelsY">numeric</option> <option name="charting.legend.placement">top</option>
<option name="charting.axisLabelsY.integerUnits">true</option> <option name="charting.axisTitleX.text">Vreme</option>
<option name="charting.axisTitleY.text">Broj različitih MAC
adresa</option> <option name="charting.chart">column</option> <option name="charting.chart.stackMode">stacked</option> <option name="charting.primaryAxisTitle.text"/> <option name="charting.secondaryAxisTitle.text"/> <option name="count">10</option>
<option name="displayRowNumbers">true</option> </chart>
</row> <row> <table>
<title>Broj zahteva po IdP ukupno</title> <searchTemplate>
sourcetype="syslog" host="ftlr1.amres.ac.rs" auth="*" |eval macs=case(auth="Access-Accept", MAC) |eval
macn=case(auth="Access-Reject", MAC)|rename
IdP as Institucija |stats dc(macs) as MAC, dc(macn) as MAC_fail,
count(eval(auth="Access-Accept")) as Auth,
count(eval(auth="Access-Reject")) as Auth_fail by Institucija | sort MAC desc
</searchTemplate> <option name="showPager">true</option> <option name="count">10</option> </table> </row> <row> <table>
<title>Korišćenje po lokaciji ukupno</title>
<searchTemplate>
<![CDATA[sourcetype="syslog" host="ftlr1.amres.ac.rs" auth="*"
AP="cisco*" OR AP="lancom*" OR AP="linksys*" |rex field=AP "cisco.+-.+-(?<id>\D+)*"
| rex field=AP "lancom.+-.+-(?<id>\D+)*"| eval macs=case(auth="Access-Accept", MAC)
|eval macn=case(auth="Access-Reject", MAC)|rename id as Institucija |stats dc(macs) as MAC, dc(macn) as MAC_fail,
count(eval(auth="Access-Accept")) as Auth,
count(eval(auth="Access-Reject")) as Auth_fail by Institucija]]> | sort MAC desc
</searchTemplate>
<option name="showPager">true</option> <option name="count">10</option>
</table> <table>
<title>Korišćenje po AP ukupno</title>
<searchTemplate>
<![CDATA[sourcetype="syslog" host="ftlr1.amres.ac.rs" auth="*" AP="cisco*" OR AP="lancom*" OR AP="linksys*" | eval
macs=case(auth="Access-Accept", MAC)
|eval macn=case(auth="Access-Reject", MAC) | stats dc(macs) as MAC, dc(macn) as MAC_fail,
count(eval(auth="Access-Accept")) as Auth,
count(eval(auth="Access-Reject")) as Auth_fail by AP]]> | sort MAC desc
</searchTemplate>
<option name="showPager">true</option> <option name="count">10</option>
</table> <table>
<![CDATA[sourcetype="syslog" host="ftlr1.amres.ac.rs" auth="*" | eval macs=case(auth="Access-Accept", MAC)
|eval macn=case(auth="Access-Reject", MAC)|stats dc(macs) as MAC, dc(macn) as MAC_fail,
count(eval(auth="Access-Accept")) as Auth,
count(eval(auth="Access-Reject")) as Auth_fail by RP]]> | sort MAC desc
</searchTemplate> <option name="showPager">true</option> <option name="count">10</option> </table> </row> </form>
A.2
AMRES users
A.2.1
Dashboard panels
•
Total number of different successfully authenticated MAC addresses in Serbia
sourcetype="syslog" host="ftlr1.amres.ac.rs" auth="Access-Accept" IdP="*.rs" RP="*.rs" | stats dc(MAC)
•
Total number of different successfully authenticated MAC addresses in the world
sourcetype="syslog" host="ftlr1.amres.ac.rs" auth="Access-Accept" IdP="*.rs" NOT RP="*.rs" | stats dc(MAC)
•
Total number of different successfully authenticated MAC addresses in total
sourcetype="syslog" host="ftlr1.amres.ac.rs" auth="Access-Accept" IdP="*.rs" | stats dc(MAC)
•
Total number of different successfully authenticated IdPs in Serbia
sourcetype="syslog" host="ftlr1.amres.ac.rs" auth="Access-Accept" IdP="*.rs" RP="*.rs" | stats dc(IdP)
•
Total number of different successfully authenticated IdPs in the world
sourcetype="syslog" host="ftlr1.amres.ac.rs" auth="Access-Accept" IdP="*.rs" NOT RP="*.rs"| stats dc(IdP)
•
Total number of different successfully authenticated IdPs in total
sourcetype="syslog" host="ftlr1.amres.ac.rs" auth="Access-Accept" IdP="*.rs" | stats dc(IdP)
•
Number of different MACs successfully authenticated per IdP in Serbia
sourcetype="syslog" host="ftlr1.amres.ac.rs" auth="Access-Accept" IdP="*.rs" RP="*.rs" |timechart dc(MAC) by IdP limit=1000
•
Number of different MACs successfully authenticated per IdP in the world
sourcetype="syslog" host="ftlr1.amres.ac.rs" auth="Access-Accept" IdP="*.rs" NOT RP="*.rs" |timechart dc(MAC) by IdP limit=1000
•
Number of different MACs successfully authenticated per IdP in total
sourcetype="syslog" host="ftlr1.amres.ac.rs" auth="Access-Accept" IdP="*.rs" |timechart dc(MAC) by IdP limit=1000
•
Number of requests per IdP in Serbia
sourcetype="syslog" host="ftlr1.amres.ac.rs" IdP="*.rs" auth="*" RP="*.rs"|eval macs=case(auth="Access-Accept", MAC) |eval
macn=case(auth="Access-Reject", MAC)|rename IdP as Institucija |stats dc(macs) as MAC, dc(macn) as MAC_fail,
count(eval(auth="Access-Accept")) as Auth,
count(eval(auth="Access-Reject")) as Auth_fail by Institucija | sort MAC desc
•
Number of requests per IdP in the world
sourcetype="syslog" host="ftlr1.amres.ac.rs" IdP="*.rs" auth="*" NOT RP="*.rs"|eval macs=case(auth="Access-Accept", MAC) |eval
macn=case(auth="Access-Reject", MAC)|rename IdP as Institucija |stats dc(macs) as MAC, dc(macn) as MAC_fail,
count(eval(auth="Access-Accept")) as Auth,
count(eval(auth="Access-Reject")) as Auth_fail by Institucija | sort MAC desc
•
Number of requests per IdP in total
sourcetype="syslog" host="ftlr1.amres.ac.rs" IdP="*.rs" auth="*" |eval macs=case(auth="Access-Accept", MAC) |eval
macn=case(auth="Access-Reject", MAC)|rename IdP as Institucija |stats dc(macs) as MAC,
dc(macn) as MAC_fail, count(eval(auth="Access-Accept")) as Auth, count(eval(auth="Access-Reject")) as Auth_fail by Institucija | sort MAC desc
•
Use per location in AMRES
sourcetype="syslog" host="ftlr1.amres.ac.rs" IdP="*.rs" auth="*" AP="cisco*" OR AP="lancom*" OR AP="linksys*" |rex field=AP "cisco.+-.+-(?<id>\D+)*" | rex field=AP "lancom.+-.+-"cisco.+-.+-(?<id>\D+)*"| eval
macs=case(auth="Access-Accept", MAC) |eval
macn=case(auth="Access-Reject", MAC)|rename id as Lokacija |stats dc(macs) as MAC, dc(macn) as MAC_fail, count(eval(auth="Access-Accept")) as Auth,
count(eval(auth="Access-Reject")) as Auth_fail by Lokacija | sort MAC desc
•
Use per AP in AMRES
sourcetype="syslog" host="ftlr1.amres.ac.rs" IdP="*.rs" auth="*" AP="cisco*" OR AP="lancom*" OR AP="linksys*" | eval
macs=case(auth="Access-Accept", MAC) |eval
macn=case(auth="Access-Reject", MAC) | stats dc(macs) as MAC, dc(macn) as MAC_fail, count(eval(auth="Access-Accept")) as Auth,
count(eval(auth="Access-Reject")) as Auth_fail by AP | sort MAC desc
•
Use per RP
sourcetype="syslog" host="ftlr1.amres.ac.rs" IdP="*.rs" auth="*" | eval macs=case(auth="Access-Accept", MAC) |eval
A.2.2
Dashboard in the XML format
<form><label>Users from AMRES</label> <fieldset>
<input type="time"/> </fieldset>
<row> <table>
<title>Ukupan broj različitih uspešno autentifikovanih MAC adresa u
Srbiji</title>
<searchTemplate> sourcetype="syslog" host="ftlr1.amres.ac.rs" auth="Access-Accept" IdP="*.rs" RP="*.rs" | stats
dc(MAC)</searchTemplate> </table>
<table>
<title>Ukupan broj različitih uspešno autentifikovanih MAC adresa u
svetu</title>
<searchTemplate> sourcetype="syslog" host="ftlr1.amres.ac.rs" auth="Access-Accept" IdP="*.rs" NOT RP="*.rs" | stats
dc(MAC)</searchTemplate> </table>
<table>
<title>Ukupan broj različitih uspešno autentifikovanih MAC adresa
ukupno</title>
<searchTemplate> sourcetype="syslog" host="ftlr1.amres.ac.rs" auth="Access-Accept" IdP="*.rs" | stats dc(MAC)</searchTemplate> </table>
</row> <row> <table>
<title>Ukupan broj različitih uspešno autentifikovanih IdP-ova u
Srbiji</title>
<searchTemplate> sourcetype="syslog" host="ftlr1.amres.ac.rs" auth="Access-Accept" IdP="*.rs" RP="*.rs" | stats
dc(IdP)</searchTemplate> </table>
<table>
<title>Ukupan broj različitih uspešno autentifikovanih IdP-ova u
svetu</title>
<searchTemplate> sourcetype="syslog" host="ftlr1.amres.ac.rs" auth="Access-Accept" IdP="*.rs" NOT RP="*.rs"| stats
dc(IdP)</searchTemplate> </table>
<table>
<title>Ukupan broj različitih uspešno autentifikovanih IdP-ova
ukupno</title>
<searchTemplate> sourcetype="syslog" host="ftlr1.amres.ac.rs" auth="Access-Accept" IdP="*.rs" | stats dc(IdP)</searchTemplate> </table>
</row> <row>