Differences in biotic interactions across range edges
have only minor effects on plant performance
Daniel S. W. Katz* and In
es Ib
a
nez
~
School of Natural Resources and Environment, University of Michigan
–
Ann Arbor, 440 Church St., Ann Arbor,
MI 48109, USA
Summary
1.
It is widely expected that plant species will expand their ranges poleward in response to climate
change. In the process, individuals establishing beyond existing range margins will be exposed to
new biotic communities, including different assemblages of natural enemies. The resulting
differ-ences in biotic interactions could lead to scenarios of enemy release or biotic resistance, and if the
interactions are strong, they could in
fl
uence plant performance and therefore colonization success.
2.
In order to test whether natural enemies will affect range expansion dynamics, we transplanted
seven species along a 450-km latitudinal gradient that spanned the range edges of
fi
ve of these
spe-cies. The experiment was conducted over 5 years with ~ 13 000 seedlings and included pesticide
treatments to reduce invertebrate herbivory. We measured foliar damage caused by disease and
invertebrate herbivores, seedling survival, light availability, soil moisture, soil nutrient concentrations
and several other variables in nine forests located in four regions along the latitudinal gradient.
3.
We found that several species (
Carya glabra, Liriodendron tulipifera, Quercus velutina
and
Robi-nia pseudoacacia
) tended to have less foliar disease beyond their range, but there were few
substan-tial differences in herbivory across range edges (with the exception of
Liriodendron tulipifera
).
After accounting for other variables, including environmental conditions and vertebrate herbivory,
we found that foliar disease decreased survival for four species (
Acer rubrum, Quercus alba,
Quer-cus rubra
and
Quercus velutina
) and foliar herbivory reduced survival for three species (
Acer
rubrum, Liriodendron tulipifera
and
Quercus rubra
).
4.
However, the effects of these biotic interactions on survival were very small (0
–
5% reductions in
survival at observed levels of damage after four years), which is veri
fi
ed by the minor effects of the
pesticide treatment on seedling survival.
5.
Synthesis.
Our results suggest that foliar herbivores and pathogens are unlikely to play a major
role in the range expansion dynamics of these temperate tree species.
Key-words:
biotic interactions, plant
–
insect interactions, plant
–
pathogen interactions, range
expansion, species distributions, survival, temperate forest
Introduction
Climate change is expected to cause shifts in species
distribu-tions as plants and animals track changing temperatures and
precipitation (Parmesan & Yohe 2003; Hickling
et al.
2006;
Crimmins
et al.
2011).
Predictions
of
poleward
range
expansion of plant species over the coming decades and
cen-turies are drawn from correlations between current species
distributions and climate (Iverson & Prasad 1998; Guisan &
Zimmermann 2000; Pearson & Dawson 2003), and
palaeore-constructions of shifts in vegetation composition during
previ-ous periods of climate change (Davis 1983; Graumlich &
Davis 1993; Petit
et al.
2002; Williams
et al.
2004). Some
studies have found empirical evidence for contemporary
lati-tudinal shifts of tree species distributions in North America
(Woodall
et al.
2009; Murphy, Vanderwal & Lovett-Doust
2010; Boisvert-Marsh, P
eri
e & de Blois 2014; Desprez
et al.
2014), whereas others have not (Zhu, Woodall & Clark
2012). The variability in how species distributions respond to
climate change highlights the potential importance of
non-cli-matic drivers, such as biotic interactions.
Biotic interactions with natural enemies, competitors and
mutualists have the potential to in
fl
uence range expansion
dynamics of terrestrial plants by systematically affecting the
performance of plants establishing beyond their current range,
where populations do not yet exist (hereafter referred to as
‘
migrants
’
) (Cairns & Moen 2004; Moorcroft, Pacala & Lewis
2006; Morri
€
en
et al.
2010; HilleRisLambers
et al.
2013; Wisz
et al.
2013). The effects of natural enemies on plant
popula-tions are often substantial (Katz 2016), as are their subsequent
effects on ecosystem function (Hicke
et al.
2012). It is
increasingly thought that predictions of changes in species
distributions in response to climate change should take
herbi-vores and pathogens into account (Van der Putten, Macel &
Visser 2010; Zarnetske, Skelly & Urban 2012; Svenning
et al.
2014). While several studies have investigated how soil
communities differentially affect native versus migrant plants
(van Grunsven
et al.
2010; Stanton-Geddes & Anderson
2011; McCarthy-Neumann & Ib
a
~
nez 2012), little is known
about whether existing above-ground herbivore and pathogen
communities will affect latitudinal range expansion.
Populations on the expanding edge of a species distribution
often escape from specialist natural enemies, as is shown by
an increasing number of case studies from various organisms
(Alexander
et al.
2007; Men
endez
et al.
2008; Patot
et al.
2010; Phillips
et al.
2010b; Tsai & Manos 2010). This can
happen because of low host densities on range edges and
because migrant populations on expanding range fronts
origi-nate from repeated founding events, each of which offers a
chance to leave specialists behind (Phillips, Brown & Shine
2010a). Moreover, in a glasshouse experiment, successful
range-expanding plants were less affected by a na
€
ı
ve
herbi-vore (Engelkes
et al.
2008), showing that migrants can also
be released from generalist herbivores. Even though enemy
release is transient because of pest and pathogen accumulation
(Br
€
andle
et al.
2008; Diez
et al.
2010; Mitchell
et al.
2010),
it could still help migrant plants outperform native ones,
increasing colonization success and overall rates of range
expansion (Moorcroft, Pacala & Lewis 2006).
However, as range-expanding species enter new areas, they
will encounter indigenous natural enemies; biotic resistance
from the existing community could potentially prevent new
plant species from establishing there. There are many
exam-ples of native generalist herbivores reducing the performance
of plants of exotic (i.e. intercontinental) origin (Levine, Adler
& Yelenik 2004; Parker, Burkepile & Hay 2006). However,
there are substantial differences between intra-continental
range expansion and inter-continental range expansion (as
reviewed in Morri
€
en
et al.
2010; Van der Putten, Macel &
Visser 2010). First, natural enemy community composition
may not change abruptly at the edge of a plant species range.
Secondly, existing plant communities may contain species
that are closely related to the migrant; in this case, specialist
natural enemies may transfer quickly (Connor
et al.
1980;
Bertheau
et al.
2010). Scenarios of both enemy release and
biotic resistance are possible and only
in situ
experimental
fi
eld studies can determine how the net effects of biotic
inter-actions will vary across range edges (Morri
€
en
et al.
2010;
van der Putten 2011; Renwick & Rocca 2015).
Whether the net differences in biotic interactions are
posi-tive or negaposi-tive, they are likely to have the largest effect on
early life stages, which tend to be more strongly affected by
density-dependent forces (Green, Harms & Connell 2014;
Zhu
et al.
2015 but see Piao
et al.
2013). Many of the
strongest examples of habitat
fi
ltering driven by biotic
interac-tions have been found at the seedling stage (HilleRisLambers,
Clark & Beckage 2002; Fine
et al.
2006; Andersen, Turner &
Dalling 2014). This may be in part because small individuals
have low energy reserves, are especially vulnerable to biotic
and abiotic forces and tend to have weaker chemical defences
(Myers & Kitajima 2007; Barton & Koricheva 2010; Boege,
Barton & Dirzo 2011; Massad 2013). If biotic forces have the
potential to limit range expansion, the seedling stage would
be the
fi
rst place to look for it.
Here, we test how biotic interactions vary across range edges
and assess their effects on plant performance. We use a seedling
transplant experiment with seven temperate tree species to
answer the following questions: (i) Are migrant species
exposed to different amounts of herbivory and disease than in
their native range?, and (ii) How important are any differences
in herbivory and disease to plant survival? Answers to these
questions will help determine whether foliar herbivores and
pathogens have the potential to substantially affect colonization
success and therefore range expansion dynamics.
Materials and methods
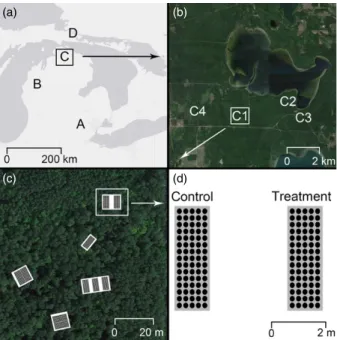
We initiated a seedling transplant experiment in 2010, and over the following 4 years, we planted seedlings in four regions across a 450-km latitudinal gradient (Fig. 1). Species origins varied (Table 1):five were native or naturalized (self-sustaining populations were present) at some regions and migrants at others (Carya glabraP. Mill., Lirio-dendron tulipiferaL., Q. albaL., Q. velutinaLam. andRobinia pseu-doacacia L.) and two species were native across all regions (Acer rubrumL. andQuercus rubraL.). We selected species based on their current and predicted distributions (Iversonet al.2008) and on their
(a) (b)
(c) (d)
Fig. 1.Regions A–D (panel a) contained one to four sites (panel b), which were located in distinct forest types (e.g. sites C1–C4). Each site had between 2 and 21 plots (white boxes in panel c). Each plot had between one and three subplots (grey boxes in panel d) to which pesticide or control treatments were applied. [Colourfigure can be viewed at wileyonlinelibrary.com]
light and soil moisture requirements. At each region, we established between one and four sites in different forest types, and at each site, we planted seedlings in 2–21 plots (Table 2; Fig. 1); this design was dictated by logistical constraints (i.e. site establishment was restricted to University of Michigan properties or areas we possessed permits to work in) and the unbalanced experimental set-up does not pose a challenge for the analyses used. Each plot was composed of between one and three subplots, some of which were used for experimental treatments (see below). Sites and plots were established in a variety of different forest types (Table 2; Fig. 1) and in a range of environ-mental conditions (Appendix S1, Supporting Information). A total of 13 218 seedlings were planted between 2010 and 2013 (Table 1).
S E E D L I N G S
Seeds were germinated at the University of Michigan Matthaei Botan-ical Gardens (Ann Arbor, MI, USA) in potting soil (Metro-Mix 380; SunGro Horticulture, Agawam, MA, USA), where they were watered daily. Seeds were collected from wild sources within Michigan when available, but were otherwise obtained from outside of Michigan (Appendix S2). To account for maternal effects (i.e. seed size), we measured the height of the seedlings (defined as the distance from the soil to the tip of the apical meristem) 1 month after emergence. Bare root seedlings were then transplanted into the study plots in May and June of 2010–2014, with a minimum distance of 25 cm between seedlings. Seedlings were watered upon planting (125 mL per seed-ling) to decrease transplant shock and existing vegetation was left
intact. A total of 2196 seedlings were transplanted in the fall instead of in the spring in 2011, 2012 and 2013; this was done in order to increase both the range of seedling sizes and total sample size.
P E S T I CI DE T R E A T M E N T
We experimentally reduced herbivory in 48 subplots in 2012 and 2013 using a pyrethroid pesticide (Talstar P, active ingredient bifen-thrin; Fecko 1999). This pesticide has been successfully used by other researchers (e.g. Suwa & Louda 2012, Spierset al.2006), and does not contain nitrogen. To ensure that it caused no direct effects on the plants, through either phytotoxicity or phytostimulation, we conducted a glasshouse control experiment; survival and relative growth rates were not impacted, although there is mixed evidence of mild phyto-toxicity for Acer rubrum(Appendix S3). We sprayed a solution of bifenthrin (0.008% active ingredient) on the tops and bottoms of the leaves of seedlings in treatment subplots three times a year during 2012 and 2013. We sprayed the same amount of water on leaves in paired control subplots (Fig. 1, panel D). We also distributed a mol-luscicide, metaldehyde, along one outside edge of pesticide subplots to reduce herbivory by slugs and snails. The molluscicide was dis-tributed on the side of the treatment plot furthest from the paired con-trol subplot; no metaldehyde was distributed within 5 m of a concon-trol subplot seedling. Metaldehyde reduces slug abundance and herbivory at the microsite level, without impacting plots as close as 5 m (Ferguson 2004). In 2010 and 2011, we built insect exclosures around a subset of first year seedlings, but neither year’s exclosure design
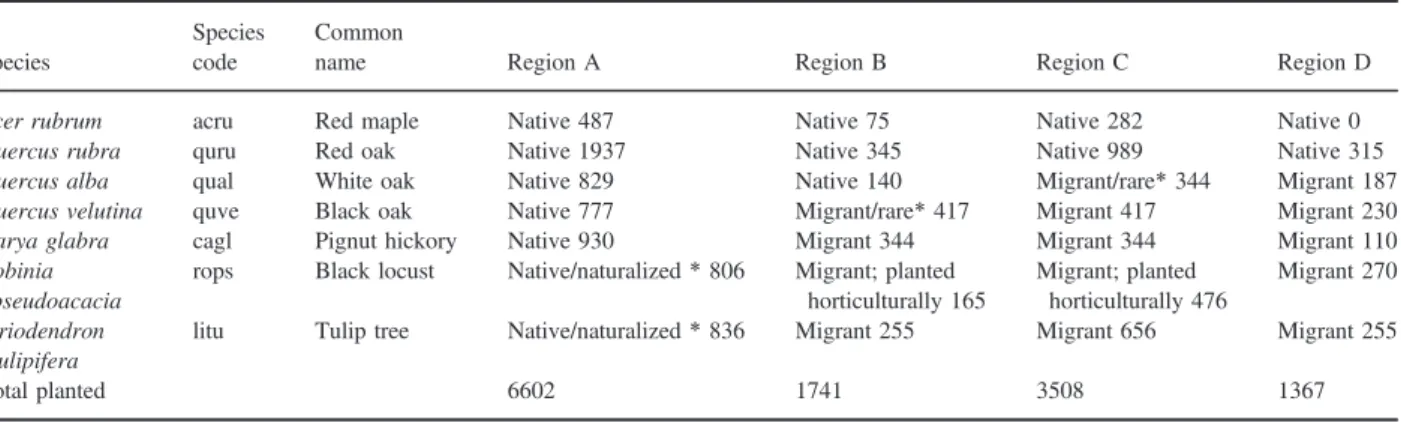
Table 1. Plant species used in transplant experiments and their residency status at each study region. Species residency status (native, naturalized or migrant) was determined using Little’s range maps, FIA data (via the Climate Change Tree Atlas; Prasad et al.2007–ongoing) and county data from the USDA Plants Database and the Michigan Flora Online. In some cases, these data sources provide conflicting information, which is indicated with an asterisk. The number of seedlings of each species planted in each region is also included
Species
Species code
Common
name Region A Region B Region C Region D
Acer rubrum acru Red maple Native 487 Native 75 Native 282 Native 0
Quercus rubra quru Red oak Native 1937 Native 345 Native 989 Native 315
Quercus alba qual White oak Native 829 Native 140 Migrant/rare*344 Migrant 187
Quercus velutina quve Black oak Native 777 Migrant/rare*417 Migrant 417 Migrant 230
Carya glabra cagl Pignut hickory Native 930 Migrant 344 Migrant 344 Migrant 110
Robinia pseudoacacia
rops Black locust Native/naturalized*806 Migrant; planted
horticulturally 165 Migrant; planted horticulturally 476 Migrant 270 Liriodendron tulipifera
litu Tulip tree Native/naturalized*836 Migrant 255 Migrant 656 Migrant 255
Total planted 6602 1741 3508 1367
Table 2. Description of sites used in the transplant experiment. Environmental variables at the plot and subplot levels are given in Appendix S4
Site Longitude (decimal degrees) Latitude (decimal degrees) Average number
of frost free days Soil texture
Major vegetation
Average growing season length (days)
Number of plots
A1 83.673 42.324 175 Loam Maple 205 9
A2 84.023 42.457 167 Sandy loam Oak–maple 203 21
A3 84.012 42.459 169 Sandy loam Oak–hickory 199 2
B1 85.751 44.218 157 Sand Oak–maple 187 8
C1 84.714 45.553 164 Loamy sand Aspen–maple 205 5
C2 84.682 45.568 180 Sand Maple–beech 212 7
C3 84.673 45.559 180 Sand Maple 212 3
C4 84.748 45.556 118 Sand Pine–aspen–oak 146 6
consistently reduced herbivory. Only mortality from years after the exclosures were removed is included in the analysis.
S E E D L I N G M E A S U R E M E N T S
Seedlings were censused three times a year, in early, mid- and late summer. Seedling height (defined as the distance from the soil to the highest bud) and diameter (1 cm above the soil) were measured dur-ing thefirst and last census of each year. Leaf damage was quantified by visually surveying up to 25 leaves per seedling using cover classes (<1%, 1–5%, 6–15%, 16–25%, 26–50%, 51–75%,>75%). For seed-lings that had more than 25 leaves, the 25 leaves surveyed were selected at random. The same person (D. Katz) conducted all surveys to ensure that visual estimates were consistent. During each census, foliar damage was categorized as being caused by herbivory, disease, physical damage or desiccation. Damage types counted as herbivory included chewing (e.g. skeletonizing, window feeding, hole feeding), piercing-sucking (e.g. stippling; regularly shaped small round discol-orations in leaves), leaf mining and galling. Damage was counted as disease if symptoms included abnormal coloration, blackening of the leaf, dark spots with necrosis, spots with discolorations surrounding them and the presence of fungal fruiting bodies. Both infectious and non-infectious diseases (e.g. nutrient deficiencies) are therefore included in the disease category (Sinclair & Lyon 2005). We also recorded whether seedlings exhibited stem damage patterns typical of those caused by browsing by mammals at each census; this was recorded as a binary variable. The role of vertebrate herbivores was further investigated using deer exclosures and trail cameras that were deployed at study plots during 2013 and 2014 (Appendix S4). Although leaf litter was disturbed during censuses, which could have reduced potentially fatal burial in leaf litter (Pattersonet al. 2012), this disturbance was consistent for all seedlings at all sites.
E N V I R O N M E N T A L DA T A
Environmental variables measured included light availability, tempera-ture, soil nutrients and soil moisture. Hemispherical canopy pho-tographs were taken 1 m above seedlings, using a Sigma SD14 camera (Sigma Corporation, Tokyo, Japan) with a sigma 4.5-mm cir-cularfisheye lens (Sigma Corporation) to measure light availability. At least two photographs were taken per subplot when canopy closure was greatest (i.e. in mid-summer). Photographs were taken under uni-form sky conditions (i.e. dusk, dawn or uniuni-formly cloudy days). The global site factor (GSF), the proportion of total possible sunlight reaching the forest floor, was calculated using Hemiview (Delta-T Devices, Cambridge, UK). GSF was averaged across subplots and across years.
Temperature was measured hourly at each site with a HOBO Pro V2 U23 Temperature Data Logger (Onset Computer Corporation, Pocasset, MA, USA). Soil water (per cent moisture by volume) was measured hourly at each site with a HOBO Micro Station Data Log-ger (Onset Computer Corporation). Volumetric soil water content in the top 7.5 cm of soil was measured with a FieldScout TDR 300 Soil Moisture Meter (Spectrum Technologies, Plainfield, IL, USA) in at least six points per subplot several times during the growing seasons of 2011–2014. The relationship between soil moisture at the subplot level and at the site level was quantified using linear regressions (mean R2=0.67); these regressions were then used to predict soil
moisture between censuses. For thefirst census in each spring, soil moisture was estimated from the beginning of the growing season, which we defined as starting after the last day where the minimum
temperature fell below3°C. For other censuses, the soil moisture values used in the analysis were the mean and standard deviation of soil moisture between that and the previous census.
Soil nutrients were measured in 2013 using resin packs (Unibest International Corporation, Walla Walla, WA, USA). Resin packs in the southernmost region (region A; see Fig. 1) were deployed between 8 April 2013 and 30 October 2013 and resin packs were deployed from 23 April 2013 to 23 October 2013 in the other regions (regions B, C and D; see Fig. 1). Between two and four resin packs were deployed per plot, depending on the number of subplots. Four resin packs could not be retrieved because they were moved by bur-rowing animals or were otherwise damaged, and no nutrient data are available for the two plots that were not yet established at the time of resin pack deployment. Resin packs were retrieved and refrigerated until they were shipped to Unibest for analysis. Analysis was con-ducted by Unibest; ions were extracted using 2 m HCl and the ion exchange resin analysis was conducted using inductively coupled plasma spectroscopy analysis (PerkinElmer 3300 DV; Ca, Mg, Mn, P) and FIA Lab Flow Injection (FIA 2500; NO3, NHþ4).
STAT IST ICA L A NALYS IS
Differences in foliar herbivory and disease
To compare foliar disease and herbivory across species and sites, we usedANOVAand conducted post hoc pairwise comparisons using
max-ttests through theMULTCOMPpackage inR(Hothorn, Bretz & Westfall
2008). Max-ttests are robust for comparisons of non-normal distribu-tions, unbalanced sample sizes and heterogeneity of variances (Her-berich, Sikorski & Hothorn 2010). To compare whether herbivory varied between seedlings in control and pesticide treatments, we used Wilcoxon rank sum tests.
Seedling survival
To analyse how herbivory, foliar disease and region affected seedling survival, we used a counting process in a Cox survival model (Ander-sen & Gill 1982) in which we took into account both abiotic and bio-tic variables: light, soil moisture, soil nutrients, seedling maternal effects, mammal browse and treatment effects (control and pesticide application). This type of model has been used for seedling survival because it allows for the inclusions of bothfixed and random effects and for time-dependent covariates (McCarthy-Neumann & Iba~nez 2012). We only included seedlings that had survived to their second year in this analysis, to minimize any artefacts from transplanting the seedlings and to reduce the effects of seed resources on survival. The likelihood for the model is:
NitPoissonð Þkit
whereNis whether seedlingiwas found dead at timetandkis esti-mated as a function of the intrinsic rate of mortality, or hazardh, and the extrinsic risk of mortality, or riskl:
kit¼htelit
Parameter estimation was conducted using a Bayesian approach, which allowed us to incorporate different sources of uncertainty and missing data (Gelman & Hill 2007). The hazard was estimated at each time step,ht, from a gamma distribution,ht~ Gamma(1, 0.05). The hazard reflects differences in mortality rates through the course of the experiment that are not accounted for by the risk (e.g. survival rates that are age dependent).
The risk,lit, was estimated as a function of the covariates included
in the analysis,lit¼Xitb, whereXitis the matrix of covariates associ-ated with each seedlingiat timet.bis the vector offixed effect coeffi -cients associated with each covariate. We explored several different models, including different covariates and random effects (e.g. plot and year) and selected the model with the lowest DIC (deviance information criterion; Spiegelhalteret al.2002) that allowed us to answer our ques-tions. In thefinal model, plot effects were drawn from a normal distri-bution with a mean oflnativeorlmigrantdepending on whether the focal
species was native in that plot; plot effects~ Normal(l, r2), where r~Uniform (0, 10). Thus, differences betweenlnativeandlmigrant
rep-resent a difference in survival within a species range compared with beyond a species range. Random effects were included for site, and the following covariates were also included (data ranges are described in parentheses): observed proportion of leaf area affected by herbivory over the previous year (continuous: 0–1), observed proportion of leaf area affected by disease over the previous year (continuous: 0–1), whether or not the seedling was browsed by a mammal since the previous census (binary: 0, 1), seedling height at planting (continuous, 3–390 mm), the number of leaves in the previous census (continuous: 0–60 leaves), the proportion of available light that reached the seedling (continuous: 0–1), volumetric soil moisture since the last census (continuous: 0–1), whether the seedling was planted in the spring or fall (binary: 0, 1) and afixed effect was included for the indirect effects of the invertebrate herbivory pesticide treatment (binary: 0,1). To improve comparisons between variables, we standardized seedling height at time of transplant, the number of leaves, light and soil moisture. Light and soil moisture were modelled as latent variables characterized by their measured mean and standard deviation for each inter-census time per-iod. Fixed effect coefficients were drawn from non-informative prior distributions:b~Normal (0, 1000). The random effects for site were drawn from a normal distribution: random effect~ Normal (0, r2), wherer~Uniform (0, 10). We predicted survival where seedlings were native or migrants,^Snativeor^Smigrantat average herbivory and disease
levels for native and migrant seedlings. Survival of seedlings in the pes-ticide treatment was estimated separately. The proportion of seedlings surviving,^S, was predicted over time (up to 5 years), under the follow-ing conditions: average light, average soil moisture, average transplant height, average number of leaves, no browsing and spring planting.
^
Smigratory status;treatmentPower e
Ptime
t ht;exb
We then simulated survival for control seedlings throughout all regions across the range of possible herbivory values but with no dis-ease and then vice versa.
Survival of each species was modelled separately. Posterior densities of the parameters were obtained by Gibbs sampling (Geman & Geman 1984) usingJAGS3.4 (Plummer 2003) via theRJAGSpackage inR (Plum-mer 2014). Convergence occurred after 1000 to 10 000 iterations and chains were inspected visually. Each species was run for 40 000 itera-tions and posterior parameter values were based on post-convergence results. Statistical model code is provided in Appendix S5. Visualiza-tion was conducted using theGGPLOT2 package inR(Wickham 2009). All analyses were conducted usingR(R Core Team 2013).
Results
D I F F E R E NC E S IN HE R B I V O R Y
We found extensive variation in herbivory across species and
sites, but there were few systematic differences in herbivory
across range edges; four out of
fi
ve migrant species
encoun-tered some sites beyond their ranges where herbivory was
higher and others where herbivory was lower than in sites
located within their ranges (Fig. 2). An exception was
Lirio-dendron tulipifera;
the three sites within its range were the
sites with the highest herbivory levels, although herbivory
was only consistently signi
fi
cantly higher at one site within
its range than at sites beyond its range (
P
<
0.05). In general,
species showed wide amounts of variation between sites,
regardless of migratory status; this is especially apparent for
the species that were native at all regions (
Quercus rubra
and
Acer rubrum
). Likewise, migrant species did not tend to have
different amounts of herbivory than native species within
sites. The pesticide treatment successfully reduced observed
herbivory at all sites for three species (Appendix S6),
Carya
glabra, Q. velutina
and
Q. alba,
and signi
fi
cantly reduced
herbivory in some regions for the other species (
Q. rubra,
A. rubrum,
L. tulipifera
and
Robinia
pseudoacacia
;
P
<
0.05); in 22 out of 23 comparisons, herbivory was lower
in the pesticide plots.
D I F FE R E N C E S I N F O L I A R DI S E A S E
Foliar disease varied according to species and region, but four
species,
C. glabra, L. tulipifera, Q. velutina
and
Q. alba
,
tended to have lower disease rates at sites beyond their
ranges, although these results were not always statistically
signi
fi
cant (Fig. 2). This resulted in migrant plants having
somewhat lower foliar disease rates than native plants at
many sites. However, it should be noted that
Q. rubra
, which
was native at all sites, also had higher disease levels at two
of the southern sites (
P
<
0.05). For
A. rubrum
, the other
spe-cies that was native in all areas, there were no consistent
lati-tudinal patterns.
SEEDLI NG SURV IVAL
Herbivory tended to reduce survival for most species, but
parameter estimates for the effects of herbivory on survival
were only statistically signi
fi
cant for three species,
A. rubrum
(mean and 95% CI: 1.56, 0.53
–
2.55),
Q. rubra
(0.78, 0.23
–
1.31) and
Q. velutina
(1.03, 0.10
–
1.92; Fig. 3). Foliar disease
had a signi
fi
cantly negative effect on survival for
A. rubrum
(2.27, 1.22
–
3.25),
Q. alba
(1.59, 0.62
–
2.47),
Q. rubra
(1.10,
0.59
–
1.60) and
Q. velutina
(1.73, 0.70
–
2.70; Fig. 3). A full
list of parameter estimates for the survival model is given in
Table 3. Even for species for which leaf damage had signi
fi
-cant negative effects on survival, survival simulations showed
it caused only small reductions in survival at average amounts
of herbivory (Fig. 4) and disease (Fig. 5). Seedling survival
in pesticide treatments was never signi
fi
cantly higher than in
control treatments (Fig. 6), and overall differences were
minor. The modelled proportion of seedlings alive after
fi
ve
years was signi
fi
cantly higher beyond range edges for
L. tulipifera
(mean
SD for native: 0.003
0.010
com-pared with migrant: 0.071
0.055) and although not signi
fi
-cant, some species had similar trends, including
Q. velutina
(native: 0.177
0.126 compared with migrant: 0.389
0.136 and
C. glabra
(native: 0.163
0.162 compared with
migrant: 0.366
0.146).
Discussion
The potential importance of biotic interactions to plant range
expansion has received increased attention in recent years, but
a lack of empirical evidence of how biotic interactions vary
across range edges has precluded understanding how this may
affect plant species range expansion in response to climate
change. Our results reveal that systematic differences in
inver-tebrate herbivory across range edges are relatively uncommon,
but do occur. In contrast, several plants tended to have more
foliar disease in regions where they are native than in regions
where they are migrant. Within many sites, migrant species
also tended to have less disease than native species. However,
our analysis found only minor effects of foliar herbivory and
disease on seedling survival at common amounts of damage.
This is supported by results from the pesticide treatment,
which was generally effective in reducing herbivory, but
resulted in minor and idiosyncratic responses in survival.
Thus, our results suggest that foliar herbivores and disease
are unlikely to have strong effects on latitudinal range
expan-sion dynamics of these temperate trees.
FO L IA R HE RB I V O RY A C R OS S RA N G E E D G E S
There were few systematic differences in foliar herbivory
across range edges, which demonstrates that commonly
occur-ring abundances of invertebrate herbivores are unlikely to
play a consistent role in intra-continental range expansion of
these species. Although it is possible that enemy release will
occur for particular species (e.g.
L. tulipifera
) or in particular
Fig. 2.Boxplots of the proportion of leaf area affected by foliar herbivory (column 1) and disease (column 2) in midsummer for each species across the latitudinal gradient, which extended from the southern region (A) to the northernmost region (D). The box consists of the first, second and third quartiles, the whiskers extend to the 10th and 90th percentiles, the mean is shown with a circle, the sample size is shown below the boxplot for each site, and different letters above the whiskers represent significant differences in foliar herbivory between sites. Boxplot tone represents migratory status (dark grey=native, light grey=migrant).Data from seedlings in experimental
forest types, foliar herbivory depended more upon conditions
at the site and plot levels than upon whether a species was
native or migrant. The magnitude of spatial heterogeneity in
herbivory between sites is similar to that found by other
stud-ies (Adams
et al.
2008; Adams & Zhang 2009); if there are
regional trends in herbivory, its signal is easily lost in the
high inter-site variability. One explanation for why there are
not systematic differences is that diet breadth is especially
wide for leaf-chewing invertebrates in temperate forests
(Forister
et al.
2015).
F O L I A R D I S E A S E A C R O S S R A N GE E D G E S
Several migrant plants tended to have lower levels of foliar
dis-ease symptoms outside of their ranges. These
fi
ndings highlight
the relatively higher importance of enemy release from
pathogens than from herbivores. The patterns we found are also
conservative because our measure of foliar disease includes
non-infectious diseases (e.g. nutrient de
fi
ciencies), which are
unlikely to be systematically lower beyond a species range.
Two of the species that tended to have reduced foliar disease
outside of their ranges were
Q. alba
and
Q. velutina
, even
though the congeneric
Q. rubra
was common in all regions.
This was unexpected, because more closely related plants share
more natural enemies, generally facilitating transfer of natural
enemies from indigenous relatives to newly arrived plants
(Pearse & Hipp 2009; Ness, Rollinson & Whitney 2011;
Gil-bert, Briggs & Magarey 2015; Parker
et al.
2015), and
patho-gen host range is often somewhat constrained to host
phylogeny (Gilbert & Webb 2007). Thus, the species chosen in
this study may lead to especially conservative conclusions
about the potential for enemy release from foliar pathogens.
The potential for escape from foliar pathogens at range
edges is corroborated by other studies on above-ground
pathogens (e.g. Alexander
et al.
2007), although substantially
more work has been conducted on differences in plant
–
soil
interactions across range edges (e.g. van Grunsven
et al.
2010; Stanton-Geddes & Anderson 2011; McCarthy-Neumann
& Ib
a
~
nez 2012). For one of the focal species,
R.
pseudoaca-cia
, negative soil feedbacks are more common within than
beyond its range (Callaway
et al.
2011). Similar patterns are
also implied by studies that have found correlations between
pathogen load and time since plant introduction (Diez
et al.
2010; Flory & Clay 2013). There is also evidence of reduced
negative soil feedback outside of plant ranges from
glass-house experiments (Engelkes
et al.
2008). These patterns may
partially result from migrant seedlings not being near adult
conspeci
fi
cs, which reduced negative plant
–
soil feedback in
the same system as this study (McCarthy-Neumann & Ib
a
~
nez
2012). Indeed, even when species encounter the same types
of pathogens outside of their range, those strains may be less
virulent (Reinhart
et al.
2010). One potential explanation for
why there was a stronger signal of enemy release from
patho-gens than invertebrate herbivores is that invertebrate
herbi-vores in this system could be more on the generalist range of
the spectrum (Forister
et al.
2015) than the comparable
patho-gens (Barrett
et al.
2009).
Fig. 3.Effects of foliar herbivory and foliar disease on seedling sur-vival (estimates from the mortality model are multiplied by 1). Parameter estimates below 0 indicate a negative effect on survival; 95% credible intervals that cross zero are not statistically significant.
Table 3. Survival model parameters (meanstandard deviation) indicate effects on mortality (i.e. higher values indicate higher probability of death). Parameter estimates that were significantly different from zero (95% CI does not include zero) are in bold, except for thefixed effects for migratory status, which are in bold iflnativeis significantly different fromlmigrant
Parameter Acer rubrum Quercus rubra Quercus alba Quercus velutina Carya glabra
Liriodendron tulipifera Robinia pseudoacacia Browse 1.020.60 0.810.27 1.620.49 1.191.30 2.090.46 0.170.65 0.360.54 Disease 2.270.52 1.110.26 1.590.47 1.740.51 0.230.41 0.450.56 1.582.13 Herbivory 1.560.52 0.780.28 0.341.00 1.030.46 0.650.48 0.780.43 0.420.71 Light 0.950.88 0.670.53 0.670.91 1.570.84 0.360.84 0.300.75 0.190.76 lnative 4.060.52 2.850.38 3.180.55 2.910.55 2.620.72 1.270.44 2.130.47 lmigrant NA NA 3.160.54 3.570.49 3.340.51 2.270.41 2.320.44 Number of leaves 1.670.25 1.640.14 1.070.27 1.620.22 0.420.12 0.730.11 1.520.19 Pesticide 0.440.16 0.210.09 0.160.20 0.090.25 0.080.09 0.060.11 0.090.16 Planting height 0.030.16 0.040.09 0.270.19 0.000.17 0.050.10 0.180.12 0.060.15 Soil moisture 0.631.61 3.570.94 3.292.21 0.151.56 2.631.8 2.850.98 0.981.47 Time of planting 0.610.91 0.590.89 0.810.89 0.480.90 0.570.83 0.480.87 0.990.93
E F F E C T S O F L E A F D A M A G E O N S U R V I V A L
The modelled effects of foliar herbivory and foliar disease on
seedling survival tended to be small. Although even small
responses can have important effects at high levels of
dam-age, herbivory and disease each tended to affect
<
10% of leaf
area on average. Thus, even though high levels of leaf
dam-age were likely to kill individual seedlings, the proportion of
seedlings that were killed by foliar damage was low.
More-over, the species that were most sensitive to foliar damage
did not have large differences in damage across range edges
(e.g.
Q. velutina
responded strongly to disease, but it had
similar amount of disease in areas where it was native and
migrant, whereas
L. tulipifera
had far less disease in areas
where it was a migrant, but that had only small and insigni
fi
-cant effects on survival). Our estimates for the effects of
foliar damage on survival are somewhat smaller than other
researchers have reported (e.g. Meiners, Handel & Pickett
2000; Yamazaki, Iwamoto & Seiwa 2009; Cleavitt, Fahey &
Battles 2011; Coyle
et al.
2014), but are corroborated by
sim-ilar levels of survival between the control and pesticide
treat-ments, although some caution is warranted, given that two
species (
A. rubrum
and
Q. rubra
) experienced negative
indi-rect effects of the pesticide treatment on survival in the
fi
eld.
Although seedlings that experienced vertebrate herbivory had
low survival rates, vertebrate herbivory was rare at our study
sites. Thus, even though browse damage has the potential to
shift competitive hierarchies for temperate and boreal tree
species in the transition zone (Fisichelli, Frelich & Reich
2012), it seems unlikely to have much of an effect on
colo-nization success by migrant seedlings in these forests.
Fig. 4.Simulated seedling survival at invertebrate herbivory levels ranging from 0% (light) to 100% (dark). Simulations assumed average environmental conditions, planting height, number of leaves, and spring planting with no foliar disease or vertebrate herbivory. The dotted line shows simulated survival at the average level of observed herbivory across all regions. Simulations begin 1 year after planting.
Fig. 5.Simulated seedling survival at disease levels ranging from 0% (light) to 100%
(dark). Simulations assumed average
environmental conditions, planting height, number of leaves, and spring planting and no herbivory. The dotted line shows simulated survival at the average level of observed foliar damage due to disease across all regions. Simulations begin 1 year after planting.
I M P L I C A T I O N S F O R R A N G E S HI F T S I N R E S P O N S E TO C L IMA T E CH A N G E
We found that seedlings from non-native species can
estab-lish in areas beyond their current ranges, as have several
other studies (Kellman 2004; Ib
a
~
nez, Clark & Dietze 2009;
Samis & Eckert 2009; McCarthy-Neumann & Ib
a
~
nez 2012).
Although we found cases where biotic interactions
systemati-cally varied beyond range edges, commonly observed levels
of foliar damage did not translate into substantial effects on
seedling survival. Similarly, even in cases where there were
large differences in survival across range edges, differences
in foliar damage only accounted for very small amounts of
these differences. However, it is possible that other types of
biotic interactions may be more important; for example,
below-ground herbivory was not explicitly measured in this
study, but can be an important source of damage to plants
(Van der Putten
et al.
2001; Van der Putten 2003) and often
has stronger effects on mortality than damage to leaves
(Zvereva & Kozlov 2012; Dietze & Matthes 2014). It will
also be important to test for effects on other plant
perfor-mance metrics; lower growth and reproductive rates beyond
range edges can also play a role in determining species
dis-tributions (Angert & Schemske 2005). Although much
remains to be explored, our
fi
ndings show that even in cases
where biotic interactions vary across range edges, they still
may not have important effects on colonization success or
range expansion dynamics.
Acknowledgements
This work was supported by the National Science Foundation (NSF) through a Graduate Research Fellowship and a dissertation improvement grant (DEB 1309805). Funding was also provided by a NSF grant (DEB 1252664), the USDA McIntire-Stennis Program (USDA 2012-32100-06099), the University of Michigan’s School of Natural Resources and Environment, Rackham Gradu-ate School, Matthaei Botanical Garden and the E.S. George Reserve.
Data accessibility
Seedling data (foliar damage, planting heights, vertebrate herbivory, etc.) and environmental data (soil moisture, light, temperature, soil nutrients, etc.) are available from the Dryad Digital Repository http://dx.doi.org/10.5061/ dryad.1b433 (Katz & Iba~nez 2016).
References
Adams, J.M. & Zhang, Y. (2009) Is there more insect folivory in warmer tem-perate climates? A latitudinal comparison of insect folivory in eastern North America.Journal of Ecology,97, 933–940.
Adams, J.M., Rehill, B., Zhang, Y. & Gower, J. (2008) A test of the latitudinal defense hypothesis: herbivory, tannins and total phenolics in four North American tree species.Ecological Research,24, 697–704.
Alexander, H.M., Price, S., Houser, R., Finch, D. & Tourtellot, M. (2007) Is there reduction in disease and pre-dispersal seed predation at the border of a host plant’s range? Field and herbarium studies ofCarex blanda.Journal of Ecology,95, 446–457.
Andersen, P. & Gill, R. (1982) Cox’s regression model for counting processes: a large sample study.Annals of Statistics,10, 1100–1120.
Andersen, K.M., Turner, B.L. & Dalling, J.W. (2014) Seedling performance trade-offs influencing habitatfiltering along a soil nutrient gradient in a tropi-cal forest.Ecology,95, 3399–3413.
Fig. 6.Modelled survival after 5 years for seedlings in control and pesticide treatments (1 SD). Survival estimates include the variability associated with the intercept for each treatment in each region and the average effects of herbivory and disease in each region. Survival is estimated at the average conditions for the following covariates: initial seedling height, light availability and soil moisture. Different letters above different bars denote statistically significant differences, and sample sizes are listed below bars.
Angert, A.L. & Schemske, D.W. (2005) The evolution of species’distributions: reciprocal transplants across the elevation ranges ofMimulus cardinalisand
M. lewisii.Evolution,59, 1671–1684.
Barrett, L.G., Kniskern, J.M., Bodenhausen, N., Zhang, W. & Bergelson, J. (2009) Continua of specificity and virulence in plant host-pathogen interac-tions: causes and consequences.New Phytologist,183, 513–529.
Barton, K.E. & Koricheva, J. (2010) The ontogeny of plant defense and her-bivory: characterizing general patterns using meta-analysis. The American Naturalist,175, 481–493.
Bertheau, C., Brockerhoff, E.G., Roux-Morabito, G., Lieutier, F. & Jactel, H. (2010) Novel insect-tree associations resulting from accidental and intentional biological“invasions”: a meta-analysis of effects on insectfitness.Ecology Letters,13, 506–515.
Boege, K., Barton, K.E. & Dirzo, R. (2011) Influence of tree ontogeny on plant-herbivore interactions.Size and Age Related Changes in Tree Structure and Function, Tree Physiology(eds F.C. Meinzer, B. Lachenbruch & T.E. Dawson), pp. 193–214. Springer Netherlands, Dordrecht, the Netherlands. Boisvert-Marsh, L., Perie, C. & de Blois, S. (2014) Shifting with climate?
Evi-dence for recent changes in tree species distribution at high latitudes. Eco-sphere,5, 1–33.
Br€andle, M., K€uhn, I., Klotz, S., Belle, C. & Brandl, R. (2008) Species richness of herbivores on exotic host plants increases with time since introduction of the host.Diversity and Distributions,14, 905–912.
Cairns, D.M. & Moen, J. (2004) Herbivory influences tree lines.Journal of Ecology,92, 1019–1024.
Callaway, R.M., Bedmar, E.J., Reinhart, K.O., Silvan, C.G. & Klironomos, J. (2011) Effects of soil biota from different ranges on Robinia invasion: acquiring mutualists and escaping pathogens.Ecology,92, 1027–1035. Cleavitt, N.L., Fahey, T.J. & Battles, J.J. (2011) Regeneration ecology of sugar
maple (Acer saccharum): seedling survival in relation to nutrition, site fac-tors, and damage by insects and pathogens. Canadian Journal of Forest Research,41, 235–244.
Connor, E.F., Faeth, S.H., Simberloff, D. & Opler, P.A. (1980) Taxonomic iso-lation and the accumuiso-lation of herbivorous insects: a comparison of intro-duced and native trees.Ecological Entomology,5, 205–211.
Coyle, D., Mattson, W., Friend, A. & Raffa, K. (2014) Effects of an invasive herbivore at the single plant scale do not extend to population-scale seedling dynamics.Canadian Journal of Forest Research,44, 8–16.
Crimmins, S.M., Dobrowski, S.Z., Greenberg, J.A., Abatzoglou, J.T. & Myns-berge, A.R. (2011) Changes in climatic water balance drive downhill shifts in plant species’optimum elevations.Science,331, 324–327.
Davis, M.B. (1983) Quaternary history of deciduous forests of eastern North America and Europe.Annals of the Missouri Botanical Garden,70, 550– 563.
Desprez, J., Iannone, B.V. III, Yang, P., Oswalt, C.M. & Fei, S. (2014) North-ward migration under a changing climate: a case study of blackgum (Nyssa sylvatica).Climatic Change,126, 151–162.
Dietze, M.C. & Matthes, J.H. (2014) A general ecophysiological framework for modelling the impact of pests and pathogens on forest ecosystems.Ecology Letters,17, 1418–1426.
Diez, J.M., Dickie, I., Edwards, G., Hulme, P.E., Sullivan, J.J. & Duncan, R.P. (2010) Negative soil feedbacks accumulate over time for non-native plant species.Ecology Letters,13, 803–809.
Engelkes, T., Morri€en, E., Verhoeven, K.J.F., Bezemer, T.M., Biere, A., Har-vey, J.A., McIntyre, L.M., Tamis, W.L.M. & van der Putten, W.H. (2008) Successful range-expanding plants experience less above-ground and below-ground enemy impact.Nature,456, 946–948.
Fecko, A. (1999)Environmental Fate of Bifenthrin. California Department of Pesticide Regulation, Sacramento, CA, USA.
Ferguson, S. (2004) Effects of poisoning nonindigenous slugs in a boreal forest.
Canadian Journal of Forest Research,34, 449–455.
Fine, P.V.A., Miller, Z.J., Mesones, I., Irazuzta, S., Appel, H.M., Stevens, M.H.H., Schultz, J.C. & Coley, P.D. (2006) The growth-defense trade-off and habitat specialization by plants in Amazonian forests.Ecology,87, 150–162. Fisichelli, N., Frelich, L.E. & Reich, P.B. (2012) Sapling growth responses to
warmer temperatures“cooled”by browse pressure.Global Change Biology,
18, 3455–3463.
Flory, S. & Clay, K. (2013) Pathogen accumulation and long-term dynamics of plant invasions.Journal of Ecology,101, 607–613.
Forister, M.L., Novotny, V., Panorska, A.K., Baje, L., Basset, Y. & Butterill, P.T. (2015) The global distribution of diet breadth in insect herbivores. Pro-ceedings of the National Academy of Sciences of the United States of
Amer-ica,112, 442–447.
Gelman, A. & Hill, J. (2007)Data Analysis Using Regression and Multilevel/ Hierarchical Models. Cambridge University Press, Cambridge, UK.
Geman, S. & Geman, D. (1984) Stochastic relaxation, Gibbs distributions, and the Bayesian restoration of images.IEEE Transactions on Pattern Analysis and Machine Intelligence,6, 721–741.
Gilbert, G.S., Briggs, H.M. & Magarey, R. (2015) The impact of plant enemies shows a phylogenetic signal.PLoS ONE,10, e0123758.
Gilbert, G.S. & Webb, C.O. (2007) Phylogenetic signal in plant pathogen-host range.Proceedings of the National Academy of Sciences of the United States of America,104, 4979–4983.
Graumlich, L.J. & Davis, M.B. (1993) Holocene variation in spatial scales of vegetation patterns in the Upper Great Lakes.Ecology,74, 826–839. Green, P.T., Harms, K.E. & Connell, J.H. (2014) Nonrandom, diversifying
pro-cesses are disproportionately strong in the smallest size classes of a tropical forest.Proceedings of the National Academy of Sciences of the United States of America,52, 18649–18654.
van Grunsven, R.H.A., van der Putten, W.H., Martijn Bezemer, T., Berendse, F. & Veenendaal, E.M. (2010) Plant-soil interactions in the expansion and native range of a poleward shifting plant species.Global Change Biology,
16, 380–385.
Guisan, A. & Zimmermann, N.E. (2000) Predictive habitat distribution models in ecology.Ecological Modelling,135, 147–186.
Herberich, E., Sikorski, J. & Hothorn, T. (2010) A robust procedure for com-paring multiple means under heteroscedasticity in unbalanced designs.PLoS ONE,5, 1–8.
Hicke, J.A., Allen, C.D., Desai, A.R., Dietze, M.C., Hall, R.J., Hogg, E.H.T., Kashian, D.M., Moore, D., Raffa, K.F., Sturrock, R.N. & Vogelmann, J. (2012) Effects of biotic disturbances on forest carbon cycling in the United States and Canada.Global Change Biology,18, 7–34.
Hickling, R., Roy, D.B., Hill, J.K., Fox, R. & Thomas, C.D. (2006) The distri-butions of a wide range of taxonomic groups are expanding polewards. Glo-bal Change Biology,12, 450–455.
HilleRisLambers, J., Clark, J.S. & Beckage, B. (2002) Density-dependent mortality and the latitudinal gradient in species diversity.Nature,417, 732– 735.
HilleRisLambers, J., Harsch, M.A., Ettinger, A.K., Ford, K.R. & Theobald, E.J. (2013) How will biotic interactions influence climate change-induced range shifts?Annals of the New York Academy of Sciences,1297, 112–125. Hothorn, T., Bretz, F. & Westfall, P. (2008) Simultaneous inference in general
parametric models.Biometrical Journal,50, 346–363.
Iba~nez, I., Clark, J.S. & Dietze, M.C. (2009) Estimating colonization potential of migrant tree species.Global Change Biology,15, 1173–1188.
Iverson, L.R. & Prasad, A.M. (1998) Predicting abundance of 80 tree species following climate change in the Eastern United States.Ecological Mono-graphs,68, 465–485.
Iverson, L.R., Prasad, A.M., Matthews, S.N. & Peters, M. (2008) Estimating potential habitat for 134 eastern US tree species under six climate scenarios.
Forest Ecology and Management,254, 390–406.
Katz, D.S.W. (2016) The effects of invertebrate herbivores on plant population growth: a meta-regression analysis.Oecologia,182, 43–53.
Katz, D.S.W. & Iba~nez, I. (2016) Data from: Foliar damage beyond species distributions is partly explained by distance dependent interactions with natu-ral enemies.Dryad Data Repository, http://dx.doi.org/10.5061/dryad.1b433 Kellman, M. (2004) Sugar maple (Acer saccharum Marsh.) establishment in
boreal forest: results of a transplantation experiment.Journal of
Biogeogra-phy,31, 1515–1522.
Levine, J.M., Adler, P.B. & Yelenik, S.G. (2004) A meta-analysis of biotic resistance to exotic plant invasions.Ecology Letters,7, 975–989.
Massad, T.J. (2013) Ontogenetic differences of herbivory on woody and herba-ceous plants: a meta-analysis demonstrating unique effects of herbivory on the young and the old, the slow and the fast.Oecologia,172, 1–10. McCarthy-Neumann, S. & Iba~nez, I. (2012) Tree range expansion may be
enhanced by escape from negative plant-soil feedbacks.Ecology,93, 2637– 2649.
Meiners, S., Handel, S. & Pickett, S. (2000) Tree seedling establishment under insect herbivory: edge effects and inter-annual variation.Plant Ecology,151, 161–170.
Menendez, R., Gonzalez-Megıas, A., Lewis, O.T., Shaw, M.R. & Thomas, C.D. (2008) Escape from natural enemies during climate-driven range expan-sion: a case study.Ecological Entomology,33, 413–421.
Mitchell, C.E., Blumenthal, D., Jarosık, V., Puckett, E.E. & Pysek, P. (2010) Controls on pathogen species richness in plants’ introduced and native ranges: roles of residence time, range size and host traits.Ecology Letters,
13, 1525–1535.
Moorcroft, P.R., Pacala, S.W. & Lewis, M.A. (2006) Potential role of natural enemies during tree range expansions following climate change.Journal of Theoretical Biology,241, 601–616.
Morri€en, E., Engelkes, T., Macel, M., Meisner, A. & Van der Putten, W.H. (2010) Climate change and invasion by intracontinental range-expanding exotic plants: the role of biotic interactions. Annals of Botany, 105, 843–848.
Murphy, H.T., Vanderwal, J. & Lovett-Doust, J. (2010) Signatures of range expansion and erosion in eastern North American trees.Ecology Letters,13, 1233–1244.
Myers, J.A. & Kitajima, K. (2007) Carbohydrate storage enhances seedling shade and stress tolerance in a neotropical forest.Journal of Ecology,95, 383–395. Ness, J.H., Rollinson, E.J. & Whitney, K.D. (2011) Phylogenetic distance can
predict susceptibility to attack by natural enemies.Oikos,120, 1327–1334. Parker, J.D., Burkepile, D.E. & Hay, M.E. (2006) Opposing effects of native
and exotic herbivores on plant invasions.Science,311, 1459–1461. Parker, I.M., Saunders, M., Bontrager, M., Weitz, A.P., Hendricks, R., Magarey,
R., Suiter, K. & Gilbert, G.S. (2015) Phylogenetic structure and host abun-dance drive disease pressure in communities.Nature,520, 542–544. Parmesan, C. & Yohe, G. (2003) A globally coherentfingerprint of climate
change impacts across natural systems.Nature,421, 37–42.
Patot, S., Martinez, J., Allemand, R., Gandon, S., Varaldi, J. & Fleury, F. (2010) Prevalence of a virus inducing behavioural manipulation near species range border.Molecular Ecology,19, 2995–3007.
Patterson, S.L., Zak, D.R., Burton, A.J., Talhelm, A.F. & Pregitzer, K.S. (2012) Simulated N deposition negatively impacts sugar maple regeneration in a northern hardwood ecosystem.Journal of Applied Ecology,49, 155–163. Pearse, I.S. & Hipp, A.L. (2009) Phylogenetic and trait similarity to a native
species predict herbivory on non-native oaks.Proceedings of the National Academy of Sciences of the United States of America,106, 18097–18102. Pearson, R.G. & Dawson, T.P. (2003) Predicting the impacts of climate change
on the distribution of species: are bioclimate envelope models useful?Global Ecology and Biogeography,12, 361–371.
Petit, R.J., Brewer, S., Bordacs, S.et al.(2002) Identification of refugia and post-glacial colonisation routes of European white oaks based on chloroplast DNA and fossil pollen evidence.Forest Ecology and Management,156, 49– 74.
Phillips, B., Brown, G. & Shine, R. (2010a) Life-history evolution in range-shifting populations.Ecology,91, 1617–1627.
Phillips, B., Kelehear, C., Pizzatto, L., Brown, G., Barton, D. & Shine, R. (2010b) Parasites and pathogens lag behind their host during periods of host range advance.Ecology,91, 872–881.
Piao, T., Comita, L.S., Jin, G. & Kim, J.H. (2013) Density dependence across multiple life stages in a temperate old-growth forest of northeast China.
Oecologia,172, 207–217.
Plummer, M. (2003) JAGS: A program for analysis of Bayesian graphical mod-els using Gibbs sampling.Proceedings of the 3rd International Workshop on Distributed Statistical Computing, pp. 1–10. Vienna, Austria.
Plummer, M. (2014)rjags: Bayesian Graphical Models Using MCMC. MCMC, https://cran.r-project.org/web/packages/rjags/rjags.pdf. Accessed 1 Jan 2016 Prasad, A., Iverson, L., Matthews, S., Peters, M. (2007) A Climate Change
Atlas for 134 forest tree species of the Eastern United States (database). Northeastern Research Station US Forest Service, Delaware, OH. http:// www.nrs.fs.fed.us/atlas/tree. Accessed 6 Jan 2014
van der Putten, W.H. (2011) Climate change, aboveground-belowground inter-actions, and species’range shifts.Annual Review of Ecology, Evolution, and Systematics,43, 365–383.
R Core Team (2013)R: A Language and Environment for Statistical Comput-ing. R Foundation for Statistical Computing, Vienna, Austria. https://www.r-project.org. Accessed 1 Jan 2016
Reinhart, K.O., Tytgat, T., Van der Putten, W.H. & Clay, K. (2010) Virulence of soil-borne pathogens and invasion byPrunus serotina.New Phytologist,
186, 484–495.
Renwick, K.M. & Rocca, M.E. (2015) Temporal context affects the observed rate of climate-driven range shifts in tree species.Global Ecology and Bio-geography,24, 44–51.
Samis, K.E. & Eckert, C.G. (2009) Ecological correlates offitness across the northern geographic range limit of a Pacific Coast dune plant.Ecology,90, 3051–3061.
Sinclair, W. & Lyon, H. (2005)Diseases of Trees and Shrubs. Cornell Univer-sity Press, Ithaca, NY, USA.
Spiegelhalter, D.J., Best, N.G., Carlin, B.P. & van der Linde, A. (2002) Baye-sian measures of model complexity andfit.Journal of the Royal Statistical Society,64, 583–639.
Spiers, J.D., Davies, F.T., He, C., Bogran, C.E., Heinz, K.M., Starman, T.W. & Chau, A. (2006) Effects of Insecticides on Gas Exchange, Vegetative and Floral Development, and Overall Quality of Gerbera.HortScience,41, 701–706.
Stanton-Geddes, J. & Anderson, C.G. (2011) Does a facultative mutualism limit species range expansion?Oecologia,167, 149–155.
Suwa, T. & Louda, S.M. (2012) Combined effects of plant competition and insect herbivory hinder invasiveness of an introduced thistle.Oecologia,169, 467–476.
Svenning, J.C., Gravel, D., Holt, R.D.et al.(2014) The influence of
interspeci-fic interactions on species range expansion rates.Ecography,37, 1198–1209. Tsai, Y.-H.E. & Manos, P.S. (2010) Host density drives the postglacial migration of the tree parasite, Epifagus virginiana. Proceedings of the National Academy of Sciences of the United States of America, 107, 17035–17040.
Van der Putten, W. (2003) Plant defense belowground and spatiotemporal pro-cesses in natural vegetation.Ecology,84, 2269–2280.
Van der Putten, W.H., Macel, M. & Visser, M.E. (2010) Predicting species dis-tribution and abundance responses to climate change: why it is essential to include biotic interactions across trophic levels.Philosophical Transactions of the Royal Society: Biology,365, 2025–2034.
Van der Putten, W.H., Vet, L.E.M., Harvey, J.A. & W€ackers, F.L. (2001) Link-ing above- and belowground multitrophic interactions of plants, herbivores, pathogens, and their antagonists.Trends in Ecology & Evolution,16, 547– 554.
Wickham, H. (2009)ggplot2: Elegant Graphics for Data Analysis. Springer, New York, NY, USA.
Williams, J.W., Shuman, B.N., Webb, T., Bartlein, P.J. & Leduc, P.L. (2004) Late-Quaternary vegetation dynamics in North America: scaling from taxa to biomes.Ecological Monographs,74, 309–334.
Wisz, M.S., Pottier, J., Kissling, W.D.et al.(2013) The role of biotic interac-tions in shaping distribuinterac-tions and realised assemblages of species: implica-tions for species distribution modelling.Biological Reviews,88, 15–30. Woodall, C.W., Oswalt, C.M., Westfall, J.A., Perry, C.H., Nelson, M.D. &
Finley, A.O. (2009) An indicator of tree migration in forests of the eastern United States.Forest Ecology and Management,257, 1434–1444. Yamazaki, M., Iwamoto, S. & Seiwa, K. (2009) Distance- and
density-depen-dent seedling mortality caused by several diseases in eight tree species co-occurring in a temperate forest.Plant Ecology,201, 181–196.
Zarnetske, P., Skelly, D. & Urban, M. (2012) Biotic multipliers of climate change.Science,336, 1516–1518.
Zhu, K., Woodall, C.W. & Clark, J.S. (2012) Failure to migrate: lack of tree range expansion in response to climate change.Global Change Biology,18, 1042–1052.
Zhu, Y., Comita, L.S., Hubbell, S.P. & Ma, K. (2015) Conspecific and phylo-genetic density-dependent survival differs across life stages in a tropical for-est.Journal of Ecology,103, 957–966.
Zvereva, E.L. & Kozlov, M.V. (2012) Sources of variation in plant responses to belowground insect herbivory: a meta-analysis. Oecologia,
169, 441–452.
Received 13 October 2015; accepted 31 August 2016 Handling Editor: Matthew Heard
Supporting Information
Additional Supporting Information may be found in the online ver-sion of this article:
Appendix S1.Plot environmental characteristics.
Appendix S2.Seed sources.
Appendix S3.Greenhouse control experiment.
Appendix S4.Vertebrate herbivory.
Appendix S5.Model code.