Accepted Manuscript
This is an Accepted Manuscript of the following article:
L Xie, T Gomes, K A Solhaug, Y Song, K E Tollefsen. Linking mode of action of the model respiratory and photosynthesis uncoupler 3,5-dichlorophenol to adverse outcomes in Lemna minor.
Aquatic Toxicology . Volume 197, 2018, pages 98-108, ISSN 0166-445X.
The article has been publishedin final form by Elsevier at http://dx.doi.org/10.1016/j.aquatox.2018.02.005 © 2018. This manuscript version is made available under the
CC-BY-NC-ND 4.0 license
http://creativecommons.org/licenses/by-nc-nd/4.0/
1 2 3 4 5 6 7 8 9 10 11 12 13 14 15 16 17 18 19 20 21 22 23 24 25 26 27 28 29 30 31 32 33 34 35 36 37 38 39 40 41 42 43 44 45 46 47 48 49 50 51 52 53 54 55 56 57 58 59 60 61 62
Linking mode of action of the model respiratory and
1
photosynthesis uncoupler 3,5-dichlorophenol to adverse
2
outcomes in
Lemna minor
34
Authors: Li Xie1,3*, Tânia Gomes1,3, Knut Asbjørn Solhaug2,3, You Song1,3, Knut Erik
5
Tollefsen1,2,3*
6 1
Norwegian Institute for Water Research (NIVA), Section of Ecotoxicology and Risk 7
Assessment, Gaustadalléen 21, N-0349 Oslo, Norway 8
2
Norwegian University of Life Sciences (NMBU), Faculty of Environmental Sciences and 9
Natural Resource Management (MINA), P.O. Box 5003, N-1432 Ås, Norway 10
3 Centre for Environmental Radioactivity (CERAD), Norwegian University of Life Sciences 11
(NMBU), Post box 5003, N-1432 Ås, Norway 12
13 14
Corresponding author: 15
Li Xie, Norwegian Institute for Water Research (NIVA), Section of Ecotoxicology and Risk 16
Assessment, Gaustadalléen 21, N-0349 OSLO, Norway; Tel: (+47) 40556070, Fax: (+47) 17
221852 00; E-mail address: li.xie@niva.no. 18
Knut Erik Tollefsen. Norwegian Institute for Water Research (NIVA), Section of 19
Ecotoxicology and Risk Assessment, Gaustadalléen 21, N-0349 OSLO, Norway; Tel: (+47) 20
92218466, Fax: (+47) 221852 00; E-mail address: knut.erik.tollefsen@niva.no 21
22 23 *Manuscript
1 2 3 4 5 6 7 8 9 10 11 12 13 14 15 16 17 18 19 20 21 22 23 24 25 26 27 28 29 30 31 32 33 34 35 36 37 38 39 40 41 42 43 44 45 46 47 48 49 50 51 52 53 54 55 56 57 58 59 60 61 24 25 26 27 28 29 30 31 32 33 34 35 36 37 38 39 40 41 42
1 2 3 4 5 6 7 8 9 10 11 12 13 14 15 16 17 18 19 20 21 22 23 24 25 26 27 28 29 30 31 32 33 34 35 36 37 38 39 40 41 42 43 44 45 46 47 48 49 50 51 52 53 54 55 56 57 58 59 60 61 62
Abstract
43Standard chemical toxicity testing guidelines using aquatic plant Lemna minor have been 44
developed by several international standardisation organisations. Although being highly 45
useful for regulatory purposes as focusing on traditional adverse endpoints, these tests 46
provide limited information about the toxic mechanisms and modes of action (MoA). The 47
present study aimed to use selected functional assays in L. minor after exposure to 3,5-48
dichlorophenol (3,5-DCP) as a model to characterize the toxic mechanisms causing growth 49
inhibition and lethality in primary producers. The results demonstrated that 3,5-DCP caused 50
concentration-dependent effects in chloroplast and mitochondria. Uncoupling of oxidative 51
phosphorylation (OXPHOS), reduction in chlorophyll (Chlorophyll a and b) content, 52
reproduction rate and frond size were the most sensitive endpoints, followed by formation of 53
reactive oxygen species (ROS) formation, lipid peroxidation (LPO), carotenoids reduction 54
and impairment of photosynthesis efficiency. Suppression of photosystem II (PSII) efficiency, 55
electron transport rate (ETR), chlorophylls (a and b), oxidative phosphorylation (OXPHOS) 56
was closely correlated while ROS production and LPO were negative correlated to ETR, 57
carotenoid content and growth parameters. A network of conceptual Adverse Outcome 58
Pathways (AOPs) was developed to decipher the causal relationships between molecular, 59
cellular, and apical adverse effects occurring in L. minor to form a basis for future studies 60
with similar compounds. 61
62
Keywords:
Lemna minor, 3,5-dichlorophenol, reactive oxygen species, growth, PSII, 63lipid peroxidation, oxidative phosphorylation, Mode of action, adverse outcome pathway. 64
65 66 67
1 2 3 4 5 6 7 8 9 10 11 12 13 14 15 16 17 18 19 20 21 22 23 24 25 26 27 28 29 30 31 32 33 34 35 36 37 38 39 40 41 42 43 44 45 46 47 48 49 50 51 52 53 54 55 56 57 58 59 60 61
1.
Introduction
68Primary producers such as aquatic plants play a key role in aquatic system and trophic chain 69
since they contribute to oxygen production and regulate the biogeochemical cycling of 70
elements (Cloern et al., 2014; Elser et al., 2007). Their central function in the ecosystem 71
makes these organisms ideal for monitoring the ecosystem health and assessing adverse 72
impact of abiotic and biotic factors on the lower part of the food web. The aquatic vascular 73
plant L. minor, a small freshwater aquatic plant that reproduce rapidly by thalli division to 74
form plant carpets covering still waters worldwide (Mendiola, 1918; Einhellig et al., 1985; 75
Landolt 1975; Landolt 1998), has been used with large success as animal fodder, a 76
bioremediator, and in toxicity testing (Fairchild et al., 1997; Horvat et al., 2007; Kirby and 77
Sheahan, 1994; Ziegler et al., 2016). The popularity of this species is predominantly due to 78
rapid reproductive rates (Cowgill and Milazzo, 1989), ease of culturing under lab conditions 79
and sensitivity to a number of stressors including chemical pollutants such as herbicides, 80
pesticides and metals (Fairchild et al., 1997; Hartman and Martin, 1985; Hou et al., 2007) or 81
environment stressors include changes in temperature, salinity and pH (Haller et al., 1974; 82
Uysal and Taner, 2009). This combination of properties has led to the development of testing 83
guidelines that allow standardised toxicity testing under controlled laboratory conditions 84
(ISO20079, 2005; OECD, 2006). Such testing methods represent key components of 85
chemical hazard assessment, by providing characterisation of the toxic properties of 86
chemicals and identifying potential adverse effects of regulatory relevance. However, these 87
standardised toxicity tests predominantly provide information of the adverse outcome (AO), 88
whereas the toxic mode of action (MoA) are often not addressed in detail. To provide this 89
information, biomarkers based on biochemical assays or physiological responses are 90
frequently used for characterisation of the MoA (Fernandes et al., 2013; Gupta and Huang, 91
2014), whereas approaches such as Adverse Outcome Pathways (AOPs) has been proposed to 92
1 2 3 4 5 6 7 8 9 10 11 12 13 14 15 16 17 18 19 20 21 22 23 24 25 26 27 28 29 30 31 32 33 34 35 36 37 38 39 40 41 42 43 44 45 46 47 48 49 50 51 52 53 54 55 56 57 58 59 60 61 62
provide causal links between the MoA and adverse effects of the stressors (Ankley et al., 93
2010). 94
95
The AOPs represent a framework platform to assemble, evaluate and visualize the chain of 96
events occurring from a molecular initiating event (MiE) occurring at a stressors biological 97
target site, to a series of key events (KEs) at different levels of biological organisation that 98
ultimately leads to the AO at the individual or population level (Villeneuve et al., 2014). The 99
AOPs can thus be used to improve the MoA knowledge and how chemicals cause adversity, 100
to assist bioassay development and develop suitable toxicity testing guidelines. Additionally, 101
AOPs can potentially inform regulatory processes by directing the use of testing resources; 102
perform species screening and prioritization of chemicals and support Integrated Approaches 103
to Testing and Assessment (IATA) (Tollefsen et al., 2014). Despite a substantial AOP 104
development worldwide, none of the over 250 AOPs submitted to the AOP repository, 105
AOPwiki (aopwiki.org, December 2017) focuses specifically on primary producers or address 106
chemicals known to specifically target these environmental keystone species. 107
108
Chlorophenols (CPs), a diverse group of chlorinated phenols, are commonly used as 109
pesticides, disinfectants, and as chemical intermediates in the production of more complex 110
chemicals (Igbinosa et al., 2013). The CPs exhibit a range of toxic MoAs in eukaryotes, 111
whereof some CPs are used as herbicides due to their high toxic potency to aquatic primary 112
producers (Michałowicz and Duda, 2007). The CPs cause growth inhibition in primary 113
producers by disrupting energy metabolism, either by uncoupling oxidative or photosynthetic 114
phosphorylation through inhibiting electron transport on inner membrane of mitochondria 115
and thylakoid (Escher et al., 1996). As a consequence of these toxic properties, CPs such as 116
3,5-dichlorophenol (3,5-DCP) are normally used as positive controls in toxicity testing 117
1 2 3 4 5 6 7 8 9 10 11 12 13 14 15 16 17 18 19 20 21 22 23 24 25 26 27 28 29 30 31 32 33 34 35 36 37 38 39 40 41 42 43 44 45 46 47 48 49 50 51 52 53 54 55 56 57 58 59 60 61
guidelines and studies with algae and aquatic plants (ISO8692:2012, 2012; OECD, 118
2006;OECD, 2011; Michel et al, 2004) or briefly study the toxicity in lemnacase at growth 119
level (Baskar et al, 2016). Effort to characterise the different MoA of CPs in primary 120
producers is thus considered key to understand how other and similar compounds cause 121
effects in aquatic plants and algae. 122
The objectives of this study were to characterize the MoA of 3,5-DCP as a model CP in L.
123
minor and link these cellular perturbations to inhibition of growth and vegetative 124
reproduction. To achieve these goals, a combination of a 7d chronic toxicity test to assess 125
growth inhibition (reproduction, frond area and weight) and MoA studies to characterise 126
changes in key physiological processes (oxidative stress, photosynthetic capacity, oxidative 127
phosphorylation) were conducted. The resulting data were assembled into an AOP framework 128
to identify the key MiE and KEs for the adversity observed. 129
2. Materials and Methods
1302.1. Culture and exposure
131
Test species Lemna minor (Strain ID: 5544, Rutgers Duckweed Stock Cooperative, 132
http://www.ruduckweed.org) was provided by Blases Biological Ltd (Cat.ID: LBA 041, 133
Edenbridge, UK) and cultured at Ghent University (Belgium) (De Schamphelaere et al.,2010; 134
Van Echelpoel et al., 2016) prior to transfer to the Norwegian Institute for water research 135
(NIVA). Upon arrival at NIVA, thalli were disinfected by immersion in 0.5% NaOCl (v/v) for 136
3 min and then rinsing with distilled water for 5 min to remove algae contamination. The L.
137
minor cultures were maintained in 200 ml Erlenmeyer flasks containing 100 ml of Steinberg 138
(SB) medium (with composition: 350 mg/L KNO3, 295 mg/L Ca(NO3)2.4H2O, 90 mg/L 139
KH2PO4, 12 mg/L K2HPO4, 100 mg/L MgSO4.7H2O, 0.12mg/L H3BO3, 0.18 mg/L 140
ZnSO4.7H2O, 0.044 mg/L Na2MoO4.2H2O, 0.18mg/L MnCl2.4H2O, 0.76 mg/L FeCl3.6H2O, 141
1 2 3 4 5 6 7 8 9 10 11 12 13 14 15 16 17 18 19 20 21 22 23 24 25 26 27 28 29 30 31 32 33 34 35 36 37 38 39 40 41 42 43 44 45 46 47 48 49 50 51 52 53 54 55 56 57 58 59 60 61 62
0.15 mg/L EDTA disodium-dihydrate, pH 5.5.) (OECD, 2006). All cultures were kept in a 142
growth chamber for 24h under continuous white light in photosynthetic active radiation (PAR) 143
at 80±5 µmol m−2 s−1 and temperature of 24±2 °C according to the OECD guidelines 221 144
(OECD, 2006), with stock thalli sub-cultured twice a week. The irradiance was measured by 145
a LI-COR quantum sensor ModelLI-190 (Lincoln, Nebraska, USA) connected to a LI-COR 146
LI-250 photometer unit. 147
148
The test chemical 3,5-DCP (Purity 97%, Sigma-Aldrich) was dissolved in dimethylsulfoxide, 149
DMSO (Purity 99.7%, Sigma-Aldrich) and resulting stock solutions (10 mg/L) were stored in 150
the dark at -18 oC until use. Before exposure, the fronds are pre-cultured in the test medium 151
for 14 days (Naumann et al.,2007). Exposure studies were conducted using independent 152
colonies (N=3, 3-4 green fronds each) in glass beakers (100 mL) containing diluted 3,5-DCP 153
(0.5, 1, 1.5, 2, 3, 4, 8 mg/L) with blank controls (SB Medium) and solvent controls (0.1% 154
DMSO) in 50 mL SB Medium. Exposures were performed under the same conditions as 155
culturing and was repeated 3 times for securing samples for analyses. Fronds were sampled 156
after 7 days exposure for the assessment of the toxicity endpoints. 157
158
2.2. Growth rate
159
The growth rate on basis of the fronds number (FN) was calculated according to the equation: 160
, where GRi is the growth rate per day; Nt0 is the fronds number at day t0
161
(the beginning of the experiment); Nti is the fronds number at day ti (i=7); ti-t0 is the time 162
period between ti and t0, expressed in days. The doubling time (T) of FN was calculated using 163
the equation
, where GRi is the growth rate determined as described before. The test
164
was considered valid when the growth rate of FN in the control groups were higher than 165
1 2 3 4 5 6 7 8 9 10 11 12 13 14 15 16 17 18 19 20 21 22 23 24 25 26 27 28 29 30 31 32 33 34 35 36 37 38 39 40 41 42 43 44 45 46 47 48 49 50 51 52 53 54 55 56 57 58 59 60 61 0.275 d-1 (OECD, 2006). 166 167
For measurement of frond area (FA), the total area of floating fronds was determined 168
optically by a digital camera (FinePix S2500HD, Fujifilm, Japan) using a floating scale bar. 169
The frond area in each photograph was analysed using the Image-J software program version 170
1.48 (National Institutes of Health, Maryland, USA). The dry mass (DM) of the fronds was 171
determined gravimetrically after centrifugation of exposed fronds at 3000 rpm for 10 min at 172
room temperature to 20 °C in pre-weighted eppendorf tubes. The fronds were then dried in an 173
oven at 70 °C until constant weight was obtained and DM recorded. 174
175
2.3. Mitochondrial inner membrane potential
176
The mitochondrial inner membrane potential (MMP) was determined using 177
tetramethylrhodamine methyl ester (TMRM, Life Technologies AS, Oslo, Norway) as an 178
indicator of OXPHOS in the fronds (Ehrenberg et al., 1988; Scaduto and Grotyohann, 1999). 179
In brief, stock solutions of TMRM (5 μM) were prepared in DMSO (Purity 99.7%, Sigma-180
Aldrich) and stored under -18oC until use. The MMP assay was optimized for dye 181
concentration and incubation duration on the basis of recommendations for the green algae 182
Chlamydomonas reinhardtii and zebrafish cells (Jamers et al., 2009; Legradi et al., 2014). 183
After exposure, 3 fronds for each replicate (N=3) were transferred to the glass flasks 184
containing 2 mL SB medium prior to the addition of 200 µl TMRM (500 nM) diluted in the 185
SB medium. The fronds were incubated with TMRM for 2h at room temperature. After 186
incubation, the fronds were rinsed with SB medium for 5 minutes to remove free (unbound) 187
TMRM and transferred to a Costar 96-Well Black Clear-Bottom microplate (Corning 188
Incorporated, USA) containing 200 µl SB medium. The fluorescent intensity of TMRM was 189
1 2 3 4 5 6 7 8 9 10 11 12 13 14 15 16 17 18 19 20 21 22 23 24 25 26 27 28 29 30 31 32 33 34 35 36 37 38 39 40 41 42 43 44 45 46 47 48 49 50 51 52 53 54 55 56 57 58 59 60 61 62
measured using VICTOR 3 fluorometer (PerkinElmer) with the excitation wavelength of 190
530nm and emission wavelength of 590 nm. The natural fluorescence of the exposure media 191
in combination with the dye (without presence of Lemna fronds) was also analyzed and the 192
resulting fluorescence subtracted. The relative fluorescence obtained was normalized by 193
weight of test frond and expressed as fold induction comparative to the control. 194
195
2.4. Reactive oxygen species (ROS) formation
196
2′,7′-Dichlorofluorescein diacetate (H2DCFDA) (Molecular Probes Inc., Eugene, OR, USA) 197
was used to quantify the ROS (H2O2, O2 −
and 1O2) in L. minor (Razinger et al., 2010). The 198
stock solutions of H2DCFDA (10 mM) was prepared in DMSO and stored at -18 °C until use. 199
After exposure to 3,5-DCP, the fronds were immersed in H2DCFDA diluted in the culture 200
medium to a final concentration of 50 μM (maximum DMSO concentration: 0.5%). After 2 h 201
incubation, the fronds were rinsed using clean growth medium for 5 minutes to remove 202
excess dye. Clean fronds were subsequently transferred to a black Costar 96-well polystyrene 203
microplate with clear-bottom (Corning Incorporated, USA) containing 200 µl of culture 204
medium. The fluorescence signal of H2DCFDA was measured using a microplate reader 205
(VICTOR 3, PerkinElmer, Waltham, Massachusetts, USA) with excitation wavelength of 485 206
nm and emission wavelength of 538 nm. The natural fluorescence of the exposure media in 207
combination with the dye (without presence of fronds) was also analyzed and the resulting 208
fluorescence subtracted. The relative fluorescence obtained was normalized by weight of test 209
frond expressed as fold induction comparative to the control. 210
211
2.5. Lipid peroxidation
212
Lipid peroxidation of exposed fronds was assessed by determining malondiadehyde (MDA), 213
1 2 3 4 5 6 7 8 9 10 11 12 13 14 15 16 17 18 19 20 21 22 23 24 25 26 27 28 29 30 31 32 33 34 35 36 37 38 39 40 41 42 43 44 45 46 47 48 49 50 51 52 53 54 55 56 57 58 59 60 61
an product of lipid peroxidation following decomposition of polyunsaturated fatty acid 214
peroxides, using the TBARs method (Zezulka et al., 2013). Around 5 mg of fresh mass of 215
exposed fronds were homogenized in 1 ml of 0.25% (w/v) 2-thiobarbituric acid (TBA, 216
Sigma-Aldrich) in 10% trichloroacetic acid (TCA, Sigma-Aldrich) and incubated at 95 ºC for 217
30 min. The samples were then cooled to room temperature in an ice bath for 10 min. and 218
centrifuged at 10,000g at 4 ºC for 10 min. The absorbance of the supernatant was recorded at 219
532 nm and corrected for non-specific turbidity by subtracting the absorbance at 600 nm. In 220
addition, absorbance at 400 nm was also recorded to avoid the signal interruption from 221
carbohydrates. A blank containing 0.25% TBA in 10% TCA was also analysed and subtracted 222
from each sample absorbance. The content of MDA was presented as µmol g-1 using an 223
extinction coefficient of 155 nmol-1 cm-1 and calculated as a fold difference compared to the 224 control. 225 226 2.6. Pigments content 227
Pigment content was determined spectrophometrically essentially as described by Ritchie et 228
al. (2006). In brief, 25 mg of fresh fronds were submerged in 2 ml methanol (Purity:99.9%, 229
Sigma-Aldrich) overnight, the absorbance of the extracts was determined by a UV-vis 230
spectrophotometer Lamdba 40 (PerkinElmer, Waltham, USA) at wavelength of 652 nm 231
(chlorophyll a, A652), 665 nm (chlorophyll b, A665) and 470 nm (carotenoids, A470). The 232
individual levels of chlorophyll a (Chl a), chlorophyll b (Chl b) and carotenoids was 233
calculated by the following equations (Sumanta et al., 2014): 234
235
Chl a (µg/ml)=16.72×A665 – 9.16×A652 (eq. 1) 236
Chl b (µg/ml)=34.09×A652 – 15.28×A665 (eq. 2)
1 2 3 4 5 6 7 8 9 10 11 12 13 14 15 16 17 18 19 20 21 22 23 24 25 26 27 28 29 30 31 32 33 34 35 36 37 38 39 40 41 42 43 44 45 46 47 48 49 50 51 52 53 54 55 56 57 58 59 60 61 62
Total carotenoids (µg/ml)=(1000×A470 – 1.63×Chl a – 104.96×Chl b)/221 (eq. 3) 238
239
2.7. Chlorophyll fluorescence
240
Photosynthetic capability of L. minor was determined as Pulse-Amplitude-Modulated (PAM) 241
chlorophyll fluorescence kinetics using a PAM 2000 (Walz, Effeltrich, Germany). Plants 242
were first maintained in the dark for 30 min prior to allow complete oxidation of PSII centers 243
and initial fluorescence (Fo) was measured under weak modulated illumination 244
(1 μmol m−2 s−1). The measurement of maximal fluorescence (Fm) was obtained by applying a 245
saturating light pulse (5000 μmol m−2 s−1, 0.8 s), whereas the Minimal and Maximal 246
fluorescence yield of illuminated sample (Ft and Fm′) were determined at the equilibrium 247
state of electron transport after 10 min of continuous illumination (PAR=80 μmol m−2 s−1). 248
All fluorescence yields (Fo, Fo′, Fm, Fm′, and Ft) were used to calculate the maximum quantum 249
yield (Fv/Fm) and the quantum yield of photochemical energy conversion in PSII (Fv′/Fm′)
250
essentially as described by Maxwell (2000). The photosynthetic electron transport rate (ETR) 251
was calculated using the formula 0.5 × PAR × Abs × ΦPSII. The multiplying factor of 0.5 252
assumed that 50% of the absorbed photosynthetically active radiation (PAR) is distributed to 253
PSII (Laisk and Loreto, 1996) and the absorbance (Abs) theoretically assumed that 84% of 254
the incident photons of photosynthetically active radiation is absorbed by a typical green leaf 255
(Perkins et al., 2002). The non-photochemical quenching (NPQ) was calculated according to 256
method by Bilger et al. (1995) under the exposure condition (PAR=80 μmol m−2 s−1) using Eq. 257
4. All results of parameters were expressed as fold induction comparative to the control. 258
259
NPQ=(Fm-Fm′)/Fm′ (eq. 4)
260 261
1 2 3 4 5 6 7 8 9 10 11 12 13 14 15 16 17 18 19 20 21 22 23 24 25 26 27 28 29 30 31 32 33 34 35 36 37 38 39 40 41 42 43 44 45 46 47 48 49 50 51 52 53 54 55 56 57 58 59 60 61
2.8. Fluorescence microscopy imaging
262
The fluorescence from the photosynthetic chloroplast (red fluorescence) and H2DCFDA 263
loading in cells (yellow/green fluorescence) was observed under a fluorescence microscope 264
(Olympus IX 71, Tokyo, Japan). The light was applied by a high intensity fluorescence 265
illumination system (X-Cite 120, Excelitas Technologies Corp., Fremont, Canada) and 266
images were captured using the software Cell∧D (Olympus, Tokyo, Japan). 267
268
2.9. Statistical analysis
269
The results for each endpoint were calculated as fold difference compared to the control and 270
presented as the mean of three replicates with standard error (Mean±SEM). Statistical 271
significance between groups was determined using a one-way analysis of variance (ANOVA) 272
followed by Tukey’s post-hoc test after data were assessed for normality by the Shapiro-Wilk 273
and KS normality testing. Concentration-response curves were calculated using GraphPad 274
Prism version 6 (Graphpad Software, California, USA). Concentrations that caused 50% 275
effect (EC50), no-observed-effect-concentration (NOEC) and low-observed-effect-276
concentration (LOEC) were determined on basis of resulting concentration-response 277
relationships. A principal component analysis (PCA) was applied to the overall data to assess 278
relationships between parameters using XLStat2015 (Addinsoft, Paris, France). The same 279
software was used to calculate Pearson’s correlation to measure the strength of association 280
between the endpoints determined in L. minor. Statistical significance was set at p<0.05. 281 282
3. Results
283 3.1 Growth inhibition 2841 2 3 4 5 6 7 8 9 10 11 12 13 14 15 16 17 18 19 20 21 22 23 24 25 26 27 28 29 30 31 32 33 34 35 36 37 38 39 40 41 42 43 44 45 46 47 48 49 50 51 52 53 54 55 56 57 58 59 60 61 62
The fronds reproduction rate of L. minor in the solvent control and the blank control (FN) 285
was 0.372±0.024 d−1 and 0.374±0.035 d−1, respectively. No significant differences between 286
solvent and blank control were identified. In addition, reproduction rates in both solvent and 287
blank control were above the validity limit for the OECD 221 test guideline (average specific 288
growth rate of 0.275d-1; OECD, 2006). For all growth parameters, significant changes in 289
fronds number (FN) and fronds area (FA) were identified after 7d exposure to as low as 1 290
mg/L 3,5-DCP, while total fronds dry mass (DM) displayed large variation below 2 mg/L (Fig. 291
1). Inhibition of growth-related variables (FN, FA and DM) occurred in a concentration-292
dependent manner with the NOECs typically observed at 0.5-1 mg/L and with EC50 values 293
for FN, FA and DM of 2.20±0.01, 1.45±0.13 and 1.92±0.27 mg/L (Table 2), respectively. Full 294
growth inhibition (100%) occurred at 4-8 mg/L of 3,5-DCP (Fig. 1). 295
296
3.2 Mitochondrial membrane potential
297
Results from the TMRM assay showed clear concentration-dependent decrease in MMP in L.
298
minor fronds after 7-day exposure to 3,5-DCP (Fig. 2.A). Significant dissipation of MMP was 299
observed at higher 3,5-DCP concentrations (1.5-4 mg/L) with an EC50 of 1.41±0.47 mg/L 300
(Table 2). The highest 3,5-DCP concentration (8 mg/L) resulted in 100% mortality and results 301
was thus excluded from the analyses. 302
3.3 oxidative stress
303
3,5-DCP caused a concentration-dependent induction of ROS formation from 0.5 to 3 mg/L 304
(EC50= 1.52 mg/L) in L. minor (Fig. 2B, Table 2), with highest ROS levels observed at 2 and 305
3 mg/L. The levels of lipid peroxidation (LPO) also displayed a concentration-dependent 306
response (Fig. 2.C). Similarly, to ROS formation, the MDA levels increased at concentrations 307
higher than 1 mg/L 3,5-DCP (EC50= 1.41 mg/L). Both ROS and MDA reached a plateau at 308
1 2 3 4 5 6 7 8 9 10 11 12 13 14 15 16 17 18 19 20 21 22 23 24 25 26 27 28 29 30 31 32 33 34 35 36 37 38 39 40 41 42 43 44 45 46 47 48 49 50 51 52 53 54 55 56 57 58 59 60 61
1.5-3 mg/L 3,5-DCP, with no significant increase in response at higher concentrations. 309
Complete growth inhibition precluded the analysis of these two endpoints at the highest 310
concentration tested (8 mg/L). 311
Using fluorescence microscopy imaging, red photosynthetic fluorescence (Fig. 3.D) and 312
green-yellow ROS probe (H2DCFDA) fluorescence (Fig. 3E) was clearly observed under 313
fluorescent microscope. After exposure to 3,5-DCP, increased ROS fluorescence at the distal 314
(Fig.3B) and whole (Fig.3C) fronds were typically observed. The increase in ROS 315
fluorescence was inversely proportional to the photosynthetic fluorescence, as seen in the 316
shift between the distribution of red versus green-yellow fluorescence in the control (Fig. 3A) 317
and exposed fronds. The ROS fluorescent appeared to be spatially distributed with the highest 318
levels detected at the base of the frond (Fig. 3B). 319
3.3 Pigments
320
A concentration-dependent decrease in chl a, chl b and carotenoids was observed in L. minor
321
after 7-days exposure to 3,5-DCP (Fig. 4). A significant reduction was already observed at 1 322
mg/L (LOEC) for both chl a and chl b, with EC50 at 1.31 and 1.41 mg/L (Table 2), 323
respectively. A significant decrease in on carotenoids content was detected at exposure 324
concentrations over 2 mg/L (EC50=2.60±0.42 mg/L). At the highest concentration tested, no 325
chlorophyll (a or b) and carotenoids were measured due to complete necrosis and/or cell dead 326
of most fronds. 327
3.4. Chlorophyll a fluorescence
328
A concentration-dependent decrease in initial fluorescence (Fo) of PSII was demonstrated in L.
329
minor after exposure to 3,5-DCP (EC50=2.53±0.25 mg/L), whereof significant differences 330
from control was observed at 3 mg/L and maximal fluorescence (Fm) was significantly 331
decreased at 1.5 mg/L (Fig. 4 and Table 2). Concentration-dependent decrease was also 332
1 2 3 4 5 6 7 8 9 10 11 12 13 14 15 16 17 18 19 20 21 22 23 24 25 26 27 28 29 30 31 32 33 34 35 36 37 38 39 40 41 42 43 44 45 46 47 48 49 50 51 52 53 54 55 56 57 58 59 60 61 62
observed in both maximum quantum yield of PSII (Fv/Fm, EC50=1.81±0.05 mg/L) and ETR 333
(EC50=1.42±0.04 mg/L). Compared to Fv/Fm (LOEC=1.5 mg/L), ETR (LOEC=1 mg/L) was 334
identified as the more sensitive endpoint when exposed to 3,5-DCP (Table.1). A significant 335
and enhanced NPQ yield was observed in L. minor after exposure to 1 mg/L 3,5-DCP, 336
followed by a reduction at higher concentrations. A clear concentration-dependent inhibition 337
of the photosynthetic electron transport rate (ETR) was also identified (EC50= 1.42±0.04 338
mg/L). The different parameters of chlorophyll a fluorescence were below the threshold for 339
quantification at concentrations above 4 mg/L due to complete inhibition of growth. 340
3.5. Principal component analysis
341
A PCA was applied to the data to decipher potential causal relationships between the 342
determined endpoints (Fig. 7). The two highest concentrations used in this study (4 and 8 343
mg/L 3,5-DCP) were excluded from the PCA analysis due to complete necrosis and/or cell 344
dead of most fronds. The PC1 shows a clear separation between the 3 lowest and the 3 345
highest concentrations of 3,5-DCP in the first axis that explained 84.2% of the total variance. 346
Photosystem II performance, pigments content (Chl a, b and carotenoids), oxidative 347
phosphorylation and frond number, area and DM were the variables best explaining PC1 and 348
most sensitive at the lower 3,5-DCP concentrations. At concentrations higher than 1.0 mg/L, 349
ROS and LPO levels were more responsive endpoints and parameters were directly 350
associated, showing the capacity of 3,5-DCP to inflict oxidative stress in L. minor. At these 351
concentrations, the remaining variables were significantly inhibited, especially at 352
concentration of 3 mg/L and higher. PC1 also displayed a negative association between ROS 353
formation and frond number and DM, ETR, pigments content (carotenoids, Chl a and b) and 354
OXPHOS. A similar association was found for LPO, especially with frond number, Chl a and 355
Chl b and ETR. The PC2, explaining only 11.2% of total variance, distinguished between the 356
1 2 3 4 5 6 7 8 9 10 11 12 13 14 15 16 17 18 19 20 21 22 23 24 25 26 27 28 29 30 31 32 33 34 35 36 37 38 39 40 41 42 43 44 45 46 47 48 49 50 51 52 53 54 55 56 57 58 59 60 61
responses obtained for photosystem performance, pigments content, growth inhibition 357
parameters and oxidative phosphorylation, particularly those associated with the two lowest 358
3,5-DCP concentrations used in this study. The two main groups separated by PC2 were NPQ, 359
frond area, Fo and Fv/Fm from that of frond number and DM, OXPHOS, Fm, Chl a and Chl b 360
and ETR. 361
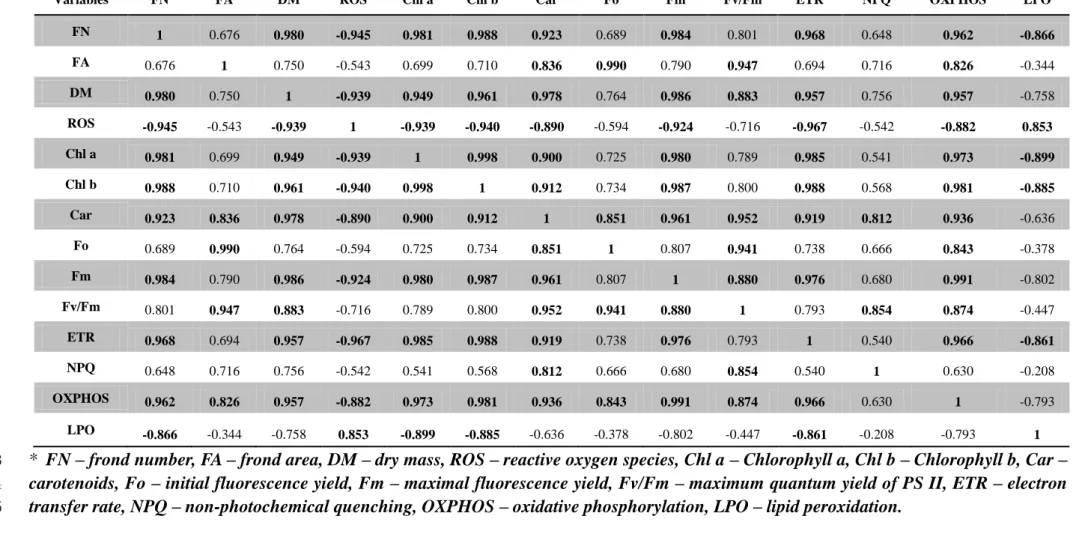
The Pearson correlation analysis showed several significant positive and negative correlations 362
between the endpoints measured in L. minor exposed to 3,5-DCP (Table 1). Similarly, to the 363
PCA analysis, the two highest concentrations of 3,5-DCP were excluded from this analysis. 364
Frond number was positively correlated with DM of fronds, pigments contents (Chl a, b and 365
carotenoids), Fm, ETR and OXPHOS and negatively correlated with LPO and ROS formation. 366
Positive correlations were found between frond area, carotenoids content, Fo, Fv/Fm and 367
OXPHOS. DM was positively correlated with all endpoints except for frond area, Fo and 368
NPQ. ROS formation was negatively correlated with frond´s DM, pigments content, Fm, 369
ETR and OXPHOS and positively correlated with LPO. The Chl a and Chl b contents were 370
positively correlated with carotenoids content, Fm, ETR and OXPHOS, but negatively 371
correlated with LPO. Carotenoids content was positively correlated with all variables related 372
to PSII performance and OXPHOS. Fo was positively correlated with Fv/Fm while Fm was 373
correlated with Fv/Fm, ETR and OXPHOS. A positive and significant correlation was found 374
between ETR and OXPHOS, as well as Fv/Fm with NPQ and OXPHOS. A negative 375
correlation was also found between ETR and LPO. 376
4. Discussion
377
In most phytotoxicity tests, growth inhibition, as well as parameters such as frond size, 378
pigment content, chlorosis and necrosis are evaluated to provide regulatory relevant 379
information (ISO20079, 2005; Kumar and Han, 2010; OECD, 2006). However, the MoA 380
1 2 3 4 5 6 7 8 9 10 11 12 13 14 15 16 17 18 19 20 21 22 23 24 25 26 27 28 29 30 31 32 33 34 35 36 37 38 39 40 41 42 43 44 45 46 47 48 49 50 51 52 53 54 55 56 57 58 59 60 61 62
associated with the adverse effects observed are not always provided, and results in lack of 381
knowledge of toxicity mechanisms triggered by a stressor. This study provided a 382
comprehensive assessment of potential MoAs of the chemical 3,5-DCP in terms of the 383
uncoupling capacity and oxidative stress in L. minor as a representative aquatic primary 384
producer. The studies conducted were aiming at providing mechanistic insight into how 385
OXPHOS uncouplers interfere with key processes in the mitochondria and chloroplasts to 386
cause growth inhibition. 387
The results from the studies clearly showed that 3,5-DCP caused a concentration-dependent 388
change in all parameter studied (Table 2), and that many of these processes were strongly 389
correlated (Fig.7, Table 2). In-depth review of the different parameters and their internal 390
dependence are presented in subsequent sections to characterise the causal relationship 391
between potential MoA and adversity. 392
4.1 Growth inhibition
393
In this study, the adverse effects of 3,5-DCP on survival, growth and associated physiological 394
variables in L. minor were identified using a standard 7-days toxicity testing protocol 395
(OECD,2006). Growth rate of L. minor in the control groups (Fig. 1) demonstrated that the 396
plants were cultured under satisfactory conditions and that the use of solvents did not affect 397
the outcome of the studies. 3,5-DCP was found to be a potent inhibitor of L. minor growth by 398
reducing fronds number (frond production as a measure of reproductive rate), fronds size and 399
DM (Fig. 1). Frond area were identified as the most sensitive growth-related endpoint in this 400
test when comparing EC50 values, closely followed by fronds number and DM (Table 2).
401
Albeit fronds area was the more sensitive parameter in this study, fronds number has been 402
recommended as the better toxicity indicator in L. minor exposed to metals and organics 403
(Mitsou et al., 2006), likely due to the fact that chemically-induced changes in cell volume 404
1 2 3 4 5 6 7 8 9 10 11 12 13 14 15 16 17 18 19 20 21 22 23 24 25 26 27 28 29 30 31 32 33 34 35 36 37 38 39 40 41 42 43 44 45 46 47 48 49 50 51 52 53 54 55 56 57 58 59 60 61
may also affect the fronds area (Severi and Fornasiero, 1983; Tsukaya, 2003). Good 405
coherence between the CRCs of frond number and DM, and the observed higher sensitivity 406
of fronds area support that this was also the case for 3,5-DCP in L. minor. 407
4.2 Uncoupling of OXPHOS and photophosphorylation
408
Oxidative phosphorylation and photophosphorylation produce ATP as a primary source of 409
energy in photosynthetic organism by the mitochondria and the chloroplast. Respiratory 410
uncoupler such as chlorophenols, nitrophenols, and catechol chlorocatechols have been 411
reported to inhibit ATP by interfere with the coupling between electron transport and 412
phosphorylation reactions (Michel et al., 2004; Penttinen, 1995). Based on this mechanism, 413
3,5-DCP could be an inhibitor of mitochondrial respiration as well as photosynthesis by 414
interfering with the energy-transduction by the inner mitochondrial membrane and thylakoids 415
through uncoupling of OXPHOS and photophosphorylation (Plengvidhya and Burris, 1965). 416
The observations that the MMP was among the most sensitive endpoints analysed (Fig. 2A), 417
support that uncoupling of OXPHOS and photophosphorylation may be key to understanding 418
3,5-DCP toxicity. Additionally, mitochondrial dysfunction due to ROS activated programmed 419
cell death (Murphy, 2013; Wang et al., 2013) may enhance the toxicity as seen by an increase 420
in mortality at high 3,5-DCP (>4 mg/L) concentrations (Fig.2, A and Table.1). These 421
observations seem to cohere with previously reported effects of the potent uncoupler carbonyl 422
cyanide m-chlorophenyl hydrazine (CCCP) in plants cells (Dzyubinskaya et al., 2006). 423
424
From PCA results (Table.1), the positive correlations found between the reduction of MMP, 425
pigment content, NPQ and growth in L. minor, indicated that besides the direct action of 3,5-426
DCP on these organelles, mitochondrial dysfunction may interfere with the light energy 427
pathway (NPQ) in thylakoid. In consequence, the dysfunction of both organelles may lead to 428
1 2 3 4 5 6 7 8 9 10 11 12 13 14 15 16 17 18 19 20 21 22 23 24 25 26 27 28 29 30 31 32 33 34 35 36 37 38 39 40 41 42 43 44 45 46 47 48 49 50 51 52 53 54 55 56 57 58 59 60 61 62
growth inhibition due to reduction of ATP synthesis. 429
4.4 Oxidative stress and cellular damage
430
Endogenous ROS are usually produced as a consequence of aerobic metabolic processes in 431
plants, such as photosynthesis and respiration and rapidly eliminated by the antioxidant 432
defence mechanism (Gamble and Burke, 1984; Gechev et al., 2006; Rabilloud et al., 2001). 433
Excessive formation of ROS by exposure to toxicants may lead to cellular oxidative stress, 434
DNA damage and programmed cell death (Agarwal and Said, 2005; Barzilai and Yamamoto, 435
2004). This study confirmed that exposure to 3,5-DCP caused induction of ROS formation in 436
L. minor (Fig. 2B and Fig. 3). This induction of ROS formation may be directly caused by 437
uncoupling of OXPHOS and photophosphorylation or indirectly enhanced by a malfunction 438
in the PSII, in which high energy triplet chlorophyll can enhance the formation of singlet 439
oxygen and increase the chance of O2 to receive electrons from PS I and form superoxide 440
radicals (Asada, 2006). These superoxide radicals can rapidly form hydrogen peroxide (H2O2) 441
via the action of the antioxidant enzyme superoxide dismutase, but if not rapidly detoxified, 442
it can give rise to the highly reactive hydroxyl radical (Asada, 2006; Mittal et al., 2012). As a 443
phenolic compound, 3,5-DCP likely caused direct ROS formation and potentially caused 444
oxidative damage as observed in primary producers elsewhere (Luo et al., 2005; Michałowicz 445
et al., 2009; Michałowicz et al., 2010). 446
When the levels of ROS exceed the capacity of the antioxidant system to counteract them, 447
oxidative damage can occur in several cellular components as lipids, proteins, and DNA 448
(Jambunathan, 2010; Salmon et al., 2004). Lipid peroxidation (LPO) in particular, is a 449
process by which oxyradicals attack polyunsaturated fatty acids present in the cellular 450
membrane, causing a chain reaction during which the lipid will be further degraded into lipid 451
hydroperoxides (Halliwell and Gutteridge, 2015; Repetto et al., 2012). Accordingly, the 452
1 2 3 4 5 6 7 8 9 10 11 12 13 14 15 16 17 18 19 20 21 22 23 24 25 26 27 28 29 30 31 32 33 34 35 36 37 38 39 40 41 42 43 44 45 46 47 48 49 50 51 52 53 54 55 56 57 58 59 60 61
determination of LPO levels (or its by-products) can be used as an indicator of oxidative 453
damage and assess the overall efficiency of the antioxidant system of organisms exposed to 454
different stressors. This association between ROS formation and LPO was further confirmed 455
by the PCA, where a positive correlation between both endpoints confirms the oxidative 456
stress caused by 3,5-DCP. 457
4.5 Pigments
458
Alterations in photosynthetic pigments content (Chlorophyll a, b and carotenoids) have been 459
indicated as reliable indicators of pollutant toxicity in plants (Einhellig and Rasmussen, 1979; 460
Wang and Freemark, 1995). Chlorophyll contents were reduced by 3,5-DCP at concentrations 461
as low as 1 mg /L (Fig. 4 A, B and Table.1). Chlorophyll plays an important role in light 462
harvest complex where chlorophyll b is a part of antenna pigments and chlorophyll a is 463
known as the core pigments (Thomber 1975). Decreased chlorophylls concentration indicate 464
a reduction of light energy absorbing capacity in LHC and consequently reduced ETC 465
activity that lead to the reduction of light reaction active. (Flagella et al., 1994; Jiang et al., 466
2008; Yusuf et al., 2010). 467
Unlike chlorophyll, reduction of carotenoids content was only observed at 3,5-DCP 468
concentration over 2 mg/L (Fig.4C and Table.1). Carotenoids, which primary role is to act as 469
accessory light-harvesting pigments, may also protect the photosynthetic apparatus from 470
oxidative damage (Young and Britton, 1990). Many studies reported that oxidative stress is 471
one of the most important regulatory mechanisms in photosynthesis (Triantaphylidès and 472
Havaux, 2009; Tripathy and Oelmüller, 2012). However, excessive ROS formation in the 473
chloroplast can enhanced degradation of chlorophyll through oxidation (Vass, 2012). 474
Additionally, phenolic compounds can reduce chlorophyll content by interfering with the 475
chlorophyllase activity that regulate the degradation of chlorophyll (Yang et al., 2002). 476
Increased oxidative stress can also interrupt carotenoid formation and degradation by 477
1 2 3 4 5 6 7 8 9 10 11 12 13 14 15 16 17 18 19 20 21 22 23 24 25 26 27 28 29 30 31 32 33 34 35 36 37 38 39 40 41 42 43 44 45 46 47 48 49 50 51 52 53 54 55 56 57 58 59 60 61 62
modulating enzymes involved in carotenoids synthesis (Chang et al., 2013), whereas the 478
resulting increase in ROS-related hydrogen peroxide (H2O2) can oxidize a wide range of 479
molecules inside the chloroplast (Borisova et al., 2012), including the carotenoids themselves 480
(Lopez-Serrano and Ros Barceló, 1999). In addition, reduced content of carotenoids may 481
enhance ROS formation, as some carotenoids (such as lutein, violaxanthin, β-carotene and 482
etc.) can quench ROS or the triplet state of chlorophyll to prevent singlet oxygen formation 483
(Dreuw et al., 2005). The reduced content of carotenoids may thus indicate potential 484
accumulation of damage from oxidative stress. A close relationship between pigments content 485
(Chl a and b and carotenoids), oxidative stresses (ROS and LPO) was also detected in the 486
PCA, where a strong negative correlation was observed between these endpoints, thus 487
reinforcing the negative impact of 3,5-DCP in the photosynthetic apparatus of L. minor and 488
its relation to oxidative stress. 489
Moreover, decreased chlorophyll content may also be caused by the reduction of chlorophyll 490
biosynthesis due to inhibition of ATP production. In the chlorophyll biosynthetic reaction 491
processes in chloroplast, ATP is essential for conversion of glutamate to glutamyl-transfer 492
RNA (tRNA) and the production of Mg-protoporphyrin IX which ultimately form 493
chlorophylls (Willows, 2006). 494
495
4.3 Interference with photosynthetic capacity
496
In recent years, the use of rapid and sensitive bioindicators of plant stress in response to 497
different type of stressors has been growing, especially those related to photosystem 498
performance (Kumar and Han, 2010). The most frequently used parameter to assess PSII 499
performance is the maximum quantum efficiency of primary photochemistry, but other 500
parameters such as the operational plant capacity to convert light energy into chemical energy 501
such as NPQ are very useful to assess the health state of plants (Eullaffroy and Vernet, 2003; 502
1 2 3 4 5 6 7 8 9 10 11 12 13 14 15 16 17 18 19 20 21 22 23 24 25 26 27 28 29 30 31 32 33 34 35 36 37 38 39 40 41 42 43 44 45 46 47 48 49 50 51 52 53 54 55 56 57 58 59 60 61
Mallick and Mohn, 2003). However, there is lack of knowledge about the effects of 503
OXHPOS and photophosphorylation uncouplers in L. minor. In this study, maximal quantum 504
yield (Fv/Fm) was significantly suppressed after 7d exposure to 3,5-DCP. In photosynthetic 505
organisms, the formation of ROS and oxidative damage to chloroplast and thylakoids 506
membranes can also lead to a decrease in PSII photosynthetic efficiency and the content of 507
chlorophyll and carotenoids (Nishiyama et al., 2006). Several studies also showed that 508
oxidative stress in chloroplast can cause PSII inhibition as high ROS content in chloroplast 509
reduce D1 protein synthesis and inhibit repair of PSII (Nishiyama et al., 2006). This 510
reduction was also in agreement with the reduction in relative ETR, which normally 511
represents the rate of electrons pumped via PSII into the photosynthetic chain (Schreiber et 512
al., 2012). The decrease in ETR was potentially also due to inhibition of the PSII donor sites, 513
as phenols can bind to hydroxylamine and interaction with the 41-KDa protein (Pfister and 514
Schreiber, 1983; Strasser, 1997). For example, some phenolic herbicides such as Ioxynil had 515
been reported to inhibit ATP synthesis due to their direct binding to the major protein 516
complexes in the ETC and block the electron flow (Schreiber et al., 2007). Minimal and 517
maximal fluorescence intensity (Fo and Fm) are strongly relative to excitation rate of the 518
photoreaction centres which are associated with antenna pigments complexes (Baker, 2008). 519
The damage of PSII, especially in D1 protein due to ROS enhancement might have caused 520
the reduction of Fm (Guenther and Melis, 1990; Roach and Krieger-Liszkay, 2014) at low 3,5-521
DCP concentarion (1mg/l), as the Fo value was not affected at this concentration. Thus, PSII 522
inhibition is likely caused by the concentration-dependent reduction of the Fm value at low to 523
intermediate concentrations, whereas changes to Fo only occurred at higher concentrations. 524
This was supported by the PCA results, where PSII parameters were strongly negative 525
correlated to ROS formation and LPO. 526
Among all antioxidant actions in the chloroplast, non-photochemical quenching (NPQ) of 527
1 2 3 4 5 6 7 8 9 10 11 12 13 14 15 16 17 18 19 20 21 22 23 24 25 26 27 28 29 30 31 32 33 34 35 36 37 38 39 40 41 42 43 44 45 46 47 48 49 50 51 52 53 54 55 56 57 58 59 60 61 62
chlorophyll fluorescence is thought to be the key regulatory and photoprotective mechanism 528
against oxidative stress in photosynthetic organisms (Lambrev et al., 2012). In this study, 529
increased NPQ observed at low 3,5-DCP concentrations (0.5-1.5 mg/L) may be protective by 530
either scavenging ROS or quenching the excess energy which can convert ROS to heat 531
(Carbonera et al., 2012; Dall'Osto et al., 2006; Müller et al., 2001). At high 3,5-DCP 532
concentration (over 2 mg/L), reduction of NPQ might be explain by the direct oxidative 533
damage to PSII reaction centres (Lawlor and Tezara, 2009). 534
4.4 Identification of the main MoAs and correlation between different parameters.
535
The responses and effects observed in the current study suggest that 3,5-DCP display both 536
concentration-dependent and target-specific MoAs that seem to be causally related. Some 537
endpoints including growth, ETR, chlorophyll content and OXPHOS were observed at low 538
concentration (0.5-1 mg/L), which indicate that these endpoints were directly associated with 539
the respiratory and photosynthesis uncoupling activity of 3,5-DCP. High concentration (>1 540
mg/L) effects such as ROS formation, LPO, reduction of carotenoid content and modulation 541
of PSII efficiency, indicated that these endpoints were associated with excessive ROS 542
formation and oxidative damage to key cellular components in L. minor. The current data was 543
used to assemble an initial AOP network connecting the different MoAs and toxicity 544
pathways to the apical (adverse) effect (Fig. 7). The putative network of AOPs were 545
submitted to the AOP repository AOPwiki (https://aopwiki.org) as an initial effort to compile 546
AOPs for the diverse group of CPs in primary producers, to propose a suite of bioassays for 547
future implementation in IATA approaches (Tollefsen et al., 2014) and support development 548
of more mechanistically-focussed hazard and risk assessment initiatives. 549
5. Conclusion
1 2 3 4 5 6 7 8 9 10 11 12 13 14 15 16 17 18 19 20 21 22 23 24 25 26 27 28 29 30 31 32 33 34 35 36 37 38 39 40 41 42 43 44 45 46 47 48 49 50 51 52 53 54 55 56 57 58 59 60 61
The present study exposed L. minor to a model toxicant 3,5-DCP to investigate potential 551
MoA and adverse endpoints in a representative aquatic primary producer. The results 552
indicated that 3,5-DCP cause a number of concentration-dependent MoAs in L. minor,
553
whereof uncoupling of OXPHOS and photooxidative phosphorylation were proposed to be 554
the main MoAs leading to reduction in ATP synthesis and growth inhibition at low 3,5-DCP 555
concentrations. ROS induced oxidative stress and damage were proposed to occur at higher 556
3,5-DCP concentration and indirectly affect a number of endpoints such as pigments content 557
and PSII efficiency. A network of AOPs were subsequently proposed and submitted to the 558
AOPwiki (AOP: 245, https://aopwiki.org/aops/245) as an initial effort to develop AOPs for 559
CPs, identify suitable bioassays for IATA approaches, and support future hazard and risk 560
assessment initiatives for CPs. 561
562
6. Acknowledgements
563
This research was supported by Norwegian Research Council through its Centre of 564
Excellence (CoE) funding scheme (Project No. 223268/F50) and internal NIVA funding. 565
1 2 3 4 5 6 7 8 9 10 11 12 13 14 15 16 17 18 19 20 21 22 23 24 25 26 27 28 29 30 31 32 33 34 35 36 37 38 39 40 41 42 43 44 45 46 47 48 49 50 51 52 53 54 55 56 57 58 59 60 61 62
7. References
Agarwal, A., Said, T.M., 2005. Oxidative stress, DNA damage and apoptosis in male infertility: a clinical approach. BJU international 95, 503-507.
Ankley, G.T., Bennett, R.S., Erickson, R.J., Hoff, D.J., Hornung, M.W., Johnson, R.D., Mount, D.R., Nichols, J.W., Russom, C.L., Schmieder, P.K., Serrrano, J.A., Tietge, J.E., Villeneuve, D.L., 2010. Adverse outcome pathways: a conceptual framework to support ecotoxicology research and risk assessment. Environ Toxicol Chem 29, 730-741.
Asada, K., 2006. Production and scavenging of reactive oxygen species in chloroplasts and their functions. Plant physiology 141, 391-396.
Azcón-Bieto, J., Osmond, C.B., 1983. Relationship between photosynthesis and respiration the effect of carbohydrate status on the rate of CO2 production by respiration in darkened and illuminated wheat leaves. Plant Physiology 71, 574-581.
Baker, N.R., 2008. Chlorophyll fluorescence: a probe of photosynthesis in vivo. Annu. Rev. Plant Biol. 59, 89-113.
Baskar, K., Sudha,V., Tamilselvan,V., 2016. Growth Inhibitory Effect of 3,5-dichlorophenol on Lemna gibba (L.). Asian Journal of Biological Sciences, 9: 47-52.
Barzilai, A., Yamamoto, K.-I., 2004. DNA damage responses to oxidative stress. DNA repair 3, 1109-1115.
Bennett, J., 1981. Biosynthesis of the light-harvesting chlorophyll a/b protein. Polypeptide turnover in darkness. European journal of biochemistry 118, 61-70.
Bennett, J., 1983. Regulation of photosynthesis by reversible phosphorylation of the light-harvesting chlorophyll a/b protein. Biochemical Journal 212, 1.
Bilger, W., Schreiber, U., Bock, M., 1995. Determination of the quantum efficiency of photosystem II and of non-photochemical quenching of chlorophyll fluorescence in the field. Oecologia 102, 425-432.
Borisova, M.M.M., Kozuleva, M.A., Rudenko, N.N., Naydov, I.A., Klenina, I.B., Ivanov, B.N., 2012. Photosynthetic electron flow to oxygen and diffusion of hydrogen peroxide through the chloroplast envelope via aquaporins. Biochimica et Biophysica Acta (BBA)-Bioenergetics 1817, 1314-1321.
Carbonera, D., Gerotto, C., Posocco, B., Giacometti, G.M., Morosinotto, T., 2012. NPQ activation reduces chlorophyll triplet state formation in the moss Physcomitrella patens. Biochimica et Biophysica Acta (BBA)-Bioenergetics 1817, 1608-1615.
Chang, H.-L., Hsu, Y.-T., Kang, C.-Y., Lee, T.-M., 2013. Nitric oxide down-regulation of carotenoid synthesis and PSII activity in relation to very high light-induced singlet oxygen production and oxidative stress in Chlamydomonas reinhardtii. Plant and cell physiology 54, 1296-1315.
1 2 3 4 5 6 7 8 9 10 11 12 13 14 15 16 17 18 19 20 21 22 23 24 25 26 27 28 29 30 31 32 33 34 35 36 37 38 39 40 41 42 43 44 45 46 47 48 49 50 51 52 53 54 55 56 57 58 59 60 61
estuarine-coastal ecosystems. Biogeosciences 11, 2477-2501.
Cowgill, U. M., Milazzo, D. P., 1989. The culturing and testing of two species of duckweed. In Aquatic Toxicology and Hazard Assessment: 12th Volume. ASTM International. ISBN-EB: 978-0-8031-5088-1. 427p.
Dall'Osto, L., Lico, C., Alric, J., Giuliano, G., Havaux, M., Bassi, R., 2006. Lutein is needed for efficient chlorophyll triplet quenching in the major LHCII antenna complex of higher plants and effective photoprotection in vivo under strong light. BMC Plant Biology 6, 32. De Schamphelaere, K. A. C., Stubblefield, W., Rodriguez, P., Vleminckx, K., & Janssen, C. R., 2010. The chronic toxicity of molybdate to freshwater organisms. I. Generating reliable effects data. Science of the total environment, 408(22), 5362-5371.
Dreuw, A., Fleming, G., Head-Gordon, M., 2005. Role of electron-transfer quenching of chlorophyll fluorescence by carotenoids in non-photochemical quenching of green plants. Portland Press Limited.
Dzyubinskaya, E.V., Kiselevsky, D.B., Lobysheva, N.V., Shestak, A.A., Samuilov, V.D., 2006. Death of stoma guard cells in leaf epidermis under disturbance of energy provision. Biochemistry. Biokhimiia 71, 1120-1127.
Ehrenberg, B., Montana, V., Wei, M., Wuskell, J., Loew, L., 1988. Membrane potential can be determined in individual cells from the nernstian distribution of cationic dyes. Biophysical journal 53, 785-794.
Einhellig, F.A., Leather, G.R., Hobbs, L.L., 1985. Use of Lemna minor L. as a bioassay in allelopathy. Journal of chemical Ecology 11, 65-72.
Einhellig, F.A., Rasmussen, J.A., 1979. Effects of three phenolic acids on chlorophyll content and growth of soybean and grain sorghum seedlings. Journal of Chemical Ecology 5, 815-824.
Elser, J.J., Bracken, M.E., Cleland, E.E., Gruner, D.S., Harpole, W.S., Hillebrand, H., Ngai, J.T., Seabloom, E.W., Shurin, J.B., Smith, J.E., 2007. Global analysis of nitrogen and phosphorus limitation of primary producers in freshwater, marine and terrestrial ecosystems. Ecology letters 10, 1135-1142.
Escher, B.I., Snozzi, M., Schwarzenbach, R.P., 1996. Uptake, speciation, and uncoupling activity of substituted phenols in energy transducing membranes. Environmental Science & Technology 30, 3071-3079.
Eullaffroy, P., Vernet, G., 2003. The F684/F735 chlorophyll fluorescence ratio: a potential tool for rapid detection and determination of herbicide phytotoxicity in algae. Water research 37, 1983-1990.
Fairchild, J., Ruessler, D., Haverland, P., Carlson, A., 1997. Comparative sensitivity of Selenastrum capricornutum and Lemna minor to sixteen herbicides. Archives of Environmental Contamination and Toxicology 32, 353-357.
Fernandes, T.C., Pizano, M.A., Marin-Morales, M.A., 2013. Characterization, modes of action and effects of trifluralin: a review, Herbicides-Current Research and Case Studies in
1 2 3 4 5 6 7 8 9 10 11 12 13 14 15 16 17 18 19 20 21 22 23 24 25 26 27 28 29 30 31 32 33 34 35 36 37 38 39 40 41 42 43 44 45 46 47 48 49 50 51 52 53 54 55 56 57 58 59 60 61 62 Use. InTech.
Flagella, Z., Pastore, D., Campanile, R., Di Fonzo, N., 1994. Photochemical quenching of chlorophyll fluorescence and drought tolerance in different durum wheat (Triticum durum) cultivars. The Journal of Agricultural science 122, 183-192.
Gamble, P.E., Burke, J.J., 1984. Effect of water stress on the chloroplast antioxidant system I. Alterations in glutathione reductase activity. Plant Physiology 76, 615-621.
Gechev, T.S., Van Breusegem, F., Stone, J.M., Denev, I., Laloi, C., 2006. Reactive oxygen species as signals that modulate plant stress responses and programmed cell death. Bioessays 28, 1091-1101.
Guenther, J.E., Melis, A., 1990. The physiological significance of photosystem II heterogeneity in chloroplasts. Photosynthesis research 23, 105-109.
Gupta, B., Huang, B., 2014. Mechanism of Salinity Tolerance in Plants: Physiological, Biochemical, and Molecular Characterization. International Journal of Genomics 2014, 18. Haller, W.T., Sutton, D.L., Barlowe, W.C., 1974. Effects of salinity on growth of several aquatic macrophytes. Ecology 55, 891-894.
Halliwell, B., Gutteridge, J.M., 2015. Free radicals in biology and medicine. Oxford University Press, USA.
Hartman, W.A., Martin, D.B., 1985. Effects of four agricultural pesticides onDaphnia pulex,
Lemna minor, andPotamogeton pectinatus. Bulletin of environmental contamination and toxicology 35, 646-651.
Horvat, T., Vidaković-Cifrek, Ž., Oreščanin, V., Tkalec, M., Pevalek-Kozlina, B., 2007. Toxicity assessment of heavy metal mixtures by Lemna minor L. Science of the total environment 384, 229-238.
Hou, W., Chen, X., Song, G., Wang, Q., Chang, C.C., 2007. Effects of copper and cadmium on heavy metal polluted waterbody restoration by duckweed (Lemna minor). Plant physiology and biochemistry 45, 62-69.
Igbinosa, E.O., Odjadjare, E.E., Chigor, V.N., Igbinosa, I.H., Emoghene, A.O., Ekhaise, F.O., Igiehon, N.O., Idemudia, O.G., 2013. Toxicological profile of chlorophenols and their derivatives in the environment: the public health perspective. The Scientific World Journal 2013.
ISO8692:2012, 2012. Water quality -- Fresh water algal growth inhibition test with unicellular green algae. ISO TC.
ISO20079, 2005. Water quality – determination of the toxic effect of water constituents and waste water to duckweed (Lemna minor) – Duckweed growth inhibition test. ISO TC.
Jambunathan, N., 2010. Determination and detection of reactive oxygen species (ROS), lipid peroxidation, and electrolyte leakage in plants. Plant stress tolerance: methods and protocols, 291-297.
1 2 3 4 5 6 7 8 9 10 11 12 13 14 15 16 17 18 19 20 21 22 23 24 25 26 27 28 29 30 31 32 33 34 35 36 37 38 39 40 41 42 43 44 45 46 47 48 49 50 51 52 53 54 55 56 57 58 59 60 61
Jamers, A., Lenjou, M., Deraedt, P., Bockstaele, D.V., Blust, R., Coen, W.d., 2009. Flow cytometric analysis of the cadmium-exposed green alga Chlamydomonas reinhardtii (Chlorophyceae). European Journal of Phycology 44, 541-550.
Jiang, H.-X., Chen, L.-S., Zheng, J.-G., Han, S., Tang, N., Smith, B.R., 2008. Aluminum-induced effects on Photosystem II photochemistry in Citrus leaves assessed by the chlorophyll a fluorescence transient. Tree Physiol 28, 1863-1871.Kirby, M., Sheahan, D., 1994. Effects of atrazine, isoproturon, and mecoprop on the macrophyte Lemna minor and the alga Scenedesmus subspicatus. Bulletin of environmental contamination and toxicology 53, 120-126.
Kumar, K.S., Han, T., 2010. Physiological response of Lemna species to herbicides and its probable use in toxicity testing. Toxicology and Environmental Health Sciences 2, 39-49. Laisk, A., Loreto, F., 1996. Determining photosynthetic parameters from leaf CO2 exchange and chlorophyll fluorescence (ribulose-1, 5-bisphosphate carboxylase/oxygenase specificity factor, dark respiration in the light, excitation distribution between photosystems, alternative electron transport rate, and mesophyll diffusion resistance. Plant Physiology 110, 903-912. Lambrev, P.H., Miloslavina, Y., Jahns, P., Holzwarth, A.R., 2012. On the relationship between non-photochemical quenching and photoprotection of Photosystem II. Biochimica et Biophysica Acta (BBA)-Bioenergetics 1817, 760-769.
Landolt, E., 1975. Morphological differentiation and geographical distribution of the Lemna gibba-Lemna minor group. Aquatic botany, 1, 345-363.
Landolt, E., 1998. Lemnaceae. In Flowering Plants, Monocotyledons. Springer Berlin Heidelberg, 264-267.
Lawlor, D.W., Tezara, W., 2009. Causes of decreased photosynthetic rate and metabolic capacity in water-deficient leaf cells: a critical evaluation of mechanisms and integration of processes. Annals of botany.
Legradi, J., Dahlberg, A.-K., Cenijn, P., Marsh, G.r., Asplund, L., Bergman, Å., Legler, J., 2014. Disruption of oxidative phosphorylation (OXPHOS) by hydroxylated polybrominated diphenyl ethers (OH-PBDEs) present in the marine environment. Environmental science & technology 48, 14703-14711.
Lopez-Serrano, M., Ros Barceló, A., 1999. H2O2-mediated pigment decay in strawberry as a model system for studying color alterations in processed plant foods. Journal of agricultural and food chemistry 47, 824-827.
Luo, Y., Su, Y., Lin, R.-z., Shi, H.-h., Wang, X.-r., 2006. 2-Chlorophenol induced ROS generation in fish Carassius auratus based on the EPR method. Chemosphere 65, 1064-1073. Luo, Y., Wang, X.R., Shi, H.H., Mao, D.q., Sui, Y.X., Ji, L.L., 2005. Electron paramagnetic resonance investigation of in vivo free radical formation and oxidative stress induced by 2, 4
‐dichlorophenol in the freshwater fish Carassius auratus. Environmental toxicology and chemistry 24, 2145-2153.
Mallick, N., Mohn, F., 2003. Use of chlorophyll fluorescence in metal-stress research: a case study with the green microalga Scenedesmus. Ecotoxicology and environmental safety 55,