SCHIMPP, SARAH A., M.S. Determining Nightly Bat Activity with, and Sampling Effectiveness of, Modified NABat Driving Transects in Urban Areas. (2017)
Directed by Dr. Matina C. Kalcounis-Rueppell. 54 pp.
Time of peak bat activity during the night differs among bat species. Foraging strategies may differ among species due to prey availability, habitat availability, and/or interactions between species. Habitat availability is altered in urban areas, which may affect insect prey availability and interspecies interactions. Monitoring changes in bat diversity and behavior associated with habitat conversion is important, but some traditional bat monitoring methods may not be appropriate for all study sites. Acoustic monitoring techniques, including mobile monitoring using driving transects, may be good alternatives to study nightly activity in urban bat populations. Acoustic monitoring is an important component of many monitoring programs including the North American Bat Monitoring Program (NABat). Driving transects that are approximately 25 to 48 kilometers long within 100 km2 grid cells are used by NABat, but choosing appropriate transect routes can be difficult in urban areas. Shorter transects could be used to alleviate sampling issues, but a modified protocol may be less effective at sampling some bat species. My objectives were to use mobile acoustic monitoring to determine when bat species are active in a single night in urban and non-urban sites, if nightly bat activity patterns in urban sites differ from nightly bat activity patterns in non-urban sites, and whether sampling using a modified mobile acoustic monitoring protocol with reduced transect lengths is effective compared to the standardized NABat protocol. I recorded bat echolocation calls using Anabat acoustic detectors while driving transects through the night at five sites (three “urban” and two “non-urban”) located in the Piedmont region of
north-central North Carolina from May through August 2016. Transects were driven three times per night in each site starting 45 minutes, 180 minutes, and 300 minutes after sunset using a modified NABat protocol with 6 “short” transects (about 3.2 km long each). An additional “long” transect (about 25 km long, using NABat protocol) was sampled in 4 sites (two of the urban sites and both non-urban sites) starting 45 minutes after sunset. Recorded echolocation call sequences were analyzed manually using
AnalookW and automatically using Bat Call Identification and Echoclass software. Total bat activity and Lasiurus borealis activity was decreased later in the night in urban sites. There were also fewer Eptesicus fuscus, Lasionycteris noctivagans, and Nycticeius humeralis calls on the latest time period. There were more E. fuscus, L. noctivagans, and
Tadarida brasiliensis calls and fewer L. borealis, N. humeralis, and Perimyotis subflavus
calls in urban sites than non-urban sites. Fewer short transects were needed to match the detection probability on long transects for E. fuscus, L. borealis, and P. subflavus, while more short transects were needed for L. noctivagans, N. humeralis, and T. brasiliensis. These results suggest that bats in urban areas partition time differently, which is important to consider as urbanization impacts bat populations. They also suggest that short transects can be used effectively for NABat sampling in urban areas.
DETERMINING NIGHTLY BAT ACTIVITY WITH, AND SAMPLING EFFECTIVENESS OF, MODIFIED NABAT DRIVING
TRANSECTS IN URBAN AREAS
by
Sarah A. Schimpp
A Thesis Submitted to
the Faculty of The Graduate School at The University of North Carolina at Greensboro
in Partial Fulfillment
of the Requirements for the Degree Master of Science Greensboro 2017 Approved by _____________________________ Committee Chair
APPROVAL PAGE
This thesis written by Sarah A. Schimpp has been approved by the following committee of the Faculty of The Graduate School at The University of North Carolina at Greensboro. Committee Chair._____________________________________ Dr. Matina Kalcounis-Rueppell Committee Members._____________________________________ Dr. Stanley Faeth _____________________________________ Dr. Gideon Wasserberg _____________________________________ Dr. Han Li ____________________________ Date of Acceptance by Committee __________________________ Date of Final Oral Examination
ACKNOWLEDGEMENTS
Funding for my thesis project was provided by the UNCG Biology Department, the North Carolina Academy of Science, and agencies associated with the NABat
Program (US Fish and Wildlife Service and NC Wildlife Resources Commission), which was greatly appreciated.
I also would like to thank my thesis committee chair Dr. Matina Kalcounis-Rueppell and committee members Dr. Stanley Faeth, Dr. Gideon Wasserberg, and Dr. Han Li for their extremely helpful guidance through project creation, data analysis, and the writing process.
Many thanks to the Kalcounis-Rueppell Lab (including graduate students Angie Larsen, Rada Petric, Kevin Parker, and Ashley Matteson) for their help throughout my graduate studies. I also would like to thank my Transect Team 2016 (Aaron Wagoner, Amber Campos, Courtney Wicker), other transect assistants (Kimber Corson, Ruben Gameros, Carlos Melendez, Sarah Singleton, Bailey Wysong), and my family for assistance with late nights of data collection.
TABLE OF CONTENTS Page LIST OF TABLES ...v LIST OF FIGURES ... vi CHAPTER I. INTRODUCTION ...1
II. DETERMINING NIGHTLY BAT ACTIVITY WITH MODIFIED NABAT DRIVING TRANSECTS IN URBAN AREAS ...4
Abstract ...4 Introduction ...5 Methods ...8 Results ...13 Discussion ...16 Figures/Tables ...20
III. DETERMINING SAMPLING EFFECTIVENESS OF MODIFIED NABAT DRIVING TRANSECTS IN URBAN AREAS ...29
Abstract ...29 Introduction ...30 Methods ...34 Results ...39 Discussion ...42 Figures/Tables ...44
IV. DISCUSSION OF BOTH STUDIES ...48
LIST OF TABLES
Page Table 2.1 Total Number and Standard Deviation of Bat Calls per Species
Recorded on each Time Period during Summer 2016 for Urban and Non-Urban Sites in the Piedmont Area
of North Carolina ...21 Table 2.2 Coefficient Estimates of the Generalized Linear Regression Model
for the Effect of Time of Night (time period 1, 2, 3), Urban Intensity (urban/non-urban), and the Interaction of Time of Night and Urban Intensity on Total Bat Activity
(number of calls) with Temperature (°C) as a Covariate ...23 Table 2.3 Coefficient Estimates of the Generalized Linear Regression Models
for the Effect of Time of Night (time period 1, 2, 3) and Urban Intensity (urban/non-urban) on Bat Activity (number of calls)
for each Species with Temperature (°C) as a Covariate ...25 Table 3.1 Total Number of Bat Calls per Species on Long and Short Transects
and Standard Deviation of Total Calls Recorded
in the Piedmont Area of North Carolina in Summer 2016 ...45 Table 3.2 Akaike Information Criterion (AIC) Values and Model
Selection Results for each Species of Differences in Detection Probability using PRESENCE Software from Sites in the
LIST OF FIGURES
Page Figure 2.1 Locations of Driving Transects for Mobile Acoustic Monitoring
in Burlington (a), North Greensboro (b), Pine Hall (c),
Siler City (d), and West Greensboro (e) in the Piedmont Area
of North Carolina (f) ...20 Figure 2.2 Total Number of Bat Calls Recorded per Night and Nightly
Average Temperature (°C) in All Sites in the Piedmont Area
of North Carolina during Summer 2016 ...22 Figure 2.3 Total Number of Bat Calls (± 1SD) Recorded on each
Time Period during Summer 2016 for Urban and Non-Urban
Sites in the Piedmont Area of North Carolina ...24 Figure 2.4 Average Number of Bat Calls (+ 1SD) per Site for each Species
in Urban and Non-Urban Sites from Summer 2016 ...27 Figure 2.5 Total Number of Bat Calls (± 1SD) per Species for each
Time Period in Urban and Non-Urban Sites from Summer 2016 ...28 Figure 3.1 Locations of Long and Short Driving Transects for Mobile
Acoustic Monitoring in Burlington (a), North Greensboro (b), Pine Hall (c), Siler City (d) in the Piedmont Area
of North Carolina (e) ...44 Figure 3.2 Summary of Differences in Detection Probability
for each Species from Sites in the Piedmont Area
CHAPTER I INTRODUCTION
Time is an important component of ecological interactions and activity patterns can vary from species to species. If species have different activity patterns, they use time resources differently, may have varied susceptibility to predation, and are reducing competition among sympatric species (Kronfeld-Schor and Dayan 2003).
Sympatric bat species may alter their foraging behaviors by having different foraging spaces and foraging times (Jachowski et al. 2014). Differences in bat foraging time seem to be related to diet and foraging technique, which is related to flight speed (Rydell et al. 1996, Kunz and Racey 1998).
Urbanization alters the spatial distribution of foraging habitat, which may only allow a few species with certain morphological characteristics and foraging strategies to overcome spatial barriers (Pickett et al. 2001, Fabianek et al. 2011). Urbanization has an overall negative effect on bat diversity and abundance, but bat species responses to urbanization can be complex (Kurta and Teramino 1992, Gehrt and Chelsvig 2004).
Many studies have looked at differences in species-specific bat activity along spatial scales (such as along an urban gradient) but few studies have investigated
differences in nightly activity along spatial scales. Examining the implications of habitat conversion and fragmentation on behavior and conservation of bats should be a priority,
including investigating activity pattern changes in urban areas (Schoener 1974, Kronfeld-Schor and Dayan 2003).
Urbanization alters biological interactions, but it is not known if bat temporal foraging strategies are altered in urban areas (Pickett et al. 2001). While temporal partitioning is less common than habitat or dietary partitioning, species in some bat communities partition timing of peak activity and habitat space to reduce competition (Kunz 1973, Adams and Thibault 2006). There is evidence that bat spatial foraging strategies can be altered in urban areas, but it is not known if foraging periods are affected by land use changes in a similar way (Threllfall et al. 2011, Jung and Kalko 2010).
Common techniques to study bat populations include mist-netting and roost watches, but these methods may not be optimal in all monitoring situations (Rodhouse et al. 2011). Acoustic monitoring can be used to study nightly activity in urban bat
populations, but some acoustic monitoring techniques may be difficult to use in urban areas. Mobile acoustic monitoring can be implemented in urban areas using driving transects, but choosing transect routes can be challenging in areas with high road density and many stops. Adjusting the mobile monitoring protocol by reducing transect lengths may alleviate some of these issues.
In order to study nightly bat activity using driving transects in urban areas,
transects needed to remain effective at detecting bat species even with modifications. The objective of my study was to investigate species-specific nightly bat activity between
urban and non-urban sites and determine whether a modified protocol with reduced transect lengths is effective for sampling bats in urban areas.
CHAPTER II
DETERMINING NIGHTLY BAT ACTIVITY WITH MODIFIED NABAT DRIVING TRANSECTS IN URBAN AREAS
Abstract
Time of peak bat activity during the night differs among bat species. Foraging strategies may differ among species due to prey availability, habitat availability, and/or interactions between species. Habitat availability is altered in urban areas, which may affect insect prey availability and interspecies interactions. My objectives were to use mobile acoustic monitoring to determine when bat species are active in a single night in urban and urban sites and if nightly bat activity patterns differ in urban versus non-urban sites. I recorded bat echolocation calls using Anabat acoustic detectors while driving transects through the night at five sites (three “urban” and two “non-urban”) located in the Piedmont region of north-central North Carolina from May through August 2016. Transects were driven three times per night starting 45 minutes, 180 minutes, and 300 minutes after sunset. Recorded echolocation call sequences were analyzed manually using AnalookW and automatically using Bat Call Identification and Echoclass software. Total bat activity and Lasiurus borealis activity was decreased later in the night in urban sites. There were also fewer Eptesicus fuscus, Lasionycteris noctivagans, and Nycticeius humeralis calls on the latest time period. There were more E. fuscus, L. noctivagans, and
Tadarida brasiliensis calls and fewer L. borealis, N. humeralis, and Perimyotis subflavus
partition time differently, which is important to consider as urbanization impacts bat populations.
Introduction
Competition is an important factor in determining which species are present in communities by excluding species that use environmental resources in the same way (May and MacArthur 1972). Species may be separated into niches along environmental gradients, avoiding competitors, resulting in niche partitioning (Schoener 1974). Niches include resources such as space, food, and time, which can be partitioned among
coexisting species when these species alter their habitat space, diets, or behaviors (Schoener 1974, Jachowski et al. 2014). Temporal partitioning strategies are usually adaptive, with mechanisms that include avoiding predators, energetic limitations, diet quality, and interspecific competition (Bennie et al. 2014).
Sympatric bat species have different echolocation calls, foraging spaces, and foraging times, which correspond to morphological traits in many cases (Jachowski et al. 2014). For example, aerial insectivorous bats can have different preferred foraging habitats based on vegetation clutter (Kunz and Racey 1998, Schnitzler and Kalko 2001). Clutter space adapted bats have short broad wings for slow maneuverable flight, while open space adapted bats have long narrow wings for faster but less maneuverable flight (Kunz and Racey 1998).
Time of peak bat activity in a single night can differ among species, which may correspond to prey, habitat availability, and interactions between species (Kunz 1973, Kalcounis et al. 1999, Agosta et al. 2005, Razgour et al. 2011, Jachowski et al. 2014).
While temporal partitioning is less common than habitat or dietary partitioning, species in some bat communities partition timing of peak activity and habitat space to reduce
competition among sympatric species (Kunz 1973, Kronfeld-Schor and Dayan 2003, Adams and Thibault 2006).
Overall, insectivorous bats emerge during or after peak aerial insect abundance and forage while insect abundance is decreasing (Rydell et al. 1996). Activity during a single night can vary among sympatric species, which may be a result of preference and selection for different habitat types or specific insect groups and sizes (Kunz 1973, Agosta et al. 2005). For example, peak bat activity has been shown to vary vertically in mature boreal forests, with uniform intra-night activity within and above the canopy and early peak activity below the canopy (Kalcounis et al. 1999). This variation in peak activity may be a result of species-specific foraging differences in the habitat types above and below the canopy (Kalcounis et al. 1999). Sympatric bat species also partition
foraging periods spatially and temporally in locations where water is scarce (Razgour et al. 2011).
Natural and anthropogenic environmental changes affect bat species distributions and behavior, which can lead to foraging strategy changes in individuals (Jung and Kalko 2010). White-nose syndrome (WNS) caused species-specific mortality in many bat species, allowing Lasionycteris noctivagans to have earlier peak activity and occupy empty niches after this rapid decline (Jachowski et al. 2014).
Urbanization alters bat communities through changes in composition and spatial distribution of foraging habitat along with altered prey and roost availability
(Avila-Flores and Fenton 2005, Russo and Ancillotto 2015). Insect prey populations are reduced with increased impervious surfaces in highly urbanized sites, which negatively affects bat foraging activity (Threlfall et al. 2011, Russo and Ancillotto 2015). Responses to
urbanization may also depend on roost preferences because some species are able to use roosts that become available in man-made structures when natural roosts are lost (Kunz 1982, Duchamp et al. 2004).
As with other taxonomic groups, only a few generalist species with certain morphological characteristics and foraging strategies may be able to overcome spatial barriers in urban areas (Fabianek et al. 2011). Generalist bat species may be less affected by urbanization than specialized ones because they can take advantage of altered habitats and changes in insect prey in some landscape types (Gehrt and Chelsvig 2004, Shochat et al. 2006, Threllfall et al. 2011, Luck et al. 2013, Russo and Ancillotto 2015). For
example, open space adapted bat species have more uniform distribution in urbanized areas and can take advantage of foraging area around streetlights, unlike cluttered space adapted species (Fabianek et al. 2011, Stone et al. 2015, Russo and Ancillotto 2015).
Urbanization has an overall negative effect on bat diversity and abundance, but species-specific responses to urbanization can be complex (Kurta and Teramino 1992, Gehrt and Chelsvig 2004). Fewer opportunities may lead to more widespread, generalist species, which are recorded more frequently, but because bats are able to move from patch to patch, fragmented landscapes can still serve as habitat for several bat species (Mendes et al. 2014). On the other hand, fragmented landscapes may lead to fewer opportunities, so bats have to use habitats that are less optimal (Mendes et al. 2014).
Examining the implications of habitat conversion and fragmentation on behavior and conservation of bats should be a priority, including investigating activity pattern changes in urban areas (Schoener 1974, Kronfeld-Schor and Dayan 2003). There is evidence that spatial foraging strategies are altered in urban areas, which affects species distributions along urban gradients (Threllfall et al. 2011, Jung and Kalko 2010). It is not known if changes in species distributions from land use changes also affect bat foraging periods. Many bat species have overlapping foraging periods and if urbanization causes a rapid decline in species that are not able to adapt to changes in foraging and roosting habitat (or spatially partition habitat), the remaining species may be able to shift their activity to occupy empty niches and forage at a different time of night in urban versus non-urban areas.
The objective of this study was to investigate species-specific nightly bat activity in urban versus non-urban sites. I hypothesized that bat activity patterns would differ in urban versus non-urban sites based on predictions for species that are adapted to urban foraging. I hypothesized that nightly bat activity patterns in urban sites would differ from nightly bat activity patterns in non-urban sites because species that are adapted to urban foraging can adjust their nightly activity patterns and potentially occupy empty niches.
Methods
I monitored bat activity at 5 different sites in the Piedmont region of north-central North Carolina: Burlington (BR; city in Alamance and Guilford Counties; 36°02'37.0"N 79°29'07.9"W), North Greensboro (NG; city in Guilford County; 36°09'31.6"N
36°25'15.0"N 80°05'00.2"W), Siler City (SC; town in Chatham County; 35°37'41.3"N 79°24'00.5"W), and West Greensboro (WG; city in Guilford County; 36°09'31.6"N 79°49'57.6"W; Figure 2.1). The 5 sites were used as spatial replicates and the two sampling sites in Greensboro were used in order to increase the number of spatial replicates.
The acoustic monitoring sites used in the study varied in urban intensity. The North Greensboro, West Greensboro, and Burlington sites were in residential/industrial areas with surrounding public parks and other greenspaces. The Pine Hall and Siler City sites were in areas surrounded by agriculture, pastureland, and small forest patches. The urban intensity of study sites was determined using developed land categories from National Land Cover Database 2011 (Homer et al. 2015). A 1-km buffer around each transect was created in ArcMap GIS (v10.2.2) and FRAGSTATS (v4, McGarigal et al. 2012) was used to calculate the total percentage of developed land cover classes surrounding transects in each site.
Field Methods
Anabat acoustic detectors (Anabat SD2, Titley Scientific, Australia) were used for mobile acoustic monitoring with driving transects. The Anabat microphone was mounted on the roof of the vehicle, while the detector itself remained inside the vehicle (Loeb et al. 2015). The microphone was pointed straight up (90 degrees) from the roof to
maximize sampling potential (Britzke and Herzog 2009). A Global Positioning Satellite (GPS) unit (Titley Scientific, Australia) was used to create initial maps of transect routes. The data division ratio and audio division ratio used for the Anabat were 8 and 16,
respectively (Titley Scientific, Australia). Microphone sensitivity was set between 4 and 5 (Loeb et al. 2015). All calls were recorded on a compact flash card (SanDisk, USA) that was downloaded and backed up after each night of sampling.
All transects were driven in one direction along roads at approximately 32 kilometers per hour (Loeb et al. 2015). This speed was chosen because it is approximately the upper limit of how fast bats can fly and may help reduce the
probability of individual bats being detected multiple times (Britzke and Herzog 2009). All transects were driven from a set start point to a set end point while following traffic rules and without making any extra stops. The Anabat detector was set to only record along transect routes and was turned off between transects to ensure that bat calls were recorded only along these routes (Loeb et al. 2015). Transects were driven only when weather conditions were appropriate (no rain or windy conditions) (Britzke and Herzog 2009).
Each driving transect was about 3.2 kilometers (2 miles) long with predetermined start and end sites at street intersections. Six transects were used at each site in order to maximize the time spent recording bat calls during each time period (Figure 2.1). There was minimal overlap of transects within sites, but some transects overlapped slightly in areas of high road density. All transects were within approximately a 4 kilometer radius where possible (Figure 2.1). Transect length was shorter than in previous studies in order to be able to sample in urban areas with high road density (see Figures 2.1b and 2.1e; Loeb et al. 2015). Transects of this length were chosen to minimize travel time between transects and avoid high traffic areas while being able drive safely at 20 miles per hour
even in urban areas. All six transects were driven back to back during one time period in a predetermined randomized order. Within each night, transects were driven at three different time periods. The first time period (time period 1) was 45 minutes after sunset, the second (time period 2) was 180 minutes after sunset, and the last (time period 3) was 300 minutes after sunset. Each site was sampled during each time period for two nights within about one week during each month of May, June, July and August of 2016. Acoustic Analyses
Both automated and manual approaches were used to analyze bat call recordings from transects. First, AnalookW (version 4.1t; Titley Scientific, Australia) was used to manually screen for unanalyzable files. Unanalyzable files include those without search-phase echolocation calls or with only noise, too few echolocation pulses, fragments, feeding buzzes, and social calls (Morris et al. 2010). Second, automated identification programs Bat Call Identification (BCID version 2.7c; Bat Call Identification, Inc., Missouri, USA) and Echoclass (version 3.1; U.S Army Engineer Research and
Development Center, Mississippi, USA) were used to initially identify the species in all remaining files with bat calls, including files with multiple species. Finally, each call was further examined using AnalookW to verify the automated identification of calls that were identified to species. Analyzable bat calls were manually identified to species based on frequencies that correspond to specific species or groups of species and other species-specific call characteristics (such as pulse shape) (Kalcounis et al. 1999). The output from the automated identification programs were used as a reference for manual identification. For manual identification, a bat call was defined as 4 or more search phase pulses in
about one second. Files containing a bat call that was not able to be identified to species were labeled “NOID.” All (100%) of the analyzable files containing a bat call were manually identified to a species, species group, or NOID. Main target species for the sampled region were: Eptesicus fuscus (big brown bat), Lasionycteris noctivagans (silver haired bat), Lasiurus borealis (red bat), Lasiurus cinereus (hoary bat), Myotis lucifugus (little brown bat), Myotis septentrionalis (northern long eared bat), Nycticeius humeralis (evening bat), and Perimyotis subflavus (tricolored bat).
Statistical Analyses
The 6 transects driven at one site within one time period was used as a sampling unit in all analyses. Each sample had a total number of bat calls from each species (including NOID) and a corresponding temperature. This temperature was calculated using an average of the temperature recorded at the beginning of the first transect driven and the end of the last transect driven in each time period. Temperatures were recorded at the study site using the closest recording station in the Weather Underground mobile app (The Weather Company 2016). Statistical differences in temperature between time periods, months, and sites were determined using a series of individual analysis of variance tests (ANOVA). The bat calls from two replicates (time periods driven in the same site and same time of night but on different dates) were kept separate, so each sample has a unique temperature value. Samples for each time period were taken 2 nights per month over a 4 month sampling period in 5 sites resulting in 120 total samples in analyses.
Generalized linear regression models were used to analyze the effects of time of night (time period 1, 2, 3) and urban intensity (urban/non-urban) and the interaction of time of night and urban intensity on bat activity (number of calls) with temperature (°C) as a covariate. Bat activity is highly dependent on temperature, so these models included temperature as a covariate. There was one model for total bat activity (number of calls from all species including NOID) and additional separate models for each individual species (except Myotis spp. and L. cinereus). For individual species models without a significant interaction term, results were presented from models without the interaction term for more statistical power. No individual species models were run for calls from Myotis spp. and L. cinereus due to the very low recorded call numbers and inability to
distinguish the species-specific differences in the Myotis spp. calls. The models were run on untransformed data. Initial analyses showed that the data were not linear and had a non-normal distribution. A Poisson distribution was used for all generalized linear
regression models because bat calls on each transect were recorded as count data during a fixed time period and each sample was independent. Program R 3.1.1 was used for all statistical analyses.
Results
The total percentage of developed land cover surrounding transects in North Greensboro, Burlington, and West Greensboro was 76.0%, 31.2%, and 99.8%
respectively. The total percentage of developed land cover surrounding transects in Pine Hall and Siler City was 5.8% and 6.8% respectively. Using these land cover percentages,
sites in North Greensboro, Burlington, and West Greensboro were defined as urban and sites in Pine Hall and Siler City were defined as non-urban.
A total of 4,145 files were recorded, with 2,618 analyzable bat calls recorded over the entire study (Table 2.1). Of the 2,618 analyzable calls, 1,250 were identified to 8 species (or species groups): Eptesicus fuscus, Lasiurus borealis, Lasiurus cinereus, Lasionycteris noctivagans, Myotis spp., Nycticeius humeralis, Perimyotis subflavus, and
Tadarida brasiliensis. The remaining 1,368 calls (52.3%) were not identifiable to species
(NOID). The number of bat calls from all 8 species, including bat calls that were not able to be identified to species (NOID), were used to represent total bat activity. A total of 1,233 bat calls were used for individual species analyses from 6 species: E. fuscus, L. borealis, L. noctivagans, N. humeralis, P. subflavus, and T. brasiliensis. A total of 120
samples were used in analyses. The average number of bat calls per sample (including all 8 species and NOID) was 21.82 (SD 13.95).
No significant difference in temperature was observed between time periods (df = 2, p = 0.066). Total bat activity was dependent on temperature, with more calls recorded on warmer samples (estimate = 0.093, p < 0.001; Figure 2.2 and Table 2.2). The number of bat calls recorded per species increased with an increase in temperature for E. fuscus (estimate = 0.167, p < 0.001), L. borealis (estimate = 0.043, p < 0.001), L. noctivagans (estimate = 0.142, p < 0.001), P. subflavus (estimate = 0.055, p = 0.045), and T.
brasiliensis (estimate = 0.095, p = 0.015; Table 2.3). A significant increase in calls was
not observed in N. humeralis as temperatures increased (estimate = -0.010, p = 0.623, Table 2.3).
No significant difference in total bat activity was observed in urban sites
compared to non-urban sites (estimate = 0.052, p = 0.405; Table 2.2). There was also no significant decrease in total bat activity later in the night at all sites (estimate = 0.044, p = 0.542 for time period 2 and estimate = 0.090, p = 0.217 for time period 3; Table 2.3). A significant decrease in total bat activity was observed, however, later in the night in urban sites (estimate = -0.366, p < 0.001 for urban and time period 2; estimate = -0.410, p < 0.001 for urban and time period 3; Table 2.3 and Figure 2.3).
More E. fuscus, L. noctivagans, and T. brasiliensis calls were recorded in urban versus non-urban sites (estimate = 1.136, p < 0.001 for E. fuscus; estimate = 1.694; p < 0.001 for L. noctivagans; estimate = 1.591, p < 0.001 for T. brasiliensis; Table 2.3 and Figure 2.5). Fewer L. borealis, N. humeralis, and P. subflavus calls were recorded in urban versus nonurban sites (estimate = 0.666, p < 0.001 for L. borealis; estimate = -0.763, p < 0.001 for N. humeralis; estimate = -1.985, p < 0.001 for P. subflavus; Table 2.3 and Figure 2.5).
Fewer E. fuscus calls were recorded in both later time periods versus time period 1 (coefficient estimate = 0.421, p = 0.008 for time period 2; coefficient estimate = -0.745, p < 0.001 for time period 3; Table 2.3 and Figure 2.5). Fewer L. noctivagans and N. humeralis calls were recorded in time period 3 versus time period 1 (coefficient
estimate = -0.452, p = 0.009 for L. noctivagans; coefficient estimate = -0.649, p = 0.016 for N. humeralis; Table 2.3 and Figure 2.5). Fewer L. borealis calls also were recorded later in the night in urban sites, with a significant decrease during time period 3 and a close to significant decrease during time period 2 (estimate = -0.485, p = 0.023 for urban
and time period 3; estimate = -0.418, p = 0.051 for urban and time period 2; Table 2.3 and Figure 2.5).
Discussion
No difference in total bat activity was observed in urban sites versus non-urban sites, but there were more E. fuscus, L. noctivagans, and T. brasiliensis calls and fewer L. borealis, N. humeralis, and P. subflavus calls in urban than in non-urban sites. There was
no difference in total bat activity on later time periods, but fewer E. fuscus, L.
noctivagans, and N. humeralis calls were recorded during the latest time period. Total bat
activity and L. borealis activity decreased later in the night in urban sites.
Nightly total bat activity and nightly activity for most species was dependent on temperature which was consistent with previous studies (Anthony et al. 1981, Erikson and West 2002, Grider et al. 2016). The reduction in overall bat calls later in the night is likely due to declining temperatures. There was a significant decrease in temperature for time period 3 compared to time period 1 and all species (except N. humeralis) had fewer calls with a decrease in temperature.
I found that urbanization affects nightly bat activity patterns because there was a significant decrease in total bat activity and L. borealis activity later in the night in urban sites. This decrease in total bat activity may be due to urban associated species roosting in urban areas and traveling to non-urban areas to forage. For example, E. fuscus readily use buildings for roosts and can cross large areas of urban habitat to reach preferred foraging habitat in forested and/or agricultural areas (Geggie and Fenton 1985, Kunz and Racey 1998, Duchamp et al. 2004).
My results are consistent with previous studies that show L. borealis maximizes foraging effort in the first 2 hours after sunset (Kunz 1973). Fewer L. borealis calls later in the night in urban areas may be due to an early activity period in urban areas and either moving to preferred forested habitats to continue foraging or returning to roosts after the initial foraging period (Geggie and Fenton 1985).
A reduction in E. fuscus and L. noctivagans activity later in the night, likely due to a reduction in insect prey activity, was verified by this study (Kunz 1973, Agosta et al. 2005). Specifically, the reduction in activity for L. noctivagans for transects driven 5 hours after sunset was consistent with a predicted reduction in activity between two activity peaks around 2-4 hours and 6-8 hours after sunset (Kunz 1973). There also was a reduction in activity for N. humeralis later in the night which is not consistent with results from any previous study.
I verified which species were predicted to be more active or less active in urban areas based on species with adaptations for foraging and/or roosting in urban areas. E. fuscus, L. noctivagans, and T. brasiliensis are better adapted to forage in open or edge
habitats and previous studies have found more E. fuscus and L. noctivagans calls in urban areas, including areas adjacent to industrial land use (Kunz and Racey 1998, Gehrt and Chelsvig 2004). L. borealis and P. subflavus are mostly forest associated species and prefer to forage in agricultural land or forest edges (Walters et al. 2007). P. subflavus has also been found to concentrate activity in larger greenspaces in urban areas, which may not have been adequately sampled in this study using driving transects (Fabianek et al. 2011). While N. humeralis has been shown to use similar habitats for foraging as E.
fuscus in suburban areas, N. humeralis prefers roosting in tree cavities and foraging in
areas that are less developed (Duchamp et al. 2004).
The lack of changes in activity patterns of urban associated species is not
consistent with my prediction that species that are adapted to urban foraging would adjust their nightly activity in the absence of species that avoid urban areas. None of these urban associated species had significantly more calls earlier in the night in urban areas, which would have suggested a shift in activity to occupy empty niches in urban areas. L.
noctivagans had fewer calls later in the night, but this activity pattern was not different in
urban versus non-urban areas which would have suggested the occupation of empty niches.
Land use changes from urbanization may not affect nightly bat activity patterns because activity is based on species-specific preferences for foraging and roosting. Species may keep their usual activity patterns regardless of changes in land use and possible interactions with other species. For example, E. fuscus is a foraging habitat generalist and may be able to use a similar activity pattern in both urban and non-urban sites (Kurta and Baker 1990). This species may be able to avoid negative aspects of urban areas and exploit preferred edge habitat for foraging (Gehrt and Chelsvig 2004). Previous studies have also suggested that intra-night activity may be a result of preference and selection for different insect groups and sizes, so the timing of activity may correspond with activity of preferred insect prey regardless of site (Kunz 1973, Agosta et al. 2005). My study did not record insect activity, however, which would be useful to incorporate into future studies on the timing of nightly bat activity.
Overall, my results show that there are species-specific differences in activity in urban versus non-urban areas. While the amount of calls did not change throughout the night in non-urban sites, there was a different activity pattern for total bat activity and L. borealis in urban sites. These results suggest that bats in urban areas partition time
Figures/Tables
Figure 2.1. Locations of Driving Transects for Mobile Acoustic Monitoring in Burlington (a), North Greensboro (b), Pine Hall (c), Siler City (d), and West Greensboro (e) in the Piedmont Area of North Carolina (f). Urban intensity of the study sites is shown with developed land categories from National Land Cover Database 2011 in shades of red (Homer et al. 2015).
Table 2.1. Total Number and Standard Deviation of Bat Calls per Species Recorded on each Time Period during Summer 2016 for Urban and Non-Urban Sites in the Piedmont Area of North Carolina. Time period 1 was 45 minutes after sunset, time period 2 was 180 minutes after sunset, and time period 3 was 300 minutes after sunset. There were 3 urban sites and 2 non-urban sites. Bat species abbreviations refer to bat species and species groups: Eptesicus fuscus (EPFU), Lasiurus borealis (LABO), Lasiurus cinereus (LACI), Lasionycteris noctivagans (LANO), Myotis spp. (MYspp), Nycticeius humeralis (NYHU), Perimyotis subflavus (PESU), Tadarida brasiliensis (TABR). Bat calls that were not able to be identified to species are labeled NOID. Total includes calls from all identified species and NOID.
Time Period 1 Time Period 2 Time Period 3
Species Calls SD Calls SD Calls SD
Urban Total 665 18.8 413 14.0 383 13.6 NOID 335 11.0 212 7.3 215 7.6 EPFU 104 4.1 51 2.9 31 2.2 LANO 97 3.2 62 3.3 48 2.0 LABO 90 2.9 58 2.2 57 2.9 NYHU 21 1.2 13 0.8 8 0.8 TABR 13 0.8 11 0.8 13 0.8 PESU 5 0.5 3 0.4 5 0.7 LACI 0 0.0 2 0.3 2 0.3 MYspp 0 0.0 1 0.2 4 0.5 Non-urban Total 419 9.2 374 9.2 364 9.0 NOID 214 7.4 196 5.0 196 5.2 LABO 117 4.3 114 3.5 120 4.5 PESU 27 1.1 18 1.2 18 1.1 NYHU 20 1.0 26 1.5 14 1.0 EPFU 20 1.1 11 1.2 8 0.9 LANO 17 1.4 5 0.6 3 0.4 TABR 2 0.3 1 0.3 2 0.3 LACI 1 0.3 2 0.5 2 0.5 MYspp 1 0.3 1 0.3 1 0.3
Figure 2.2. Total Number of Bat Calls Recorded per Night and Nightly Average Temperature (°C) in All Sites in the Piedmont Area of North Carolina during Summer 2016. Total calls per night includes the number of bat calls from all species including Lasiurus cinereus, Myotis spp., and bat calls that were not able to be identified to species (NOID) from all sites on all three time periods.
0 20 40 60 80 100 120 140 160 180 0 5 10 15 20 25 30 Total B at C alls/ N igh t Temperature (°C)
Table 2.2. Coefficient Estimates of the Generalized Linear Regression Model for the Effect of Time of Night (time period 1, 2, 3), Urban Intensity (urban/non-urban), and the Interaction of Time of Night and Urban Intensity on Total Bat Activity (number of calls) with Temperature (°C) as a Covariate. Reference groups were urban = N (non-urban) and time period = 1. Time period 1 was 45 minutes after sunset, time period 2 was 180 minutes after sunset, and time period 3 was 300 minutes after sunset. Total includes the number of bat calls from all species including Lasiurus cinereus, Myotis spp., and bat calls that were not able to be identified to species (NOID) from all sites in summer 2016. Estimate SE z P value Total Constant 1.091 0.129 8.475 < 0.001 Urban (Y) 0.052 0.062 0.833 0.405 Time Period 2 0.044 0.072 0.610 0.542 Time Period 3 0.090 0.073 1.236 0.217 Temperature 0.093 0.005 18.819 < 0.001 Urban (Y) : Time Period 2 -0.366 0.095 -3.860 < 0.001 Urban (Y) : Time Period 3 -0.410 0.096 -4.266 < 0.001
Figure 2.3. Total Number of Bat Calls (± 1SD) Recorded on each Time Period during Summer 2016 for Urban and Non-Urban Sites in the Piedmont Area of North Carolina. Time period 1 was 45 minutes after sunset, time period 2 was 180 minutes after sunset, and time period 3 was 300 minutes after sunset. Total includes the number of bat calls from all species including Lasiurus cinereus, Myotis spp., and bat calls that were not able to be identified to species (NOID). Error bars represent ± 1 standard deviation.
0 100 200 300 400 500 600 700 800 0 1 2 3 N u mb er of B at C alls Time Period Urban Non-urban
Table 2.3. Coefficient Estimates of the Generalized Linear Regression Models for the Effect of Time of Night (time period 1, 2, 3) and Urban Intensity (urban/non-urban) on Bat Activity (number of calls) for each Species with Temperature (°C) as a Covariate. Reference groups were urban = N (non-urban) and time period = 1. Results for L. borealis include the interaction of time of night and urban intensity. Time period 1 was 45 minutes after sunset, time period 2 was 180 minutes after sunset, and time period 3 was 300 minutes after sunset. Site abbreviations are: Burlington (BR), North Greensboro (NG), Pine Hall (PH), Siler City (SC) and West Greensboro (WG). Bat species
abbreviations refer to Eptesicus fuscus (EPFU), Lasiurus borealis (LABO), Lasionycteris noctivagans (LANO), Nycticeius humeralis (NYHU), Perimyotis subflavus (PESU), and Tadarida brasiliensis (TABR).
Estimate SE z P value EPFU Constant -3.685 0.535 -6.891 < 0.001 Urban (Y) 1.136 0.176 6.450 < 0.001 Time Period 2 -0.421 0.159 -2.652 0.008 Time Period 3 -0.745 0.190 -3.921 < 0.001 Temperature 0.167 0.020 8.218 < 0.001 LABO Constant 1.007 0.244 4.134 < 0.001 Urban (Y) -0.666 0.140 -4.751 < 0.001 Time Period 2 0.049 0.133 0.370 0.712 Time Period 3 0.134 0.132 1.013 0.311 Temperature 0.043 0.010 4.433 < 0.001 Urban (Y) : Time Period 2 -0.418 0.214 -1.954 0.051 Urban (Y) : Time Period 3 -0.485 0.213 -2.271 0.023
LANO Constant -3.620 0.506 -7.153 < 0.001 Urban (Y) 1.694 0.212 8.001 < 0.001 Time Period 2 -0.299 0.157 -1.905 0.057 Time Period 3 -0.454 0.175 -2.599 0.009 Temperature 0.142 0.019 7.608 < 0.001 NYHU Constant 0.643 0.490 1.311 0.190 Urban (Y) -0.763 0.201 -3.791 < 0.001 Time Period 2 -0.068 0.227 -0.300 0.764 Time Period 3 -0.649 0.269 -2.409 0.016 Temperature -0.010 0.021 -0.506 0.613 PESU Constant -0.748 0.665 -1.125 0.260 Urban (Y) -1.985 0.305 -6.515 < 0.001 Time Period 2 -0.327 0.284 -1.151 0.250 Time Period 3 -0.194 0.281 -0.688 0.492
Temperature 0.055 0.027 2.004 0.045 TABR Constant -4.398 1.056 -4.166 < 0.001 Urban (Y) 1.591 0.477 3.338 < 0.001 Time Period 2 -0.067 0.392 -0.169 0.865 Time Period 3 0.234 0.378 0.621 0.535 Temperature 0.095 0.039 2.443 0.015
Figure 2.4. Average Number of Bat Calls (+ 1SD) per Site for each Species in Urban and Non-Urban Sites from Summer 2016. Bat species abbreviations refer to bat species and species groups: Eptesicus fuscus (EPFU), Lasiurus borealis (LABO), Lasiurus cinereus (LACI), Lasionycteris noctivagans (LANO), Myotis spp. (MYspp), Nycticeius humeralis (NYHU), Perimyotis subflavus (PESU), Tadarida brasiliensis (TABR). Error bars represent + 1 standard deviation.
0 20 40 60 80 100 120 140 160 180 200
EPFU LABO LACI LANO MYspp NYHU PESU TABR
A
ver
ag
e
N
u
m
b
er
of
C
alls
/Sit
e
(+ S
D)
Species
Urban Non-urbanFigure 2.5. Total Number of Bat Calls (± 1SD) per Species for each Time Period in Urban and Non-Urban Sites from Summer 2016. Time period 1 was 45 minutes after sunset, time period 2 was 180 minutes after sunset, and time period 3 was 300 minutes after sunset. Bat species abbreviations refer to Eptesicus fuscus (EPFU), Lasiurus borealis (LABO), Lasionycteris noctivagans (LANO), Nycticeius humeralis (NYHU), Perimyotis subflavus (PESU), and Tadarida brasiliensis (TABR). Error bars represent ± 1 standard deviation.
CHAPTER III
DETERMINING SAMPLING EFFECTIVENESS OF MODIFIED NABAT DRIVING TRANSECTS IN URBAN AREAS
Abstract
Monitoring changes in bat diversity and behavior associated with habitat conversion is important, but some traditional bat monitoring methods may not be appropriate for all study sites. Acoustic monitoring techniques, including mobile
monitoring using driving transects, may be good alternatives to study nightly activity in urban bat populations. Acoustic monitoring is an important component of many
monitoring programs, including the North American Bat Monitoring Program (NABat). Driving transects that are approximately 25 to 48 kilometers long within 100 km2 grid cells are used by NABat, but choosing appropriate transect routes can be difficult in urban areas. Shorter transects could be used to alleviate sampling issues, but a modified protocol may be less effective at sampling some bat species. The objective of this study was to determine whether a modified mobile acoustic monitoring protocol with reduced transect lengths is effective compared to the standardized NABat protocol. I recorded bat echolocation calls using Anabat acoustic detectors while driving transects at four sites (two “urban” and two “non-urban”) located in the Piedmont region of north-central North Carolina from May through August 2016. Two lengths of driving transect were sampled in each site: one “long” transect (about 25 km long, using NABat protocol) and 6 “short”
transects (about 3.2 km long each, using the modified protocol). Recorded echolocation call sequences were analyzed manually using AnalookW and automatically using Bat Call Identification and Echoclass software. PRESENCE software was used to compare differences in detection probability between the two protocols. Fewer short transects were needed to match the detection probability on long transects for Eptesicus fuscus, Lasiurus borealis, and Perimyotis subflavus, while more short transects were needed for
Lasionycteris noctivagans, Nycticeius humeralis, and Tadarida brasiliensis. The
modified mobile acoustic monitoring protocol with reduced transect lengths alleviates sampling issues in urban areas and was as effective as sampling using a single long transect, even with less time spent recording. Short transects can be used when applying NABat in urban areas, which is important to consider when designing acoustic
monitoring programs to study bats in those areas. Introduction
Examining the implications of habitat conversion and fragmentation on bat behavior is a conservation priority, including investigating activity pattern changes in urban areas (Schoener 1974, Kronfeld-Schor and Dayan 2003). Previous studies have shown that some traditional bat monitoring methods, such as mist-netting, may not be appropriate for all habitats, especially if they are open and away from water sources (Rodhouse et al. 2011). In addition, urban water sources may not be ideal places to capture bats, because activity has been shown to shift from urban water sources to water sources in agricultural areas (Gehrt and Chelsvig 2004).
Given the increasing need for studies of wildlife populations in urban areas and relative difficulty of using traditional monitoring methods in urban areas, acoustic monitoring techniques may be a good alternative to study nightly activity in urban bat populations. Recording bat echolocation calls with acoustic monitoring may be more efficient than other bat monitoring methods, which can help maximize area sampled (Whitby et al. 2014). An increased efficiency is especially important for broad scale studies in multiple locations with large sample sizes and study areas.
In order to record bat calls, acoustic detectors are placed in a stationary location for a fixed amount of time or used while walking, biking, or driving set paths (Johnson et al. 2002). Sampling bat activity using driving transects may be easier than stationary monitoring in areas dominated by private land, because attaching acoustic equipment is roof of vehicles eliminates the need to find appropriate locations to place equipment (Loeb et al. 2015).
Acoustic surveys, including mobile acoustic monitoring, are an important
component of many monitoring programs, including the North American Bat Monitoring Program (NABat; Loeb et al. 2015). The NABat Program is a long-term coordinated bat monitoring program that aims to help study the impact of multiple stressors on bat populations to support predicted trends in bat populations at multiple scales (Loeb et al. 2015). Mobile acoustic monitoring is used in the NABat monitoring program to
determine species detection and calculate an index of relative abundance of bat species in survey locations determined using probability-based selection (Loeb et al. 2015).
The North American Bat Monitoring Program (NABat) uses mobile acoustic surveys for long term monitoring along transects that are approximately 25 to 48 kilometers long within 100 km2 grid cells (Loeb et al. 2015). Transect routes vary
depending on road density and are created to pass through common habitat types without crossing back to reduce the probability of recording the same bat twice (Loeb et al. 2015). The NABat driving transect protocol suggests minimizing stops, driving at a constant speed on roads with relatively light traffic, and choosing routes that can be used to calculate relative abundance (Loeb et al. 2015).
Choosing driving transect routes in urban areas using the NABat protocol is difficult in areas with high road density or with many turns, stop signs, and traffic lights. The NABat protocol suggests using stationary detectors in urban areas due to the
difficulty of driving at a constant speed (Loeb et al. 2015), but adjusting the mobile monitoring protocol by reducing transect lengths may be a viable alternative that avoids biases of stationary sampling. In order to maximize time spent sampling using shorter transects, multiple short transects need to be sampled in the same area. Maximizing sampling time in this way can make the time spent sampling with short transects similar to the time spent sampling using the NABat protocol. If short transects are effective, the detection probability for both short transects and long transects should be similar with a similar amount of time spent sampling and using either transect length would detect the bat species present in each site.
Detection probability depends on species abundance and ability to record using acoustic surveys. If a species is not abundant or not easily sampled and identified using
acoustic surveys, then a shorter sampling window on a shorter transect length may be less effective than the NABat protocol. For example, E. fuscus may be sampled easily using acoustic surveys because it has a relatively low foraging flight height (from 4.9 meters over streams to 10 to 15 meters in forested areas; Kurta and Baker 1990) and an easily identifiable echolocation call pattern (Kaarakka et al. 2013). Similar to E. fuscus, L. borealis may be more easily sampled using acoustic surveys because it has a foraging
flight height from a few feet off the ground to treetop level (Shump and Shump 1982). L. borealis is also a very common bat in east-central states and can roost and feed in urban
areas (Shump and Shump 1982). L. noctivagans forages in open spaces with slower flight which may make it relatively easy to detect, but it has an echolocation call that is similar to E. fuscus which may affect its ease of identification (Kunz and Racey 1998). P. subflavus has an echolocation call with a unique frequency compared to the other
common bat species in the eastern U.S. and forages in edge habitats (Fujita and Kunz 1984). N. humeralis has an echolocation call that is difficult to identify because it is very similar to the echolocation call of L. borealis. While T. brasiliensis is harder to detect because it is a high flying species (Wilkins 1989, Schnitzler and Kalko 2001), its echolocation call has a relatively easily identifiable shape but with a frequency that can be very similar to E. fuscus when foraging in uncluttered space (Schnitzler and Kalko 2001). This species is also more likely to be sampled in areas with tall buildings, higher building density, and a high concentration of street intersections (Li and Wilkins 2014).
Using a modified mobile acoustic monitoring protocol with reduced transect lengths may be easier to implement in urban areas, but adjusting protocols in this way
may alter sampling effectiveness. The objective of this study was to determine whether a modified mobile acoustic monitoring protocol with reduced transect lengths is effective compared to the standardized NABat protocol. I predicted that the same bat species would be detected using the modified protocol and the NABat protocol if a similar amount of time was spent sampling. I also hypothesized that a modified transect protocol may not be effective for sampling some species, especially those that are uncommon or difficult to record and identify using their echolocation calls.
Methods
I monitored bat activity at 4 different sites in the Piedmont region of north-central North Carolina: Burlington (BR; city in Alamance and Guilford Counties; 36°02'37.0"N 79°29'07.9"W), North Greensboro (NG; city in Guilford County; 36°09'31.6"N
79°49'57.6"W), Pine Hall (PH; unincorporated community in Stokes County; 36°25'15.0"N 80°05'00.2"W), and Siler City (SC; town in Chatham County;
35°37'41.3"N 79°24'00.5"W); Figure 3.1). The 4 sites were used as spatial replicates. The acoustic monitoring sites varied in urban intensity. The North Greensboro and Burlington sites were in residential/industrial areas with surrounding public parks and other greenspaces. The Pine Hall and Siler City sites were in areas surrounded by agriculture, pastureland, and forest patches. Urban intensity of the study sites was calculated using National Land Cover Database 2011 developed land categories for a 1-km buffer surrounding each long transect and all 6 short transects (Homer et al. 2015, Schimpp 2017).
Field Methods
Two mobile monitoring protocols were used in this study: the standard NABat protocol using “long” driving transects and a modified protocol using “short” driving transects. Each site had one long transect and 6 short transects. Multiple short transects in a single site were used to determine how many short transects would be needed to match the detection probability as the long transect in each site.
Each long transect was approximately 25 kilometers long. Long transects for Burlington, Pine Hall, and Siler City were identical to the ones used by the NABat program and were created to pass through common habitat types of the area (Figures 3.1a, 3.1c, 3.1d, Loeb et al. 2015). The long transect in North Greensboro was not created to pass through common habitats in the Greensboro metropolitan area and instead used a route that would be safe to drive at 32 km/hr given traffic intensity throughout the city (Figure 3.1b, Loeb et al. 2015). I began driving each long transect 45 minutes after sunset.
Each short transect was about 3.2 kilometers in length. Short transects were chosen to minimize travel time between transects and avoid high traffic areas while being safe to drive at 32 km/hr even in areas with high road density. Unlike long transects, short transects were not created to pass through common habitat types. All short transects were in an approximate 4-kilometer radius within their respective grid cells where possible (Figure 3.1). There was minimal overlap of the short transects with each other, but the short transects overlapped with the long transect in some sites. All 6 short transects were
driven back to back at one time in a predetermined randomized order. I began driving the first short transect for each night 45 minutes after sunset.
Anabat acoustic detectors (Anabat SD2, Titley Scientific, Australia) were used for mobile acoustic monitoring with driving transects (Schimpp 2017). Each long transect and each short transect was sampled twice within approximately one week (temporal replicates) in each of the four sampling months (May through August 2016) (Loeb et al. 2015).
Acoustic Analyses
Automated and manual approaches were used to analyze bat call recordings from transects using AnalookW (version 4.1t; Titley Scientific, Australia), Bat Call
Identification (BCID version 2.7c; Bat Call Identification, Inc., Missouri, USA), and Echoclass (version 3.1; U.S Army Engineer Research and Development Center,
Mississippi, USA; Schimpp 2017). All of the analyzable bat calls with 4 or more search phase pulses in about one second were manually identified to species based on species-specific echolocation call characteristics including frequency and pulse shape (Schnitzler and Kalko 2001). All of the analyzable files were manually identified to a species or species group or labeled as not able to be identified to species (NOID). Main target species for the sampled region were: Eptesicus fuscus (big brown bat), Lasionycteris noctivagans (silver haired bat), Lasiurus borealis (red bat), Lasiurus cinereus (hoary bat),
Myotis lucifugus (little brown bat), Myotis septentrionalis (northern long eared bat),
Statistical Analyses
Six subsets of short transects were used in analyses: (1) the first short transect, (2) the first two short transects, (3) the first three short transects, (4) the first 4 short
transects, (5) the first 5 short transects, and (6) all 6 short transects.
Paired t-tests were used to compare time spent sampling and recording on long transects in all 4 study sites compared to time spent sampling and recording on short transects (subsets with all 6 short transects) in all 4 study sites. The null hypothesis was that there is no difference in time spent sampling and recording on long transects and short transects (subsets with all 6 short transects). The average time spent sampling for short transects included the travel time between transects while the detector was not recording.
Detection/non-detection data for each species was used to compare detection probabilities on long transects and each subset of short transects using program PRESENCE (version 11.5; Hines 2006). Calls from L. cinereus were not included in detection probability analyses due to the very low recorded call numbers for this species. Calls from Myotis spp were not included in detection probability analyses due to the inability to distinguish the species-specific differences in the echolocation calls.
For all PRESENCE analyses, detection was defined as at least one bat call per species per site and all models were run using single season analyses. Detection/non-detection values for long transects were from the single long transect in each site. Detection/non-detection values for short transects were from the 6 subsets of short transects in each site. The detection/non-detection values on short transects were
calculated from the number of calls from each species on the first short transect driven, the first two short transects driven, the first three short transects driven, the first 4 short transects driven, the first 5 short transects driven, or all 6 short transects driven.
Detection/non-detection values on long and short transects were used to compare model ranks using a null model that long transects had the same detection probability as short transects and an alternative model that long transects had a different detection probability than short transects (Hines 2006). The null model had constant occupancy probability (psi(.)) and constant detection probabilities (p(.)), while the alternative model had a constant occupancy probability (psi(.)) and a non-constant detection probability (p(L-#)) where L represents the long transect and # represents the number of short transects. There were 6 models for each species made by editing the detection model design matrix to represent that the short transect detection values were different from long transect detection values. These models included data from the long transect and the first short transect driven (p(L-1)), the long transect and the first two short transects driven (p(L-2)), the long transect and the first three short transects driven (p(L-3)), the long transect and the first 4 short transects driven (p(L-4)), the long transect and the first 5 short transects driven (p(L-5)), and the long transect and all 6 short transects driven (p(L-6)).
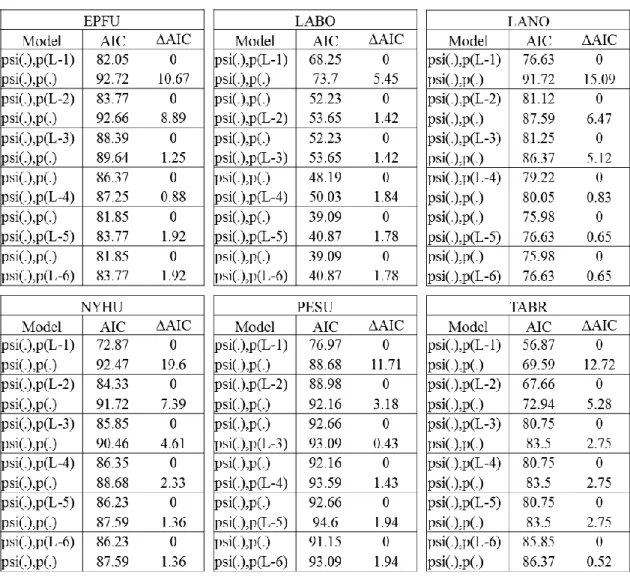
Akaike information criterion (AIC) was used to interpret differences in detection probability between short transects and long transects (Hines 2006). Delta Akaike information criterion (ΔAIC) values, or the relative difference in AIC values between each model and the model with the smallest AIC, were compared between each null
model and alternative model (Hines 2006). Model comparisons where the null model had a ΔAIC value less than 2 substantially supported that there is no difference in detection probability between long and short transects (Burnham and Anderson 2004). These values were compared for each subset of short transects to determine how many short transects were needed to equal the detection probability of the long transect for each species.
Results
Long transects in North Greensboro and Burlington had developed land cover percentages of 78.7% and 31.0% respectively. Short transects in North Greensboro and Burlington had developed land cover percentages of 76.0 % and 31.2% respectively. Long transects in Pine Hall and Siler City had developed land cover percentages of 6.2% and 5.8% respectively. Short transects in Pine Hall and Siler City had developed land cover percentages of were 5.8% and 6.8% respectively.
Acoustic data were collected over 64 nights from 5 May 2016 to 26 August 2016, with 4 nights per site per month (2 nights of short transects and 2 nights of long
transects). A total of 2,180 manually identified calls (with 1040 identified to species) were recorded over the entire study with 1,317 calls recorded along a total of 32 long transects and 863 calls recorded along a total of 192 short transects (Table 3.1). The average number of calls per long transect was 41.2 calls and the average number of calls per short transect was 4.5 calls. Bat calls were identified to 8 species (or species groups): Eptesicus fuscus (EPFU), Lasiurus borealis (LABO), Lasiurus cinereus (LACI),
(NYHU), Perimyotis subflavus (PESU), and Tadarida brasiliensis (TABR). The percent of total calls that were not able to be identified to species was 51.7%. A total of 1,030 bat calls were used for analyses, from 6 species: E. fuscus, L. borealis, L. noctivagans, N. humeralis, P. subflavus, and T. brasiliensis.
There was a significant difference between time spent recording on long transects and time spent recording on short transects (subsets with all 6 short transects) in all sites (df = 31, p < 0.001). There was also a significant difference between time spent sampling on long transects and time spent sampling on short transects (subsets with all 6 short transects) in all sites (df = 31, p = 0.026).
The average time spent sampling and recording on long transects was 61.5 min. The average time spent sampling the first short transect was 5.9 min, the first 2 short transects was 17.2 min, the first 3 short transects was 27.3 min, the first 4 short transects was 37.6 min, the first 5 short transects was 48.1 min, and all 6 short transects was 58.2 min. These average times spent sampling for short transects included the travel time between transects while the detector was not recording. The average time spent recording during these sampling times were: 5.9 min for the first short transect, 11.7 min for the first 2 short transects, 17.3 min for the first 3 short transects, 22.8 min for the first 4 short transects, 28.3 min the first 5 short transects, and 34.0 min for all 6 short transects. The average time recording on any short transect (not just the first one in the set) was 5.7 min.
Detection probability for short transects varied by species. For L. borealis the ΔAIC value was 0 for the null model where the alternative model included the first two short transects (psi(.),p(L-2)), meaning that when two short transects are driven, the
detection probability for this species would be the same as driving a long transect (Table 3.2 and Figure 3.2). Sampling using only one short transect would not be as effective as the long transect for this species, since the ΔAIC value was 5.45 for the null model where the alternative model included only the first short transect (psi(.),p(L-1)).
The detection probability for the other species can be interpreted in a similar way. The model comparison where the null model had a ΔAIC value less than 2 included 3 short transects for E. fuscus and P. subflavus (psi(.),p(L-3); ΔAIC 1.25 for E. fuscus, 0 for P. subflavus; Table 3.2 and Figure 3.2). For T. brasiliensis the ΔAIC value was 0.52 for
the null model where the alternative model included all 6 short transects (psi(.),p(L-6); Table 3.2 and Figure 3.2). For L. noctivagans the ΔAIC value was 0.83 for the null model where the alternative model included 4 short transects (psi(.),p(L-4); Table 3.2 and Figure 3.2). For N. humeralis the ΔAIC value was 1.36 for the null model where the alternative model included 5 short transects (psi(.),p(L-5); Table 3.2 and Figure 3.2). Model
comparisons with a single short transect (psi(.),p(L-1)) had null models with ΔAIC values greater than 10 for all species (except L. borealis), indicating no support for single short transects having the same detection probability as long transects (Burnham and Anderson 2004).
Overall, while all 6 species were detected using the modified protocol, the subset with only a single short transect was not as effective as the long transect for any species and one species (T. brasiliensis) required 6 short transects to have the same detection probability as the long transect.
Discussion
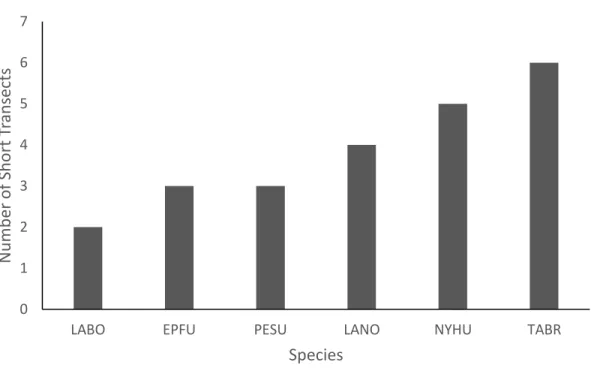
The modified protocol detected all 6 target species, but multiple short transects were needed to match the detection probability on long transects for these species. Fewer short transects were needed to detect E. fuscus, L. borealis, and P. subflavus, while more short transects were needed to detect L. noctivagans, N. humeralis, and T. brasiliensis. Even though the time spent recording using the modified protocol with 6 short transects is less than time spent recording on long transects, sampling using 6 short transects is as effective as sampling using a single long transect for bat species in this study area.
The subset of short transects with only one short transect was not effective for sampling any species. There was minimal support for the model comparison with a single short transect (psi(.),p(L-1)) for L. borealis because the null model had a ΔAIC values of 5.45 transects (Burnham and Anderson 2004). While the species in my study all have an initial foraging period within the first 2 or 3 hours after sunset (Kunz 1973), the time spent sampling a single short transect (5.7 min) was too short to effectively sample any of these bat species. While there was extra time spent not recording between short transects, they were still able to detect the same species as long transects in the time allotted. T. brasiliensis is the only species where it would not matter if the modified protocol or the
NABat protocol was used because this species had the same detection probability for one long transect and 6 short transects.
The number of short transects needed to match the detection probability on long transects corresponds to how easily the bat species are to record along driving transects. E. fuscus and L. borealis were detected with fewer short transects because they are
common in the southeast and have relatively high abundance (Shump and Shump 1982, Kurta and Baker 1990, Agosta 2002, Johnson et al. 2008, Kaarakka et al. 2013). Fewer short transects were also needed for sampling P. subflavus because it forages along forest edges (Fujita and Kunz 1984). More short transects were needed for sampling L.
noctivagans because it is an uncommon resident in the summer in the Piedmont area of
North Carolina (Lee et al. 1982). This species also has slower flight with efficient, frequency-modulated calls that do not travel as far (Barclay 1985). More short transects were needed to detect T. brasiliensis since it is uncommon in the Piedmont region of North Carolina (Johnson et al. 2008).
A modified protocol with short transects alleviates sampling issues in urban areas and can be as effective as a single long transect, even with less time spent recording. Short transects can be used when applying NABat in urban areas, which is important to consider when designing acoustic monitoring programs to study bats in those areas.
Figures/Tables
Figure 3.1. Locations of Long and Short Driving Transects for Mobile Acoustic Monitoring in Burlington (a), North Greensboro (b), Pine Hall (c), Siler City (d) in the Piedmont Area of North Carolina (e). Urban intensity of the study sites is shown with developed land categories from National Land Cover Database 2011 in shades of red (Homer et al. 2015).