Procedia Engineering 145 ( 2016 ) 852 – 859
1877-7058 © 2016 The Authors. Published by Elsevier Ltd. This is an open access article under the CC BY-NC-ND license (http://creativecommons.org/licenses/by-nc-nd/4.0/).
Peer-review under responsibility of the organizing committee of ICSDEC 2016 doi: 10.1016/j.proeng.2016.04.205
ScienceDirect
International Conference on Sustainable Design, Engineering and Construction
Data-Driven Methodology for Energy and Peak Load Reduction of
Residential HVAC Systems
Kristen Sara Cetin
a*, Catilyn Kallus
b aIowa State University, Department of Civil, Construction and Environmental Engineering, Ames, IA, 50011, USA
bUniversity of Texas at Austin, Department of Civil, Architectural and Enviornmental Engineering, Austin, TX, 78712, USA
Abstract
Residential buildings in the United States are responsible for the consumption of approximately 38% of electricity, and for much of the fluctuations in the power demands on the electric grid, particularly in hot climates. Residential Heating, Ventilation, and Air Conditioning (HVAC) systems are one of the largest electricity users of homes in these regions. "Smart" technologies, including electric grid-connected devices and home energy monitoring systems are increasingly available and installed in buildings, enabling new, data-driven methodologies for the operation of smarter, more sustainable building systems. This research investigates the use of residential energy use data and smart connected thermostat data to continuously monitor the health and performance of residential HVAC systems. Using field-collected HVAC energy consumption and performance data to develop a process-history based model, the results of this research suggest that the use of this methodology can save up to 6% of annual energy use of residential buildings. © 2015 The Authors. Published by Elsevier Ltd.
Peer-review under responsibility of organizing committee of the International Conference on Sustainable Design, Engineering and Construction 2015.
Keywords:Residential Buildings; Smart Grid; Data Analytics; HVAC Systems
1. Introduction
Concerns regarding the increasing energy use in the United States and the need for reduction in greenhouse gas emissions have driven an increased interest and focus on improving energy efficiency of buildings, as well as reducing peak electric grid load contributions of buildings. Residential buildings in particular are a strong target for such efforts, as they represent approximately 38% of electricity consumption and over 20% of energy consumption in the U.S [1]. In addition, residential buildings have been found to be responsible for over 50% of the peak electricity loads [2]. In response to these energy challenges, the modernized electric grid, or “smart” grid has developed. The smart electric
© 2016 The Authors. Published by Elsevier Ltd. This is an open access article under the CC BY-NC-ND license (http://creativecommons.org/licenses/by-nc-nd/4.0/).
grid includes a virtual network that uses information and digital communication technologies which enable two-way communication between different aspects of the electric grid. Smart meters, for example, have seen significant growth in implementation, from 1/3 of residential buildings in 2012, to approximately 50% by 2015 [3]. In addition to providing advantages to the utility companies, including remote meter reading and real-time detecting outages, smart meters also collect more granular energy use data for residential buildings than previously has been available.
Similarly, in recent years there has been a growing interest in “smart” homes, or residential buildings that are equipped with wireless and/or wired devices that enable the control and monitoring of the building’s electronic devices and systems. The number of smart devices, often collectively called the Internet of Things (IoT), that are being developed and are commercially available have increased significantly in recent years. Recent market studies have projected that smart home connected devices will increase significantly, by 21% by 2020 [4], or a total of 38 billion IoT devices [5]. The increasing number of devices presents a significant opportunity to utilize the data and information collected from these devices to develop analytics and methodologies to improve energy efficiency and reduce peak load contributions of residential buildings. This can be accomplished through using the data to continuous monitor the performance of residential buildings and their systems. The analytics of this data from multiple devices, or combined with smart grid connected devices still remains relatively unexplored, and thus can benefit from further analysis.
To improve energy performance of residential buildings, it is advantageous to target the highest energy users of these buildings. In most climate zones, the heating, ventilation and air conditioning (HVAC) systems are significant users of electricity, amounting, on average, to approximately 40%-56% of electricity use in the U.S. depending on the climate zone of the building considered [6]. HVAC systems also significantly contribute to peak electricity loads, and are thus the focus of this research. Residential HVAC systems, unlike commercial HVAC systems, typically do not have established maintenance schedules or contracts. Homeowners typically call for maintenance when there is a problem or the equipment fails. In these situations, the HVAC service contractor must assess problems rapidly and fix the equipment such that it runs again, but not necessarily such that it runs in its optimally efficient state. For example, in a recent survey of 243 residents of single family homes in Austin, TX, 80% of residents indicated that their HVAC system have not been serviced in over a year, and 28% had never serviced their system since installation [7]. This lack of maintenance has also been found in large-scale studies of HVAC systems. The most common problems found include high or low refrigerant charge, air flow restrictions to the evaporator and/or condenser, refrigerant line restrictions, presence of non-condensables, and short cycling [8-12]. The two most common faults include improper airflow and improper refrigerant charge, which were present in 44-50% and 57-82% respectively, of all HVAC systems tested in these large-scale studies. Thus developing a methodology to track in real time, the performance of a residential HVAC system, can help efforts to reduce the significant amount of residential HVAC systems not functioning efficiently as they were designed.
In this research, the potential is assessed for the use of smart and connected devices installed in residential buildings to determine, in real time, the health and performance of a residential HVAC system. This research is divided into several sections. The methodology section includes an inverse modeling approach that utilizes smart home device collected data to establish a baseline model and basis of comparison for future data. The characteristics of residential HVAC systems common in most US homes are also reviewed to establish performance characteristics to target for monitoring and analysis, as are the types of data produced by smart devices that may be available in residential buildings. These include variables that can be directly measured, data that can be derived from this direct data, and their influence on HVAC performance. An analysis of field and laboratory collected data of residential HVAC systems is used to establish a black-box inverse baseline model of a properly functioning HVAC system, and the affect that one of the most common inefficiencies, condenser airflow reduction, has on this model. Finally, the energy use and peak load reduction potential that the correction of the condenser air flowrate is predicted to have if the airflow rate is corrected is assessed. The conclusions section discusses the overall finding and future work needed.
2. Methodology & Results
To monitor HVAC system performance through data directly collected from or derived from smart home devices, an inverse modeling approach is followed. Inverse modeling, also known as data-driven modeling, requires training data, including both dependent (forcing) variables and independent (output) variables. These data are used to establish a model that explains the relationship between the dependent and independent variables. In this case, it is desired to create model that represents the relationship of a properly functioning residential HVAC system. This system serves as a baseline upon which to compare the HVAC system performance over time. In developing this model, it is prudent to first review the characteristics of a typical HVAC system and the thermostat used to control them, used in U.S. homes.
2.1. Characteristics of typical residential HVAC systems in the U.S.
The type of HVAC system monitored affects the data that is generated from the use of this system. The most common type of residential HVAC system in the United States is a split system which includes an outdoor condensing unit and compressor, and an indoor evaporator coil and air handler or furnace. Of the 87% of U.S. households that have an HVAC system, between 44% and 85% of households have a central system rather than a window or wall unit [6]. In these systems, heated and cooled air is generally distributed through ducts in the ceiling or floor to each of the conditioned rooms in the building. Residential HVAC systems, unlike many commercial HVAC systems, do not continuously run, rather they cycle ON and OFF. The system is turned ON when the thermostat indicates that the temperature inside of the building in the location of the thermostat is higher than the cooling setpoint temperature (summer) or lower than the heating setpoint temperature (winter) plus the deadband temperature, or range of tolerance the temperature is allowed to swing above or below the setpoint before the system is engaged. Some thermostats have a heating mode and a cooling mode, and some have both heating and cooling setpoints that can be set simultaneously, allowing for either heating or cooling to occur. Cooling is generally provided by a central air conditioning system and heating is generally provided by a heat pump or a fossil fuel-fired furnace. Many residential HVAC systems in the U.S. are single-stage systems with only one level of heating or cooling, however dual-stage and more advanced HVAC systems are gaining interest and market share [13].
2.2. Smart home data sources and variables
A number of smart technologies and smart home devices available commercially today are assessed that may aid in assessing HVAC performance. A residential building’s HVAC use is governed by may influencing factors or forcing variables, some of which can be easily measured directly through smart devices, and some which can be derived from measured values. Table 1 depicts categories of smart devices and their possible use in evaluation of HVAC performance. This table lists the smart device category, the specific type of device, direct and derived data that can be obtained from each device, how the data may be used to assess HVAC use, and the relative costs to the homeowner to purchase and install the device. The cost to the homeowner is a relative ranking based on the current costs of commercially available sensors that measure this information. Not all categories smart home devices are included in this list as some devices have limited relevance regarding HVAC performance. In addition, not all possible variables that can be measured are included, as the data measured varies by device. In this table, how the data can be used for HVAC monitoring is designated in two categories, independent variables (IV) and dependent variables (DV). The independent variables are values that directly measure the performance and use of the HVAC system, and the dependent variables represent forces that act on the HVAC system and influence its performance.
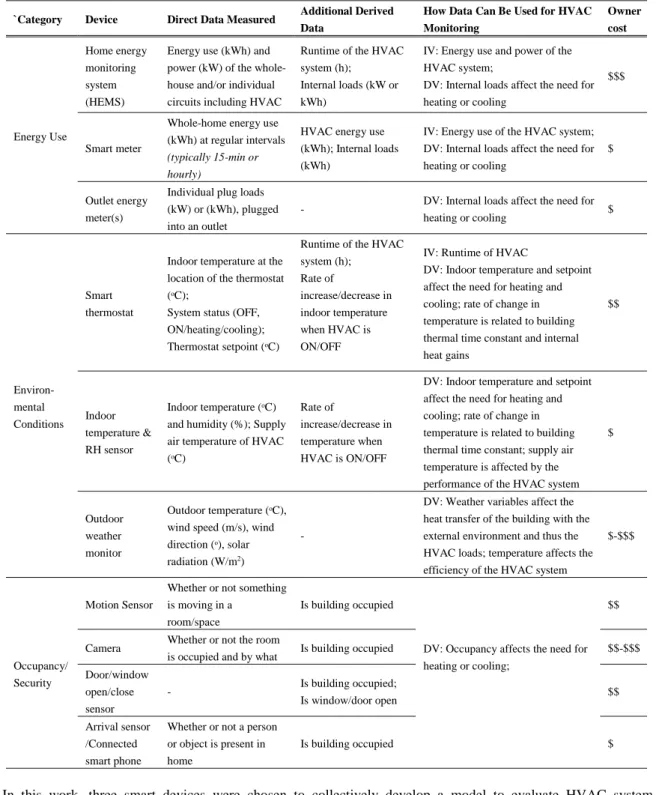
Table 1: Smart home devices and relevant data collected for HVAC performance monitoring (IV: independent variable; DV: dependent variable)
`Category Device Direct Data Measured Additional Derived Data
How Data Can Be Used for HVAC Monitoring Owner cost Energy Use Home energy monitoring system (HEMS)
Energy use (kWh) and power (kW) of the whole-house and/or individual circuits including HVAC
Runtime of the HVAC system (h);
Internal loads (kW or kWh)
IV: Energy use and power of the HVAC system;
DV: Internal loads affect the need for heating or cooling
$$$
Smart meter
Whole-home energy use (kWh) at regular intervals
(typically 15-min or hourly)
HVAC energy use (kWh); Internal loads (kWh)
IV: Energy use of the HVAC system; DV: Internal loads affect the need for heating or cooling
$
Outlet energy meter(s)
Individual plug loads (kW) or (kWh), plugged into an outlet
- DV: Internal loads affect the need for heating or cooling $ Environ-mental Conditions Smart thermostat
Indoor temperature at the location of the thermostat (ஈC);
System status (OFF, ON/heating/cooling); Thermostat setpoint (ஈC)
Runtime of the HVAC system (h); Rate of increase/decrease in indoor temperature when HVAC is ON/OFF
IV: Runtime of HVAC
DV: Indoor temperature and setpoint affect the need for heating and cooling; rate of change in temperature is related to building thermal time constant and internal heat gains $$ Indoor temperature & RH sensor Indoor temperature (ஈC) and humidity (%); Supply air temperature of HVAC (ஈC)
Rate of
increase/decrease in temperature when HVAC is ON/OFF
DV: Indoor temperature and setpoint affect the need for heating and cooling; rate of change in temperature is related to building thermal time constant; supply air temperature is affected by the performance of the HVAC system
$
Outdoor weather monitor
Outdoor temperature (ஈC), wind speed (m/s), wind direction (ஈ), solar radiation (W/m2)
-DV: Weather variables affect the heat transfer of the building with the external environment and thus the HVAC loads; temperature affects the efficiency of the HVAC system
$-$$$
Occupancy/ Security
Motion Sensor
Whether or not something is moving in a
room/space
Is building occupied
DV: Occupancy affects the need for heating or cooling;
$$
Camera Whether or not the room
is occupied and by what Is building occupied $$-$$$ Door/window open/close sensor - Is building occupied; Is window/door open $$ Arrival sensor /Connected smart phone
Whether or not a person or object is present in home
Is building occupied $
In this work, three smart devices were chosen to collectively develop a model to evaluate HVAC system performance. These include a home energy monitoring system, outdoor weather monitor, and a thermostat. Additional data collected from other smart home technologies, as mentioned in Table 1, also has the potential to be used in the development of such a model, however this is outside of the scope of this evaluation and is the subject of ongoing
work. Weather data was chosen, with a specific focus on temperature data since temperature sensors are relatively inexpensive to a homeowner, or can possibly be taken from already existing weather data collection mechanisms located near the home under evaluation such as at a university, airport, school or other location. In addition, previous research has found that weather and temperature data correlate well with HVAC use in residential buildings for the development of inverse models [14].
The methodology developed to create the inverse model for baseline performance includes first the cleaning of the data collected, and second the use of a black-box model. To demonstrate this methodology and determine the length of monitoring needed, energy data used for this research was collected by a home energy monitoring system [15] installed in single family residential building in Austin, TX. Figure 1 provides an example of the data collected for an
HVAC system’s outdoor and indoor unit from this system, measured on August 3rd, 2014 (HVAC in cooling mode).
Representative data from thermostat (indoor temperature), and from a weather station and outdoor temperature sensor is also shown. Outdoor temperature data (5-minute interval data) was also collected from a local weather station in Austin, TX. Comparison to weather station data collected at the home found strong agreement.
Fig. 1. Example data from the HVAC circuit of a home energy monitoring system, thermostat indoor temperature data, and outdoor weather monitor’s outdoor temperature.
2.3. Baseline HVAC performance
To establish a model that represents a properly functioning HVAC system baseline upon which to compare future use, it is necessary to assume that the system is properly functioning. As discussed in previous works, installation errors and faults can occur and have an effect on HVAC performance even from the start of the use of the system [9-10]. Thus this methodology works to detect HVAC system performance changes that occur after the initial baseline is established.
The first step includes cleaning the data. For the home energy monitoring system (HEMS) data, the data was quality controlled to remove false spikes in the data caused by changes in settings to the HEMS device. It was also cleaned to remove home data with missing measurements. The accuracy of the data was also evaluated to determine the error in measurements. As the baseline HVAC performance is established, the threshold value above which a fault or inefficiency is considered to occur is needed. For the data used to develop this methodology, 1-minute interval data was used, with an accuracy of +/- 1%. Previous studies have also found measurements to be in good agreement with utility meter data; more details on the data collection methodology are discussed in [16]. Temperature data was
collected with sensors with an accuracy of +/- 0.6ஈC.
For the inverse model, the independent variables considered included the power consumption (kW) and energy use
temperature (ஈC). To utilize the power consumption data, the data was first filtered to only include data when the system is ON and running in a steady-state condition. To do so, k-means clustering was used to cluster the data into three clusters (k = 3). The first cluster represents when the system is OFF (power is close to or at 0 kW), the second when the system is ON, and third when the system is turning ON or turning OFF. As shown in Figure 1, due to the averaging of the data over the 1-minute intervals during which the data is recorded, when the system is turning ON or OFF, the power is recorded as a value between the OFF and ON states. Figure 2a shows the clusters of these data for a 5-day period, including the power of the outdoor unit (kW) plotted over time (minutes). Eliminating the clusters of data when the system is OFF or turning ON or OFF (Clusters 2 and 3), as well as eliminating the first 5 minutes of data for when the system cycles ON to remove the transient periods of HVAC use, Figure 2b, shows the relationship between outdoor temperature data and power of the outdoor unit of the HVAC (kW). Depending on the size and properties of the HVAC system under evaluation, the power draw of the outdoor unit will vary, however the relationship between outdoor temperature and power will be similar. This strong relationship between the power consumption was validated using the HVAC modeling program ACHP [17].
Fig. 2. (a) Power data (kW) of a residential HVAC system plotted over time including all power data; blue is when the system is ON (Cluster 1) and orange is when the system is OFF or turning OFF or ON (Cluster 2 and 3). (b) Power data when the system is ON and in steady-state
condition vs. outdoor temperature.
A black-box inverse modeling approach was chosen and utilized for this research. Least squares regression analysis was chosen for its low computational intensity. Using the one-minute data, a regression analysis with one dependent variable (outdoor temperature) and one output variable (HVAC power (kW)) (Figure 2b). For the representative home shown in Figure 2, this model has a high R2value indicating a strong relationship between the two variables. This R2
value was achieved after approximately 40 hours of monitoring, or approximately 5.6 hours of runtime (Figure 3).
Fig. 3. The R2value of the inverse model compared to the length of training data utilized.
y = 0.0317x + 2.0738 R² = 0.8501 2 2.2 2.4 2.6 2.8 3 3.2 3.4 20 25 30 35 40 Pow er of Ou td oor Un it (k W ) Outdoor Temperature (C) 0 0.5 1 1.5 2 2.5 3 3.5 0 2000 4000 6000 8000 Pow er of Ou td oor Un it (k W ) Time (min) Total Runtime Total Time Monitored 0 1 2 3 4 5 0 0.2 0.4 0.6 0.8 1 0 5 10 15 20 25 30 35 40 Total Runtime (hrs) R ^ 2 of I nv er se Mode l Time Monitored (hrs)
Using a dataset of 150 HVAC use data collected in the same manner using the same equipment for single family homes located in the Austin, TX area [7], a model was created for each home’s HVAC. For the 150 homes evaluated, the average error between the predicted and actual HVAC was found to be 1-5% error, with the range of error values spanning from 0% to 10% for a training period of 40 hours.
2.4. Changes in variables due to HVAC inefficiency
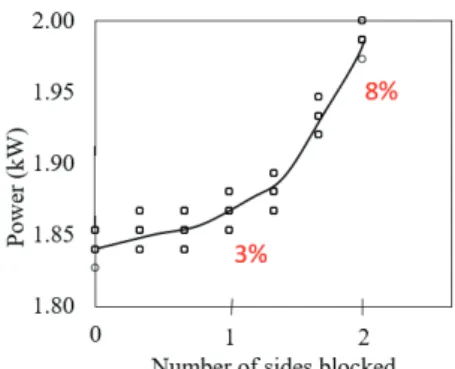
To determine the effect of a reduction in air condenser flowrate on the power draw of the HVAC system, a series of tests were conducted on a residential split HVAC system. Flowrate was reduced utilizing polyethylene sheets to reduce the volume of air intake into to the outdoor condenser/compressor unit. Since the outdoor wind speed can affect the flowrate to the condenser, care was taken to conduct these experiments during calm wind periods. After a portion of the condenser air intake was blocked, a timer was set for 15 minutes to allow the system to return to steady-state. After the 15 minutes the power draw (kW) was measured. The results from this testing are shown in Figure 4. Up to 50% of the condenser was blocked in this test.
Fig. 4. Change in power of the outdoor HVAC unit with increase in the condenser air blocked.
The results of this testing indicate that a with an up to 50% blockage, the change in power (kW) is 8%, higher than the average 1-5% found in the analysis of the error in the baseline model developed. This indicates that with this level of fault, a change in the power consumption of the HVAC system for a given outdoor temperature would be distinguishable from the average error in the baseline model.
2.5. Evaluation of energy savings & peak load reduction
To determine the energy savings potential of continuously monitoring a residential HVAC system, it is assumed a fault in a residential building exists. Considering the results of previous survey studies of residential HVAC systems that found up to 50% of HVAC systems have incorrect airflow, this assumption is valid for many residential buildings in the US. Energy savings potential is evaluated using the seasonal runtime fractions of HVAC systems calculated from Cetin and Novoselac [18]. For homes in warm climate zones in which energy savings and peak load reduction are the most needed, an average runtime fraction of 20%, or on average 34-40% for summer, 7-10% for transition seasons, and 7-17% for winter seasons. Utilizing these runtimes and a reduction of up to 8% in power draw due to the correction of the inefficiency, the saving in energy use achieved would be up to 6% of whole-home energy use, assuming HVAC energy use makes up 43% of consumption in residential buildings [19]. The peak load reduction achieved for a 50% inefficiency is equivalent to the reduction in power draw achieved (8%).
3. Conclusion
This study evaluated the use of data collected from several smart home devices to monitor the performance of a residential HVAC system. Utilizing a black-box inverse model, it was found that a baseline model of HVAC performance can be developed with sufficient accuracy to detect the occurrence of reduction in condenser airflow that, if corrected, will reduce the energy demands and peak load contribution of the HVAC system. The analysis conducted in this research assumes a baseline model in which the HVAC system being monitored is functioning properly without fault, which may not necessarily be the case. This is a limitation of this methodology that is currently being further researched. Additional field testing of other HVAC systems and other types of faults is recommended to further validate and improve the presented results.
The results of this work help to improve understanding of the effects of improperly functioning HVAC systems on the energy use and electricity demand. As smart home devices grow in their implementation in residential buildings, the additional data and information that can be collected and analyzed will increase. Thus determining additional variables and smart device generated information to assess HVAC performance is the subject of ongoing work.
Acknowledgements
Residential energy data and building information was provided in coordination with the Pecan Street Research Institute.
References
[1] U.S. Energy Information Administration. (2015). Energy Consumption Estimates by Sector 1949-2020. U.S. Department of Energy, Washington D.C., U.S.A.
[2] Electricity Reliability Council of Texas (ERCOT). 2013. Long-Term Hourly Peak Demand and Energy Forecast. 2013 ERCOT Planning. [3] Innovation Electricity Efficiency (IEE). 2012. Utility-Scale Smart Meter Deployments, Plans and Proposals. Edison Foundation, Washington,
D.C. USA.
[4] ABI Research. (2015). Smart Home Bi-Annual Review. https://www.abiresearch.com/
[5] Juniper Research (2015). The Internet of Things: Consumer, Industrial & Public Services 2015-2020. http://www.juniperresearch.com/home [6] U.S. Energy Information Administration. (2009). 2009 RECS, Residential Energy Consumption Survey, U.S. Department of Energy,
Washington D.C., U.S.A.
[7] Dataport. Pecan Street Research Institute. https://dataport.pecanstreet.org/
[8] J. Proctor, J (2004). Residential and Small Commercial Central Air Conditioning; Rated Efficiency isn’t Automatic. Presentation at the Public Session. ASHRAE Winter Meeting, Anaheim, CA.
[9] T. Downey, J. Proctor, J. (2002). What Can 13,000 Air Conditioner’s Tell Us? 2002 ACEEE Summer Study on Energy Efficiency in Buildings, American Council for an Energy Efficient Economy, Washington, DC.
[10] Proctor, J.P. (1997). Field Measurements of New Residential Air Conditioners in Phoenix, Arizona. ASHRAE Transactions, 103(2), 406-415. [11] T.M. Rossi. (2004) Unitary Air Conditioner Field Performance. International Refrigeration and Air Conditioning Conference at Purdue, Paper
No. R146, West Lafayette, IN.
[12] R.J. Mowris, A. Blankenship, E. Jones. (2004). Field Measurements of Air Conditioners with and without TXVs. ACEEE 2004 Summer study on Energy Efficiency in Buildings, American Council for an Energy Efficient Economy, Washington, DC.
[13] A Lekov, V. Franco, J. Lutz. (2006). Residential Two-Stage Gas Furnaces: Do they save energy? 2006 ACEEE Summer Study on Energy Efficiency in Buildings. 2006 ACEEE Summer Study on Energy Efficiency in Buildings, American Council for an Energy Efficient Economy, Pacific Grove, CA
[14] ASHRAE. (2013). ASHRAE Handbook: Fundamentals. Chapter 19: Energy Estimatinig and Modeling Methods. American Society of Heating, Refrigeration and Air Conditioning Engineers. Atlanta, GA.
[15] eGauge. (2015). eGauge 3 Series Datasheet & Specifications. http://www.egauge.net/docs/eGauge_Spec_2015.pdf
[16] JD Rhodes, CR Upshaw, CB Harris, CM Meehan, DA Walling, PA Navrátil …& ME Webber. (2014). Experimental and data collection methods for a large-scale smart grid deployment: Methods and first results. Energy. 65, 462-47.
[17] I. Bell (2015). ACHP Software. http://achp.sourceforge.net/
[18] K.S. Cetin, A. Novoselac (2015). Single and multi-family residential central all-air HVAC system operational characteristics in cooling dominated climate. Energy and Buildings, 96, 210-220.