Marquette University
e-Publications@Marquette
Biomedical Engineering Faculty Research and
Publications
Biomedical Engineering, Department of
1-1-2017
Structurofunctional Resting-State Networks
Correlate with Motor Function in Chronic Stroke
Benjamin Kalinosky
Marquette University, [email protected]
Reivian B. Barillas
Concordia University, Mequon Wisconsin
Brian D. Schmit
Marquette University, [email protected]
Published version.
NeuroImage: Clinical
, Vol. 16 (2017): 610-623.
DOI
. © 2017 The Authors.
Published by Elsevier Inc. This is an open access article under the CC BY-NC-ND license.
Contents lists available atScienceDirect
NeuroImage: Clinical
journal homepage:www.elsevier.com/locate/ynicl
Structurofunctional resting-state networks correlate with motor function in
chronic stroke
Benjamin T. Kalinosky
a, Reivian Berrios Barillas
b,1, Brian D. Schmit
a,⁎aDepartment of Biomedical Engineering, Marquette University, Milwaukee, WI, USA bDepartment of Physical Therapy, Marquette University, Milwaukee, WI, USA
A R T I C L E I N F O
Keywords: Stroke Structural connectivity Functional connectivity Structurofunctional correlationA B S T R A C T
Purpose:Motor function and recovery after stroke likely rely directly on the residual anatomical connections in the brain and its resting-state functional connectivity. Both structural and functional properties of cortical networks after stroke are revealed using multimodal magnetic resonance imaging (MRI). Specifically, functional connectivity MRI (fcMRI) can extract functional networks of the brain at rest, while structural connectivity can be estimated from white matterfiber orientations measured with high angular-resolution diffusion imaging (HARDI). A model that marries these two techniques may be the key to understanding functional recovery after stroke. In this study, a novel set of voxel-level measures of structurofunctional correlations (SFC) was developed and tested in a group of chronic stroke subjects.
Methods:A fully automated method is presented for modeling the structure-function relationship of brain connectivity in individuals with stroke. Brains from ten chronic stroke subjects and nine age-matched controls were imaged with a structural T1-weighted scan, resting-state fMRI, and HARDI. Each subject's T1-weighted image was nonlinearly registered to a T1-weighted 152-brain MNI template using a local histogram-matching technique that alleviates distortions caused by brain lesions. Fractional anisotropy maps and mean BOLD images of each subject were separately registered to the individual's T1-weighted image using affine transformations. White matterfiber orientations within each voxel were estimated with the q-ball model, which approximates the orientation distribution function (ODF) from the diffusion-weighted measurements. Deterministic q-ball trac-tography was performed in order to obtain a set offiber trajectories. The new structurofunctional correlation method assigns each voxel a new BOLD time course based on a summation of its structural connections with a commonfiber length interval. Then, the voxel's original time-course was correlated with this fiber-distance BOLD signal to derive a novel structurofunctional correlation coefficient. These steps were repeated for eight
fiber distance intervals, and the maximum of these correlations was used to define an intrinsic structurofunc-tional correlation (iSFC) index. A network-based SFC map (nSFC) was also developed in order to enhance resting-state functional networks derived from conventional functional connectivity analyses. iSFC and nSFC maps were individually compared between stroke subjects and controls using a voxel-based two-tailed Student's t-test (alpha = 0.01). A linear regression was also performed between the SFC metrics and the Box and Blocks Score, a clinical measure of arm motor function.
Results:Significant decreases (p < 0.01) in iSFC were found in stroke subjects within functional hubs of the brain, including the precuneus, prefrontal cortex, posterior parietal cortex, and cingulate gyrus. Many of these differences were significantly correlated with the Box and Blocks Score. The nSFC maps of prefrontal networks in control subjects revealed localized increases within the cerebellum, and these enhancements were diminished in stroke subjects. Thisfinding was further supported by a reduction in functional connectivity between the pre-frontal cortex and cerebellum. Default-mode network nSFC maps were higher in the contralesional hemisphere of lower-functioning stroke subjects.
Conclusion:The results demonstrate that changes after a stroke in both intrinsic and network-based structur-ofunctional correlations at rest are correlated with motor function, underscoring the importance of residual structural connectivity in cortical networks.
http://dx.doi.org/10.1016/j.nicl.2017.07.002
Received 30 January 2017; Received in revised form 12 June 2017; Accepted 3 July 2017
⁎Corresponding author at: Department of Biomedical Engineering, Marquette University, PO Box 1881, Milwaukee, WI 53201-1881, USA.
1Currently: Department of Physical Therapy, Concordia University of Wisconsin, Mequon, WI, USA. E-mail address:[email protected](B.D. Schmit).
Available online 29 July 2017
2213-1582/ © 2017 The Authors. Published by Elsevier Inc. This is an open access article under the CC BY-NC-ND license (http://creativecommons.org/licenses/BY-NC-ND/4.0/).
1. Introduction
Resting-state functional magnetic resonance imaging and diffusion MRI together provide unprecedented insight into the structure-function relationships associated with changes in brain connectivity after stroke. This information might be useful for prognosis after stroke and could help to personalize rehabilitation strategies for individual patients. Consequently, the purpose of this study was 1) to develop a novel connectivity model that marries structural and functional connectivity analyses, and 2) to demonstrate that this new technique provides un-ique information about subject-specific changes in brain connectivity that may be used to develop new imaging biomarkers for functional recovery.
Diffusion magnetic resonance imaging has provided potentially useful tools for detecting changes in white matter structure and struc-tural connectivity following stroke. One such tool, high angular-re-solution diffusion imaging (HARDI) (Tuch et al., 2002) measures the diffusion coefficient within each voxel for many directions. From these directional data, an orientation distribution function (ODF) of white matterfibers within a voxel can be estimated with techniques such as q-ball imaging (Tuch, 2004). Diffusion MRI tractography uses these di-rectional diffusivity measurements to model white matter fiber path-ways. Deterministic tractography approaches propagate modeledfibers along the principle direction of diffusion (Zhang et al., 2009), while probabilistic approaches add random perturbations to estimate a dis-tribution of structural connections to a voxel (Behrens et al., 2007, 2003). Measures of structural connectivity of the brain can then be calculated based on these tractography models, and applied to the brain of stroke subjects. Structural connectivity analyses automatically locate changes infiber pathways after stroke (Yeh et al., 2013), and retained connectivity is associated with higher motor function (Buch et al., 2012; Crofts et al., 2011; Koch et al., 2016).
Resting-state functional magnetic resonance imaging (rs-fMRI) can be used to measure low-frequency oscillations in cortical signals that are associated with functional connectivity of the brain (Biswal et al., 1995; Fox, 2010). In this approach, measurements are made while the subject lies in a scanner with their eyes closed, making it attractive for clinical use. The rs-fMRI data are often analyzed using an independent components analysis (ICA) to automatically extract sets, or networks, of voxels that follow a common pattern of signal change (Beckmann and Smith, 2004; Beckmann and Filippini, 2009; Du and Fan, 2013; Park et al., 2014; Rytty et al., 2013). Each independent component includes a spatial volume of voxel contributions and a common signal time-course. When applied to stroke, rs-fMRI connectivity analysis has pro-vided evidence of cortical reorganization associated with motor re-covery (Chen and Schlaug, 2016; van Meer et al., 2010; Wang et al., 2010), with the most common finding of reduced interhemispheric functional connectivity between sensorimotor cortices (Carter et al., 2010; Rehme and Grefkes, 2013; Tang et al., 2016; Urbin et al., 2014). These studies are promising; rs-fMRI might have clinical use in pre-dicting outcomes and developing therapeutic interventions based on monitoring of cortical reorganization (Carter et al., 2012; Ovadia-Caro et al., 2014).
Multimodal MRI techniques that combine diffusion and functional MRI approaches provide the opportunity to relate brain tract structure to functional networks (Honey et al., 2010). In healthy individuals, there is a strong correspondence between the default-mode network, a distinct brain network that demonstrates strong functional connectivity at rest, and the density of anatomical connections between its nodes (Hagmann et al., 2008). This same concept that anatomical connec-tions, measured using diffusion imaging, underlie functional con-nectivity extends throughout the brain (Honey et al., 2009). An im-portant factor in this relationship between anatomical connections and functional connectivity is distance between nodes of interest. Specifi -cally, an inverse relationship has been observed between node distance and functional connectivity (Sporns, 2011).
The objective of the current study was to combine diffusion MRI and rs-MRI information into a single analysis of structurofunctional con-nectivity. A number of previous studies assessing both structural and functional connectivity have compared structural and functional con-nectivity matrices obtained separately from diffusion MRI and fMRI respectively (Damoiseaux and Greicius, 2009). More recently, a com-bined structural-functional connectome (Horn et al., 2014) has been described using correlations between the structural and functional connections of all voxels of the brain. An important observation from these studies is that functional connectivity is observed between regions that are not connected by major white matter tracts.Fjell et al. (2017) explored this concept in detail, calculating functional connectivity of brain regions with and without direct structural connections, noting that changes in functional connectivity are not strongly correlated with changes in direct structural connections with aging (Fjell et al., 2017). Thus, accounting for indirect structural connections could be an im-portant factor in determining brain function, especially after an injury (Kalinosky et al., 2013). In general, combining structural and functional connectivity information might be particularly useful in describing changes in functional connectivity following localized brain lesions of structural networks, such as those associated with stroke (Rehme and Grefkes, 2013). Here we describe a new automated analysis that ex-presses functional connectivity in the context of structural connectivity while avoiding constraints on either individual analysis. Our approach first calculates the functional connectivity for all structurally connected voxels of the brain. We then identify average levels of functional con-nectivity to a voxel for regions that are structurally connected at similar distances. A novel structurofunctional correlation (SFC) that identifies maximum functional connectivity to a voxel across these distances can then be obtained. This technique produced a voxel-level intrinsic metric (iSFC) and an enhanced resting state network (RSN) map (nSFC). We tested this approach in ten stroke subjects and nine age-matched con-trols to validate the structurofunctional connectivity measures through correlation with clinical assessment of arm motor function.
2. Methods
2.1. Data collection
2.1.1. Subject recruitment and functional testing
Ten individuals with chronic post-stroke hemiparesis (4 female, age 66.7 ± 7.94 years, at least 1.1 years since stroke), and nine age-mat-ched control subjects (5 female, age 64.2 ± 7.73 years) participated in this study. The experimental protocol was approved by the Institutional Review Boards of Marquette University and the Medical College of Wisconsin, and written consent was obtained from each subject. Inclusion criteria included a history of stroke that occurred no < 6 months prior to recruitment. Stroke subject information is provided in Table 1. Subjects with no ability to perform supination, pronation, ulnar deviation, or radial deviation of the wrist were excluded. Note that exact dates of the stroke, treatment history, or any other medical records were not collected. Control subjects were comprised of in-dividuals without history of stroke or other neurological impairments that were age-matched (within 3 years) and gendered-matched to the stroke subjects.
A certified physical therapist evaluated each stroke subject with three clinical tests of motor function, including the upper extremity (UE) portion of the Fugl-Meyer Assessment (Fugl-Meyer et al., 1975), the Box and Blocks Test of Manual Dexterity (Mathiowetz et al., 1985) and the Wolf Motor Function Test (Wolf et al., 2001) for upper ex-tremity motor ability. In the Box and Blocks Test, a top-open plywood box is divided into two square compartments by a partition 15.2 cm in height. While sitting in front of the box, the subject uses one hand to move as many wooden blocks as possible from one square compartment to the other in 60 s. Every stroke subject repeated the test twice with each hand, and the # of blocks was used as the score. In right-handed
healthy adults of ages 20–75, Box and Blocks performance is 76.8 ± 11.5 blocks in 60 s (Mathiowetz et al., 1985). The Fugl-Meyer Assessment quantifies impairment in motor function, sensation, and balance in stroke patients with hemiplegia, and the upper extremity score ranges from 0 to 126. Lower scores signify greater level of im-pairment. The Wolf Motor Function Test (WMFT) uses time-based tasks to evaluate upper extremity movement. Some of these tasks include lifting a can or pencil, moving hand or forearms onto the table, stacking checkers, and folding a towel (Wolf et al., 2008). Wolf motor scores range from 0 to 76, with a higher score indicating greater function. 2.2. MRI scans
Every subject was screened for MRI safety according to the Medical College of Wisconsin Institutional Review Board before entering the magnetic environment. An axial T1-weighted anatomical image was acquired using a fast spoiled gradient recalled (SPGR) pulse sequence, with TE: 3.2 ms, TR: 8.16 ms, flip angle: 12°, prep time: 450, band-width: 22.73, FOV: 240 mm, 156 1 mm slices, and matrix size: 256 × 240. Next, an axial q-ball high angular resolution diffusion imaging (HARDI) sequence was acquired with a single-shot echo planar imaging sequence, including 5 b = 0 images, 150 diffusion-weighted directions, SENSE parallel imaging, TE: 72.3 ms, TR: 5700 ms, FOV: 250 mm, matrix size: 128 × 128 resampled to a 256 × 256 grid (2 mm pixel width/height), and 57 2.5 mm slices. The 2.5 mm slice thickness was needed for cerebellum coverage in subjects with larger heads. For functional MRI, an axial view gradient-echo echo-planar sequence was acquired with TE: 25 ms, TR: 2000 ms, flip angle: 77°, FOV: 240 mm × 240 mm, 41 slices with 3.5 mm thickness. Subjects were instructed to stay awake with the eyes closed for the 6-min resting-state fMRI scan, during which 180 frames were acquired in 2 s intervals. Supplementary Fig. S1 shows an axial slice from the T1-weighted image of each stroke subject that includes the lesion location. 2.3. MRI data processing
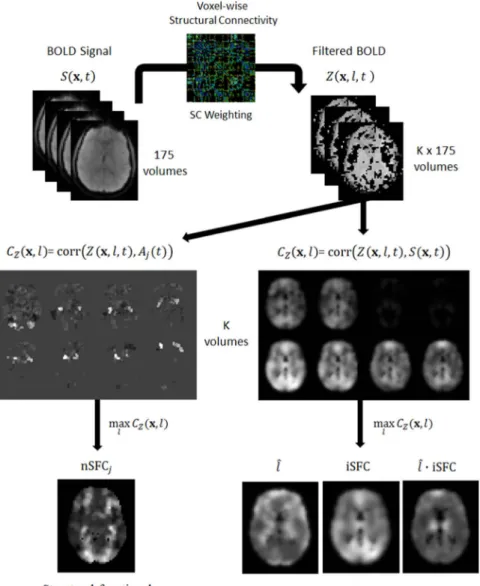
A summary of the MRI processing pipeline is shown inFig. 1and Table S1. Briefly, the MELODIC tool was used to decompose the fMRI BOLD signal, S(x,t) into 83 independent components, each with a spatial map,Mj(x,t) and time-courseAj(t). Diffusion MRI data werefit
to a q-ballfiber orientation model, and tractography was performed in native subject space to reconstructfiber pathways. Each subject's ana-tomical T1-weighted image was spatially normalized to MNI space, and affine registration was performed in native subject spaces to align anatomical images with diffusion and mean BOLD images. Fiber tra-jectories were transformed into MNI space, and afiber-distance aver-aged BOLD signal, Z(x,t), was calculated for each voxel. Intrinsic
structurofunctional correlation (iSFC) was calculated as the maximum temporal correlation ofZ(x,t) with voxel BOLD signals. The iSFC can have values between 0 and 1. High iSFCmaxindicates that for somefiber
length,l, a strong correlation in BOLD̂ fluctuations exists between a voxel and the ensemble of its structurally connected voxels at that distance. On the other hand, a low iSFCmaxnear zero occurs only if a
voxel is uncorrelated with its anatomical connections at all fiber lengths. In this case, the voxel's direct structural connections do not account for the variability in its BOLD signal. Enhanced resting-state network maps (nSFCj) were derived by maximizing correlations ofZ
(x,t) with independent component time-courses Aj(t). Again, values
ranged from 0 to 1, with higher values indicating an enhanced con-nectivity to the standard network. A more detailed description of each step in the data processing follows.
2.4. Image registration and lesion-side normalization
Fully automated techniques were used for intersubject and inter-modality image registration. MRI data were also corrected to place le-sions on the left side of the brain. Lesion-side normalization was per-formed prior to registration by flipping each row of data in the x-dimension in stroke subjects with right lesions. Anatomical T1-weighted images were registered to the 152-MNI template from fMRI of the Brain Software Library (FSL). First, the FLIRT tool from FSL (Jenkinson and Smith, 2001) was used to perform linear affine regis-tration to translate and rotate the brain. The anatomical images were then deformed to MNI space using an ITK implementation of the Maxwell's demons algorithm (Thirion, 1998).
Each subject's anatomical image was registered to native diffusion MRI and fMRI spaces. Fractional anisotropy (FA) was calculated from the diffusion coefficients (Basser et al., 1994), and the FA map was flipped and registered to the subject'sflipped T1-weighted image using a 12-parameter affine registration. The fMRI data were similarly flipped, and the mean BOLD image was registered to the anatomical image. Registration transforms were concatenated in order to map each subject's BOLD and diffusion images to MNI coordinates. Following tractography described in subsequent sections,fiber trajectories were similarly warped into MNI space. In subjects with right-side lesions, fibers werefirstflipped over the mid-sagittal plane.
2.5. Resting-state network calculation
Resting-state networks (RSNs) were determined from raw BOLD time-course data using the Multivariate Exploratory Linear Decomposition into Independent Components (MELODIC) Version 3.14 available with the FSL (www.fmrib.ox.ac.uk/fsl). All 19 subjects were time concatenated for a single group ICA. The data were high-passfi l-tered with a cutoffof 100 s (Marchini and Ripley, 2000). Before time-concatenation,five TRs were discarded from each subject, leaving 175 volumes over 350 s. The functional image volumes were motion cor-rected using the MCFLIRT implementation (Jenkinson et al., 2002). Slice-time correction was applied using linear interpolation. Skull-stripping was automatically performed with the brain extraction tool (BET) (Smith, 2002), and the data were spatially smoothed with a 4 mm full-width half-max Gaussian kernel. The brain mask was used to ex-clude non-brain voxels from the remaining analyses. All subjects were spatially normalized to an anatomical MNI standard template using a 12-parameter affine registration implemented in FLIRT (Jenkinson and Smith, 2001). The voxel BOLD times series were demeaned, variance normalized, and whitened.
The number of independent components was estimated using a Bayesian approach described in (Minka, 2000). Using Probabilistic In-dependent Component Analysis (Beckmann and Smith, 2004), the whitened time data were projected onto a 83-dimension subspace. A fixed-point method (Hyvarinen, 1999) decomposed the data into 83 Table 1
Stroke subject information.
Subject ID S04 S05 S07 S08 S10 S12 S14 S15 S16 S18
Sex M M F M M F M F F M
Age 65 57 83 66 69 65 64 80 62 66 Lesion
location
Cort Subc BS Subc Cort Cort Cbl Subc Subc Subc
Lesion side R L L L L R L L L L
Arm affected L R R R R L L R R R Dominant
post
R R L R R R R R R R
Dominant pre L R R R R Amb R R R R Wolf motor 71 72 38 72 75 54 58 74 75 74 Fugl-meyer 124 106 82 122 124 97 120 126 124 122 Box & Blocks
(ND)
24.5 62.5 8 41 75.5 14.5 13 57 50 64
Cort = Cortical, Subc = Subcortical, BS = Brainstem, Cbl = Cerebellum, Amb = Ambidextrous, R = Right, L = Left.
independent components that accounted for variability in temporal, spatial, and subject domains. The spatial components were normalized by the variance of the residuals (Beckmann and Smith, 2004).
The ICA method decomposes the BOLD dataS(x,t) as a function of voxelxand timetinto spatiotemporal vectors with independent spatial maps and time-courses. The jth network has a spatial map,Mj(x), and time-course,Aj(t). As described by Joel et al. (Joel et al., 2011), these independent components are related to the original BOLD signal as
∑
= = t S( , )x M( )xA t( ) j J j j 1 (1)Once the group independent components were calculated, a dual regression (Beckmann and Filippini, 2009) was used to estimate sub-ject-specific spatial maps and time courses. Components with vertical stripes in the axial view were associated with motion and excluded from further analysis. 45 of the 83 components were excluded due to high amounts of frequency content above 0.1 Hz or were determined to be related to anatomical artifacts. The MELODIC tool was used to regress these components out of each subject's original fMRI data.
2.6. Structural connectivity analysis
The high-angular resolution diffusion-weighted images were pro-cessed with the Diffusion Toolkit to estimate thefiber orientation and
reconstructfiber tracts (Wang et al., 2007). At each voxel, q-ball re-construction was performed with 181 rere-construction points and 150 measurement points. Since access to thefiber trajectories was required for our model, the deterministic tractography module was used from the Diffusion Toolkit. Diffusion MRI tractography was performed in the subject's native space. Stopping criteria included an angle threshold of 35°. At each voxel, 30 seeds were randomly distributed andfiber tra-jectories were reconstructed. This path was lesion-side corrected and warped into MNI space using a concatenation of the subject's inter-modality registration and anatomical intersubject registration. These fibers were stored for later data analyses.
2.7. Structurofunctional correlation
In this study, we were interested in the level of functional con-nectivity to the ensemble of structural connections at different fiber distances from a voxel. Every fiber endpoint voxel was treated as a potential network node. All processing that combines structural and functional connectivity was performed in MNI space. Thus, both BOLD data and fiber trajectories were both spatially normalized using the anatomical image registration. Note that voxels were not excluded based on apriori knowledge of lesion location. By including onlyfiber endpoints, gray matter voxels with direct damage or lost structural connections due to a lesion are inherently excluded from the calculation of metrics defined below.
Fig. 1.Pipeline overview for calculating struturofunctional cor-relation (SFC) metrics. The cleaned BOLD signalS(x,t) from the MELODIC analysis was processed withfiber-based averaging to compute signalZ(x,t,l). Next,Z(x,t,l) was correlated with each voxel's original BOLD signal and the time-course of each resting-state network, giving two CZcorrelations. The CZcorrelations
were maximized byfiber-length to derive the intrinsic (iSFC) and network-based (nSFC) metrics.
Rather than analyzing the functional connectivity of a voxel to every structurally connected location, signal averaging was first per-formed across connections of a similarfiber path distance. Note that this model makes an assumption that functionally connected nodes in a network can be both distinguished and grouped byfiber distance in a meaningful way. Also note that since averaging was performed with fiber lengthfixed, metrics within this framework may be less affected by dependence of functional connectivity onfiber distance as reported in (Sporns, 2011).
To calculate structurofunctional correlation,first considerV(x,l) as a map that provides a set ofNvoxel locations, {y1,y2,…,yN}, that are
structurally connected to voxelxbyfibers with lengthl. AlthoughN will vary withx, we write it as a constant in subsequent equations for simplicity. LetS(x,t) be the BOLD signal at timetand physical location x, withx∈ℝ3. Spatial averaging ofSacross all voxels included inVgives a new weighted time signal,Z(x,l,t). This structurally connected mean BOLD signal is defined as
∑
= − ∈ = Z( , , )xl t N i S( , ) :yit yi V( , )x l N 1 1 (2)Thefiber-length BOLD correlation,CZ, of a voxelxand an arbi-trary functionf(t) at lengthlis
=
CZ( , , ( ))x l f t Corr( ( , , ), ( ))Z x l t f t (3)
Maximizing CZ with respect to fiber length gives the structur-ofunctional correlation (SFC), which represents the greatestfi xed-length correlation off(t) with the structurally connected voxels tox. Here, we denotel̂as thefiber length that maximizesCZ, given as
̂ = x l( , ( ))xf t arg max C ( , , ( ))l f t l Z (4) Furthermore, the SFC is = x f t max C l f t x SFC( , ( )) ( , , ( )) l Z (5)
2.8. Intrinsic and network-based SFC metrics
The first metric introduced is intrinsic structural-functional con-nectivity (iSFC), which is defined as the maximum temporal correlation between a voxel's BOLD signal with the fiber-length averaged BOLD signal of its structural connections. In the case thatf(t) in Eq.(5)is the original fMRI signal atx, then SFC provides the functional connectivity of voxelxto its own structural connections. The intrinsic structur-ofunctional correlation (iSFC)is defined as
= S
x x x
iSFC( ) SFC( , ( , t)) (6)
As a correlative measure, iSFC can have values between−1 and 1. High iSFC indicates that for somefiber length,l,̂a strong correlation in BOLD fluctuations exists between a voxel and the ensemble of its structurally connected voxels at that distance. On the other hand, an iSFC with absolute value near zero occurs only if a voxel is not corre-lated with its anatomical connections at anyfiber length. In this case, the voxel's direct structural connections do not account for the varia-bility in its BOLD signal. There are multiple potential causes for this scenario. First, resting-state activity may be influenced by indirect connections via multiple neuron pathways. Additionally, a voxel may have a similar number inhibitory and excitatory functional connections at afixedfiber length.
Functionf(t) can also be selected as the time-course signalAj(t) of the jth network from the independent component analysis. Effectively, SFC is then the maximum BOLD correlation ofx’s structural connec-tions with the network time-course. We define the network-based structurofunctional correlation (nSFC)as
= A t
x x
nSFC ( )j SFC( , j( )) (7)
In exampleFig. 2a, the iSFC is shown for multiple voxels within the
brain. Voxelx1is connected to cortical voxelsx2andx3byfibers with
lengthl2. Thefiber-length BOLD correlationCZ(x1,l2) of function f(t)
=S(x1, t) is its correlation with mean BOLD signal (S(x2, t) +S(x3, t))/2,
shown to be 0.6. Likewise, atfiber lengthl1,x1is structurally connected
to brainstem voxelx0. Then,CZ(x1,l1) is the correlation ofS(x1, t) withS
(x0, t), given as 0.4. The iSFC(x1) is the maximum of these two
corre-lations, being 0.6. Similarly, sincex3andx4are exclusively connected
byfibers with lengthl3, thenCZ(x3,l3) andCZ(x4,l3) are both equal to
the functional connectivity betweenx3andx4, being near 0.8 as
in-dicated by the redfibers andfill color.
Fig. 2b demonstrates the network-based SFC (nSFC) for the right sensorimotor network. Voxels within the red-filled regions in the right sensorimotor cortex and left cerebellum have BOLD signals that are highly correlated with the sensorimotor network time-course A(t). These regions are nodes within the sensorimotor network or its inter-network functional connections. Since voxelsx0,x1, andx4have direct
structural connections to the RSN nodes, they will have increased nSFCj, even though some may not be originally a member of the
sen-sorimotor network. Thus, nSFC enhances voxels that have direct structural connections to the nodes of a resting-state functional net-work.
2.9. Implementation of iSFC
The signalZ(x,l,t) was calculated independently using Eq.(2)for each time frame,t, andfiber length interval,lk. The full range offiber lengths was chosen such that the longest projectionfibers in the control group would fall within the highest bin. Shown in Fig. S2, the dis-tribution of geodesicfiber length was calculated in every subject from reconstructed fiber pathways from diffusion MRI tractography. The maximumfiber lengths originating from the cortex across all control subjects was near 22 cm. Thus, six intervals were centered between 2, 4, 7, 10, 13, 16, 19, and 22 cm. A 4-D dataset with the same dimensions as the original fMRI data was created to store thefiltered data for each fiber length interval. The BOLD signal S(x,t) was estimated for each gray matterfiber endpoint. Specifically, the signal at the endpoint of each tract was defined as the mean of the BOLD signals across the three endmost points of thefiber. Values at each of these threefiber points were extracted from the original fMRI signal by trilinear interpolation within MNI space. At each voxel,x, thefiber-length BOLD signal Z (x,l,t) was calculated by averagingS(x,t) of all structurally connected voxels. Z(x,l,t) was calculated for fibers within the every specified length intervall.
According to Eqs.(3), each voxel's intrinsicfiber-based correlation CZ(x,l,S(x,t)) was calculated for every fiber length interval l. Next, using Eq.(4), thefiber length,l, maximizing Ĉ Zwas determined. Fol-lowing Eqs.(5) and (6), the iSFC at each voxel was calculated as the
̂
l S t
x x
C ( , , ( , ))Z .
2.10. Calculation of structurofunctional RSN maps
Resting-state networks that were analyzed in this study included the posterior default-mode network (DMN), the prefrontal network (ante-rior DMN), the primary visual network, the ipsilesional and contrale-sional sensorimotor networks, the bilateral cerebellar network, and the basal ganglia network. These networks were identified from the in-dependent components from the MELODIC analysis.
In order to validate the level of network map enhancement, the nSFC was compared to the correlation coefficient between BOLD signal S(x,t) and each independent component time courseAj(t). Note that the independent component spatial maps,Mj(x), in Eq.(6)are not corre-lation coefficients. The correlation of the network's timecourse with the original BOLD signal provided a network map with the greatest weight given to the jth network. We denote this baseline correlation as RSNj. Based on in Eq. (7) we then use a similar notation to define the
enhanced correlation as nSFCj. The difference between the Fisher-transformed nSFCjand RSNjwas then used as a measure of network enhancement. The original and enhanced correlation maps were vi-sualized for comparison using 3D isosurfaces at multiple isovalues. 2.11. Statistical analysis of SFC metrics
Voxel-based based analysis was used to measure differences infive metrics between stroke subjects and age-matched controls. Motion parameters were used as covariates when calculating all metrics. First, intrinsic measures iSFC, l, and their product were calculated in all̂ subjects. Next, the conventional RSN map, RSNj, and the SFC-enhanced map, nSFCj, were calculated for seven networks of interest. These in-cluded the primary visual, the default-mode, left and right sensor-imotor, prefrontal, cerebellar, and basal ganglia networks. The Fischer transform was used to normalize nSFCjand RSNjfor statistical testing. Stroke and control groups were compared by merging the groups to-gether and computing Box and Blocks contrast maps for each metric. Box and Blocks scores were generated for control subjects by using population statistics based on age in healthy subjects (Mathiowetz and Weber, 1985). An F-test with ∝= 0.001 was used to calculate the significance of the regression slope of each contrast. In order to correct thep-values for multiple comparisons, the 3dclustsim tool in AFNI was used to determine a minimum cutoffcluster volume of 700 mm3,
cor-responding to a correctedp-value of 0.05. From these correlation-based clusters, the mean metric value was calculated for each subject. Posthoc Student'st-tests (∝= 0.05) were performed on cluster means between stroke and control groups. A linear regression between cluster mean and Box and Blocks was performed with stroke patients only. Cluster-based post-hoc tests were further corrected for multiple cluster com-parisons using false discovery rate (q < 0.05).
3. Results
3.1. Control iSFC maps and group differences
Intrinsic structurofunctional connectivity was characterized in each brain using iSFC,l, and the product of these two metrics, iSFĈ ∙l, from̂ Eqs.(4)–(6). The greatest iSFC was observed in the posterior parietal and sensorimotor regions of the brain. Shown by isosurfaces of the iSFC metric inFig. 3(top left), the voxels with greatest iSFC were located
within the precuneus, anterior cingulate gyrus, and sensorimotor cortex. In turn, voxels having the greatestfiber length that maximizes functional connectivity (l) were within the prefrontal, posterior par-̂ ietal cortex, and cerebellum regions (top center images inFig. 3). The product of iSFC and ∙l, which gives greater structurofunctional̂ weighting to long connections, demonstrated greatest values in the prefrontal and parietal portions of the cingulate gyrus. These three structurofunctional metrics were next compared between stroke and control groups.
There were multiple brain areas in stroke subjects with significantly lower intrinsic structurofunctional connectivity (P< 0.01) compared to controls. Specifically, there were three main regions of the brain that demonstrated significant decreases in iSFC (P< 0.01; t values cor-rected for multiple comparisons based on cluster size) in stroke com-pared to control brains. These regions included the right lateral cere-bellum, the midbrain, and thalamus. Conversely, there were increases in iSFC within the left dorsolateral prefrontal cortex (Fig. 3, left col-umns). Stroke subjects also had significant differences in thefiber dis-tance,l, associated with maximum intrinsic functional connectivity tô a voxel. Stroke subjects had lowerl̂within the superior parietal lobule and precuneus, whilel̂was greater in stroke subjects within the tha-lamus, contralesional inferior temporal gyrus, and ipsilesional inferior prefrontal cortex. (Fig. 3, middle columns). The product of the max-imum functional connectivity and the fiber distance associated with that connectivity was significantly lower (P< 0.01) within the su-perior parietal lobule, the supplementary motor area, the medial pre-frontal cortex, the posterior portion of the inferior temporal gyrus, and the contralesional inferior frontal gyrus (Fig. 3, right column).
Voxel-wise linear regression was performed between each metric and Box and Blocks score to locate regions associated with upper ex-tremity function (Fig. 4andTable 2). An F-test was used to calculate a P-value at each voxel, and clusters of significant voxels (P< 0.01) are reported. The mean metric value of each cluster was compared between stroke and controls with a Student'st-test, and linearly regressed with Box and Blocks score. These clusters for iSFC,l, and their product arê listed inTable 2. For each stroke subject, a Box and Blocks z-score was calculated based on age-specific normative data in healthy individuals (Mathiowetz et al., 1985). Six subjects with z <−3 were classified as lower functioning. These subjects are shown inFig. 4with red-colored data points, whereas the other stroke subjects are encoded in black. One main spatial cluster in the right cerebellum had a mean iSFC that was Fig. 2.iSFC and nSFC Example. Diagram depicting the intrinsic (a) and network-based (b) structural-functional correlation (SFC). The SFC provides a maximum tem-poral correlation, CZ, of a function f(t) to
the structural connections of each voxelxi.
a) Letting f(t) be the original BOLD signal ofxi, SFC becomes a voxel-based intrinsic
connectivity measure (iSFC). b) On the other hand, SFC represents an enhanced resting-state network if f(t) is the time-course of an RSN. Shown here is the left sensorimotor RSN with redfilled regions correlated withAj(t) in the right
sensor-imotor cortex and left cerebellum. Voxels
x1andx4have high nSFC since they are structurally connected to regions with BOLD signals correlated withAj(t).
correlated with the Box and Blocks Score (Fig. 4a). The left portion of Fig. 4a shows the location of the cluster, color coded with theP-value for significance of the correlation. The cerebellum iSFC was correlated with Box and Blocks score (P< 0.01), and the cluster mean was sig-nificantly different between the stroke group and controls (P= 0.027). The low functioning (red markers in scatter plots) did have a sig-nificantly different iSFC within this cluster (P< 0.001). Spatial con-trasts in iSFC with Wolf Motor and Fugl-Meyer Assessment scores were similar to the Box and Blocks contrasts, as shown in supplementary Fig. S3. However, p-values did not survive multiple comparisons correc-tions. We believe this was largely due to a ceiling effect on the Fugl-Meyer and Wolf Motor scores, with over half of the stroke subjects achieving near perfect scores.
Maximum correlation fiber-length l, shown in̂ Fig. 4, there were clusters with both positive and negative significant correlations with Box and Blocks score. Positively correlated clusters were located within the inferior temporal gyrus, cingulate gyrus, and superior frontal gyrus. Clusters with a negative correlation between mean l̂ and Box and Blocks score were in the left middle temporal gyrus, thalamus, and midbrain. Across all stroke subjects, the mean l̂was significantly dif-ferent in clusters that were correlated with Box and Blocks score (P< 0.01). The lower functioning subjects were significantly different from controls within these same clusters. Two clusters with significant positive correlations between Box and Blocks and the mean product of the iSFC and l̂ were located within the medial prefrontal cortex (P< 0.01). Furthermore, the cluster means were also significantly lower in stroke subjects (P < 0.01).
3.2. Stroke-related differences infiber-length averaged BOLD correlations Voxel-wise differences in CZbetween stroke subjects and
age-mat-ched controls reveal that intrinsic structurofunctional correlations can be delineated at specificfiber lengths. As shown in Fig. 5 for fiber distance between 40 and 70 mm (l =1), the precentral gyrus had an increased functional connectivity (P< 0.001) with its structural
neighbors for stroke subjects. Likewise, stroke subjects had lower functional connectivity (P< 0.001), correlated with Box and Blocks (R2= 0.58), between the contralesional lateral orbitofrontal cortex and
its neighbors at a 70–100 mm (l =2)fiber length.
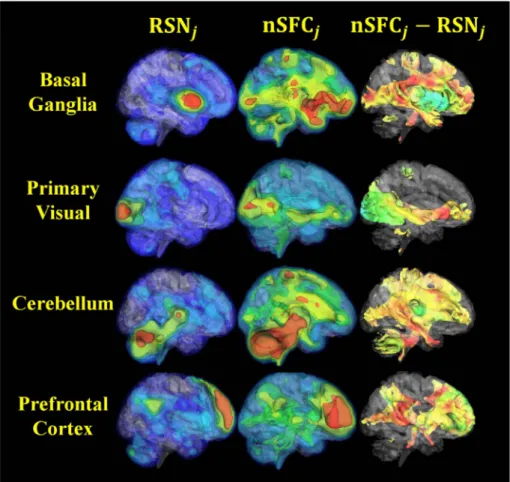
3.3. Behavioral correlations of enhanced resting-state network spatial maps The network-based structurofunctional correlation (nSFC) maps showed structural connections between conventional functional net-works and the rest of the brain. Four examples of this analysis for controls are shown inFig. 6, with the left column showing the resting state network (RSN), the middle column showing the nSFC, and the right column showing the difference. The basal ganglia network nSFC was greatest in the amygdala, precentral gyrus, and frontal areas. Si-milarly, the primary visual network was enhanced by nSFC along the pathway from V1, to the thalamus, andfinally the orbitofrontal gyrus. The prefrontal network nSFC enhanced the precuneus, the cerebellum, and brainstem areas. An independent component that was localized to the cerebellum demonstrated structurofunctional connectivity throughout the brain at projection fiber endpoints. In general, nSFC demonstrated expected structurofunctional connectivity to the resting state network. Because this analysis expands the networks, we refer the nSFC maps as the SFC-enhanced networks.
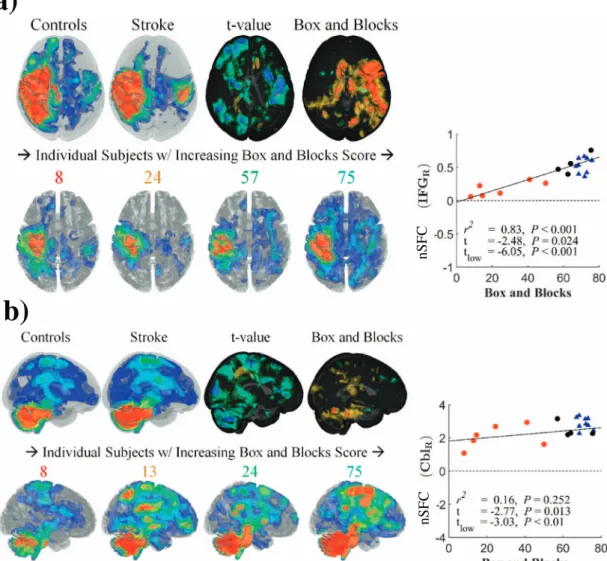
3.4. Reduced nSFC in motor networks correlated with impairment Group differences in the SFC-enhanced (nSFC) ipsilesional sensor-imotor network are shown inFig. 7a. In control subjects, the enhanced network was spatially distributed in the left sensorimotor cortex and structurally connected regions. These regions included the prefrontal and posterior parietal areas of the left hemisphere and regions in the right hemisphere connected by commissuralfibers (Fig. 7a, upper left). In stroke subjects, the nSFC in the contralesional superior temporal gyrus and inferior frontal gyrus was lower in subjects with greater impairments and was correlated with Box and Blocks score (R2= 0.9, Fig. 3.Intrinsic structurofunctional correlation (iSFC) in stroke and controls. On the left, group differences in the structurofunctional correlation metric (iSFC) indicative of a voxel's maximum functional connectivity to structurally connected neighbors at afixedfiber distance are shown. Isosurfaces of distance associated with the maximum correlation (l)̂are shown in the center column. On the right, the iSFCl̂product displays the group averages and differences for the product of thefirst two metrics. The bottom row shows clusters of significantly different voxels (P< 0.01) with a minimum cluster size of 700mm3. Blue clusters indicate significant decreases in stroke, compared to controls. Red clusters indicate significant
t=−4.48) (Fig. 7a, right). This effect was observed across stroke subjects, with higher functioning subjects presenting with greater ex-tent of enhanced sensorimotor networks (Fig. 7a, lower row). Although nSFC was similar for stroke and control subjects within the ipsilesional hemisphere, higher functioning stroke individuals had a greater level of contralesional enhancement.
Shown inFig. 7b andTable 3, the enhanced cerebellar network in control subjects had structurofunctional correlations in frontal and parietal cortical areas, the bilateral cerebellum, brainstem, and tha-lamus. In this enhanced network, nSFC was reduced in the right cere-bellum of stroke subjects, and these differences were larger in subjects with greater impairment (R2= 0.72,t=−3.8) (Fig. 7b, right). Similar
to the sensorimotor network, the enhanced cerebellar network showed greater extent in higher functioning stroke subjects (Fig. 7b, lower row).
3.5. Stroke-related nSFC increases in contralesional hemisphere
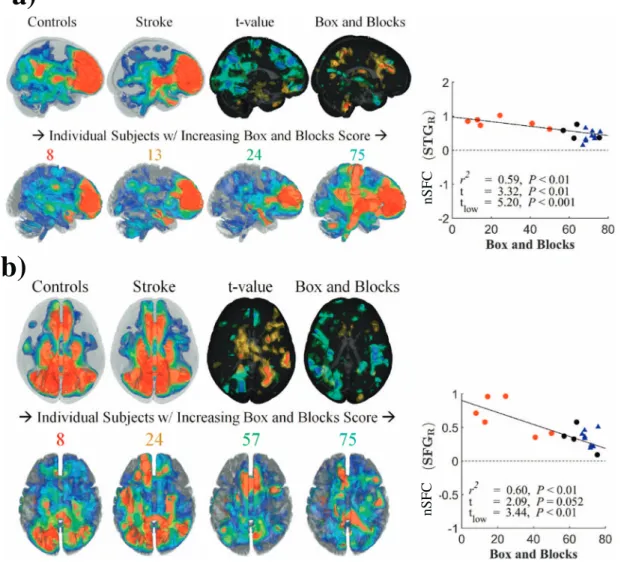
Group differences in the enhanced prefrontal network, shown in Fig. 8a andTable 3, had mixed correlations with Box and Blocks scores. The control group had greatest nSFC within the prefrontal cortex and precuneus (Fig. 8a, upper left), while nSFC in stroke subjects was
highest in the prefrontal cortex and contralesional superior temporal gyrus (Fig. 8a, upper middle). The nSFC within the prefrontal resting-state network was correlated with Box and Blocks score in the pre-cuneus (R2= 0.72), although the stroke group was not significantly different from controls (t=−0.20). However, nSFC was greater in the contralesional superior temporal gyrus and inferior frontal gyrus (t= 2.8) and was correlated with Box and Blocks score (R2= 0.58) (Fig. 8a, right). In contrast, the prefrontal network in the low-func-tioning stroke subjects had lower nSFC in the ipsilesional middle tem-poral gyrus (R2= 0.61,t=−2.76).
Structurofunctional correlations of the posterior default-mode net-work, which was distributed in the amygdala, anterior cingulate, pre-cuneus, and posterior parietal cortex (Fig. 8b), generally had negative correlations with the Box and Blocks scores. The DMN had increased nSFC to the contralesional hemisphere and cerebellum (Table 3) in stroke subjects. Specifically, nSFC was greater within the precentral gyrus (t= 2.45, tlow= 3.70), postcentral gyrus (t= 1.56, tlow= 2.92),
and right cerebellar crus IV (t= 3.0, tlow= 3.48) for stroke subjects.
These differences were correlated with Box and Blocks score (P< 0.05), with all significant correlations being negative (i.e. higher connectivity in lower-functioning stroke subjects) (Fig. 8b, right; Table 3).
Fig. 4.Scatter plots of clinical correlations with iSFC. Spatial maps and scatterplots of the correlation between structurofunctional metrics and the Box and Blocks score. Spatial maps indicate the location of significantly correlated clusters, color coded byP-value after correction for multiple comparisons. The scatterplots show the individual subject data and regression line for the correlation analyses. t-values indicate the comparison between the stroke subjects (circles) and controls (triangles), where tlowindicates the t value for comparison of the
stroke subjects with non-normal Box and Block score (red triangles) and controls. A. The significant cluster (P< 0.01, corrected) with a positive structurofunctional (iSFC) correlation with Box and Blocks was located in the right cerebellum. B. Significant negative correlations betweenl̂and Box and Blocks score were observed in the thalamus and right cerebellum. C. Correlations between iSFC∙l̂and Box and Blocks score were observed in the superior frontal gyrus (SFG).
4. Discussion and conclusions
The results of this study indicated a decrease in structurofunctional connectivity to key integrative areas of the brain, including the cere-bellum, midbrain and thalamus. These areas are critical to motor function and iSFC in the cerebellum was significantly correlated to hand motor function (i.e. the Box and Blocks score). Thus, connectivity of the cerebellum based on iSFC might be a key indicator of sensor-imotor function in stroke subjects. This observation with voxel-based iSFC measures was supported by observations of changes in con-nectivity of the cerebellar network identified by an ICA analysis of resting state fMRI data. A comparison of the SFC-enhanced cerebellar network across stroke and control subjects demonstrated decreases in connections to the cerebellum that were correlated with hand function. These observations strongly suggest that connections to the cerebellum are important indicators of motor function in stroke subjects.
Although complex, a married structural-functional connectivity both complements and builds upon the studies that focus on either structural or functional connectivity. Enhancing well-documented resting-state networks from fMRI studies with established structural connectivity techniques may reveal network-specific mechanisms un-derlying pathology and recovery. This paper developed a novel metric that is not limited to stroke populations. Regions structurally connected
to a damaged functional network may be central to cortical re-organization. These local areas may have direct structural connections to the perilesional tissue. SFC-enhancement is a novel way for in-vestigators to focus in on specific RSNs to investigate the structure-function relationship at the voxel level.
Stroke subjects had reduced voxel-wise intrinsic structurofunctional connectivity, iSFC, in highly integrative cortical areas, while structur-ofunctional resting-state networks revealed changes in organization. The iplesional sensorimotor network and cerebellar network both had reduced structurofunctional connectivity that was correlated with Box and Blocks Score. The default-mode network and prefrontal network each had increased structurofunctional connectivity to the contrale-sional hemisphere. These group differences and functional correlations were often located in regions that were outside but structurally con-nected to the conventional resting-state networks.
Our novel analysis paradigm successfully married structural and functional connectivity. Indeed, the results indicate that intrinsic functional connectivity distributions can be expressed as a function of fiber length. Although resting-state functional connectivity in itself can detect differences in stroke subjects that are correlated with function, SFC may predict the broader impact of lesions on these same networks. For example, the posterior default-mode network was enhanced by SFC within the anterior cingulate gyrus, but this enhancement was lower in Table 2
Localized stroke-related differences and behavioral contrasts with the intrinsic structurofunctional connectivity (iSFC) metrics. Voxel-wise contrasts with Box and Blocks scores were calculated for iSFC, the maximum-correlationfiber-length, andfiber-length specific functional connectivity (SFC). Pearson correlation coefficients were thresholded (p< 0.01, un-corrected) to identify significant clusters, which were corrected for multiple comparisons by imposing a minimum size of 700mm3(p< 0.05, corrected). The MNI coordinate of the
maximum behavioral correlation is reported for each cluster. In order to test for group differences within each correlation cluster, the mean metric value was calculated within each cluster for every subject. Post-hoct-tests and Box and Blocks correlations were performed on the means and were corrected for multiple comparisons using false-discovery rate (q < 0.05).
Metric Cluster Stroke vs controls Box & Blocks
ROI x y z nVox t (all) t (low) R
iSFC Cbl_R 42 −61 −40 30† −2.419†† −6.005†† 0.86†† iSFC SFG_L −10 75 12 34 −2.819†† −4.284†† 0.60†† ̂ l Midbrain −6 −13 −12 37 2.349†† 3.127†† −0.85†† ̂ l Thal −22 −21 −4 25 3.085†† 4.985†† −0.69†† ̂ l MTG_L −66 −29 −8 52 1.533†† 2.438†† −0.75†† ̂ ∙ l iSFC SFG_R 2 39 44 44 −2.660†† −3.524†† 0.84†† ̂ ∙ l iSFC IFG_R 34 15 4 14 −2.894†† −4.350†† 0.82†† ̂ ∙ l iSFC Amyg_L −22 −225 −20 106 −2.882†† −3.648†† 0.69†† CZ(l= 1) SFG_L 538 −169 40 111 −3.885†† −5.102†† 0.62†† CZ(l= 3) PFC_L 346 −145 12 78 −2.932†† −4.575†† 0.66†† CZ(l= 1) PFC_L −6 −145 16 54 −2.538†† −4.581†† 0.82†† CZ(l= 2) MFG_L 146 −193 56 51 4.254†† 4.947†† −0.68†† CZ(l= 1) Cbl_R 46 −269 −44 41 −3.123†† −5.813†† 0.71†† CZ(l= 2) AG_L 130 −277 40 30 1.818†† 4.324†† −0.84†† CZ(l= 2) Midbrain 170 −237 −12 30 −1.959†† −3.287†† 0.75†† †p< 0.05. ††p< 0.01.
Fig. 5.Scatter plots showing fiber-length BOLD correlation group differences. Correlations between CZatl= 2 and Box and
Blocks score for stroke subjects (circles) and controls (triangles) are shown for two significant regions. a) Stroke subjects have increased functional connectivity of the left (ipsilesional) angular gyrus (AG) with surrounding structural connections withinfiber distance intervall= 1. b) The right (contralesional) precentral gyrus (PrCG) has decreased functional connectivity atfiber dis-tance intervall= 2.
stroke subjects.
Stroke subjects had reduced intrinsic structurofunctional con-nectivity (e.g. iSFC) between areas connected at greater fiber path distances, as shown inFig. 3. These differences were notably seen in regions that are associated with nodes of integrative cortical networks, such as the cerebellum and prefrontal cortex. The medial prefrontal cortex is densely connected to the precuneus and posterior parietal areas, forming the core of the default-mode network (DMN). It is pos-sible that the nodes of integrative networks, such as the DMN or cere-bellar networks, reorganize their connections after stroke. Whether these changes are compensatory or maladaptive remains speculation. This result is consistent with studies that have found reduced anterior-posterior DMN connectivity in aging (Vidal-Piñeiro et al., 2014). Vidal-Pineiro et al. found that white matter integrity of the cingulum was correlated with reduced DMN functional connectivity in the aging po-pulation. The results in this study suggest that anterior-posterior DMN connectivity is further reduced after stroke when compared to age-matched individuals.
We speculate that differences in the structurofunctional networks of the cerebellum and prefrontal cortex after stroke may be compensatory or maladaptive mechanisms of reorganization. Weakened sensorimotor and cerebellar networks may be shift to shorter distance connections to default-mode and prefrontal network nodes. The right cerebellum, which had reduced intrinsic SFC, also had lower SFC within the cere-bellar and ipsilesional sensorimotor networks. This result complements other studies that have found decreased functional connectivity be-tween the ipsilesional sensorimotor cortex and contralateral cerebellum (Tang et al., 2016). However, the default-mode network had increased structurofunctional connectivity to the right cerebellum. The contrale-sional superior temporal gyrus had increased SFC to the prefrontal network but decreased SFC to the ipsilesional sensorimotor network, suggesting an adaptive role of the prefrontal cortex. This result is consistent with stroke subjects having a reduced iSFC and l̂product
within the prefrontal cortex, as shown inFig. 4, which suggested that the prefrontal cortex shifts its connectivity to shorter distances.
In the stroke group, there were differences in intrinsic structur-ofunctional connectivity at specific fiber path lengths. As shown in Fig. 5, a cluster within the ipsilesional precentral gyrus had increased iSFC at thefiber length range 7–10 cm. These differences were nega-tively correlated with Box and Blocks Score, suggesting that greater motor impairment is associated with the sensorimotor cortex increases its functional connectivity with nearby areas. Furthermore, we spec-ulate that residual structural connectivity to perilesional cortical areas may guide cortical reorganization following a stroke.
Structurofunctional resting-state network analysis is a viable ex-tension to conventional ICA methods when structural connectivity in-formation is also available. Our technique may be thefirst to explicitly fuse structural and functional connectivity by combining BOLD signals across fiber endpoints. We believe that our technique is the first to express each voxel's intrinsic functional connectivity distribution as a function offiber length. This work is also the first to produce a new fMRI time course at each voxel that is a combined signal of its structural connections. The structurofunctional correlation technique is different from others that combine structural and functional connectivity. Methods introduced in the past use structural connectivity to impose constraints on functional connectivity and dynamic causal models (Sporns et al., 2000; Stephan et al., 2009). The current approach at-tempts to enhance rather than constrain functional networks in order to estimate a broader network.
Lack of task-based fMRI data is another limitation when interpreting behavioral correlations with brain function metrics. Resting-state and task-based functional connectivity have shown different changes in the stroke population versus healthy individuals. However, since lower functioning stroke subjects often exhibit more head movement during a motor task, task-based fMRI data are more susceptible to motion arti-facts. Moreover, these artifacts contaminate behavioral spatial maps.
Fig. 6.3D visualization of structurofunctional resting-state networks in healthy individuals. Shown are four selected resting-state independent components from conventional MELODIC time-concatenated group ICA (RSN) (left column) and the same components enhanced with the structurofunctional correlation metric (nSFC) (middle column). Note that these maps show the mean voxel-wise mean across the control group. The right column shows the difference in RSN and nSFC. In general, voxels that were structurally connected to the resting state network were enhanced by the correlation. Isosurface colors for in-dividual RSN and nSFC maps correspond to positive cor-relation coefficients of 0.3, 0.4, 0.5, 0.6, and 0.7. In the nSFC−RSN column (right), an isovalue of 0.3 was ex-tracted, and the surface is colored by nSFC−RSN ranging from−1 to 1, with Red: 1.0; Green: 0.0; Blue:−1.0. (For interpretation of the references to color in thisfigure le-gend, the reader is referred to the web version of this ar-ticle.)
Our approach shares many of the same limitations as functional MRI and diffusion MRI tractography. Functional connectivity MRI assumes that voxels with correlations in BOLD signal are co-active and thus functionally connected. Due to the course temporal resolution of fMRI and the slow nature of the hemodynamic response, this modeled con-nectivity is left undirected. The accuracy of structural concon-nectivity es-timated by diffusion MRI tractography approaches is limited by the fiber orientation model. Models of the orientation distribution function at each voxel make the assumption that axon organization is the prime contributor to diffusion directionality.
A common limitation of diffusion MRI tractography is that voxels with crossing white matter fibers can lead to inaccurate structural mappings. Most tractographyfibers originating in the cerebellum, for example, fail to cross at the pons, thus leading to many positive con-nections with the ipsilateral hemisphere and false negative concon-nections with the contralateral hemisphere. In this study, we chose to exclude fibers that did not cross at the pons in order to mitigate the connectivity bias introduced by this limitation of tractography. However, it is known that there are in factfibers that synapse at the red nucleus and influence the ipsilateral hemisphere. Thus, our technique was not able to detect these connections that may indeed play a role in alternative pathways
after stroke.
Structurofunctional connectivity analysis has additional limitations associated with its principle assumptions. First, the SFC model assumes that every reconstructedfiber endpoint contains neurons that are con-nected to the neurons located at the other endpoint. Since there are cases in which reconstructedfibers terminate within the white matter, our current implementation occasionally mixes the BOLD signals of gray matter voxels with white matter voxels. These violations of our assumption led to the enhancement of white matter pathways within our resulting maps. Another limitation was the usage of deterministic tractography, which does not provide a connectivity distribution for every voxel as do probabilistic approaches. Probabilistic approaches are capable of generating morefibers from the cerebellum that cross at the brainstem, which would have been beneficial for studying the cere-bellum's structural-functional connectivity. In the case of a stroke, there are alterations of the vasculature and white matter microstructure within and nearby the lesion that may impact the SFC model's as-sumptions.
The SFC-metric results in this study may have been impacted by data artifacts in resting-state fMRI data caused by head motion. Head motion was corrected using affine image registration, and these motion
a)
b)
nSFC
nSFC
Fig. 7.Behavioral correlations of nSFC in sensorimotor and cerebellar networks.
Network-based structurofunctional correlations (nSFC) of the ipsilesional sensorimotor network (a) and cerebellar network (b) are shown for controls (upper left in each subfigure) stroke subjects (to the right of the controls) and individual stroke subjects (lower row in each subfigure). For t-value maps, blue and red surfaces indicate negative and positive t-values, where a negative t value indicates stroke subjects had lower nSFC than controls. Box and Blocks maps indicate clusters with significant correlations between nSFC and the Box and Blocks score (P< 0.05). The numbers over individual nSFC maps indicate the Box and Blocks scores for those subjects. Correlation plots for the Box and Blocks are shown for the right superior temporal gyrus (STG R) (a) and right cerebellum (Cbl R) (b). (For interpretation of the references to color in thisfigure legend, the reader is referred to the web version of this article.)
regressors were treated as covariates in all functional connectivity analysis. However, recent resting-state fMRI studies have introduced a scrubbing technique that excludes frames based on frame-by-frame change in percent BOLD signal (Power et al., 2012). Strong spikes in the global BOLD signal may have then impacted the temporal correlations used to identify RSNs. The distribution of frame-by-frame global BOLD signal in each subject is shown in Fig. S4. There were no significant differences between stroke subjects and controls in framewise dis-placement (FD) nor DVARS. Additionally, these metrics were not cor-related with the behavioral measures collected.
Another critical source of potential error in any voxel-based ap-proach is intersubject and intermodality image registration. This study involved coregistration of functional, structural, and diffusion MRI within and between subjects. Each of these modalities has its own un-ique artifacts. Spatial distortions inherent to echo-planar imaging have different characteristics between diffusion and functional MRI, leading to a nonlinear mapping between voxels. An additionalfield-correction map can be acquired before the EPI scan in order to correct the dis-tortions. This study did not include thisfield-map in its acquisition. In order to improve mappings between diffusion and functional MRI spaces, a nonlinear deformable registration was performed on mean BOLD images between subjects. Such a registration between functional images has been subject to criticism.
In this study, respiration and cardiac cycle were not treated as coregressors, which leaves them as potential confounds. These physio-logical processes have been shown to introduce artifacts into resting-state connectivity analyses. It has been recommended that these data be collected during the scan and be treated as coregressors during the ICA and/or seed-based connectivity analyses. However, other investigators have argued against this correction measure since that there may be important cortical activity that is highly correlated with respiration and heart rate. Independent components that were determined to be related to artifact or noise were regressed out of our data before applying our analyses.
The innovative significance of the structurofunctional correlation metrics is governed by the biological interpretation of BOLD signals averaged atfixedfiber distances. Transmission time of an action po-tential depends not only on physical distance, but also on conduction velocity. Conduction velocity increases with axon diameter and can
scale tenfold in the presence of myelin (Caminiti et al., 2013; Hartline and Colman, 2007). On the other hand, the time-scale of the hemody-namic response and BOLD signalfluctuations is over multiple seconds. Thus, conduction velocity is not expected to have a significant impact on the SFC model.
Hemodynamic lag in resting-state data (Mitra et al., 2014) was not estimated in this study and may have contributed to the differences in functional connectivity. However, since differences in hemodynamic lag may be influenced by more than onefiber pathway, incorporating such delay estimates into our model is nontrivial. The impact of he-modynamic lag on SFC network enhancement will need to be in-vestigated in future studies.
The residual structural and functional connectivity of the brain after stroke may be used to select a personalized treatment that maximizes functional outcomes. In such an approach, structurofunctional resting-state networks would allow for targeting specific functional systems while incorporating both types of connectivity information.
In conclusion, our novel analysis can detect changes in structure-function interactions in cortical networks after stroke. Future work will investigate changes in structurofunctional networks between acute and chronic phases of stroke, and potential applications for personalized rehabilitation will be considered. Additionally, SFC will be validated with a publicly available collection of young healthy adults.
Acknowledgements
This work was supported by the Marquette University Strategic Innovation Fund (grant number 37) and the Ralph and Marion C. Falk Medical Research Trust. The contents of this article were developed under a grant from the National Institute on Disability, Independent Living, and Rehabilitation Research (NIDILRR grant number 90RE5006, formerly NIDRR H133E100007). NIDILRR is a Center within the Administration for Community Living (ACL), Department of Health and Human Services (HHS). The contents of this article do not necessarily represent the policy of NIDILRR, ACL, HHS, and you should not assume endorsement by the Federal Government. The funding sources had no involvement in study design; in the collection, analysis and inter-pretation of data; in the writing of the report; and in the decision to submit this article for publication.
Table 3
Voxel-based group differences in SFC-enhanced networks. Clusters of significantly different voxels between stroke and age-matched controls are reported for the SFC-enhancement resting-state networks. Acronyms: Crus: AG: angular gyrus, CGH: cingulate gyrus, Fu: fusiform gyrus, IFG: inferior frontal gyrus, Ins: insular cortex, ITG: inferior temporal gyrus, MFG: middle frontal gyrus, MFOG: middle fronto-orbital gyrus, MTG: middle temporal gyrus, PoCG: postcentral gyrus, PrCG: precentral gyrus, PreCu: precuneus, SFG: superior frontal gyrus, SMG: supramarginal gyrus, STG: superior temporal gyrus, Thal: thalamus.
Network Cluster Stroke vs controls Box & Blocks
Independent component ROI x y z nVox t (all) t (low) R
Right insula SS_L −42 −18 −16 31† 1.472†† 2.896†† −0.75†† Prefrontal Cbl_R 11 −75 −40 57 2.024†† 3.280†† −0.80†† Left insula STG_R 27 14 −32 130 2.848†† 4.281†† −0.77†† STG_R 55 −14 0 42 1.759†† 3.933†† −0.67†† Default-mode (post) SFG_R 27 −2 65 378 2.086†† 3.444†† −0.77†† Cbl_R 15 −51 −32 150 3.669†† 4.954†† −0.64†† Cbl_L −34 −63 −52 114 2.704†† 3.449†† −0.66†† Cbl_R 31 −79 −48 46 3.741†† 3.844†† −0.62†† Basal ganglia Cbl_R 23 −59 −48 226 2.049†† 3.879†† −0.77†† Caud_L −18 10 16 235 2.093†† 4.060†† −0.90†† SFG_R 7 6 57 266 2.187†† 2.831†† −0.64††
Right sensorimotor IFG_R 27 14 25 55 −4.400†† −3.731†† 0.48††
PrCG_L −18 −18 53 39 −3.851†† −4.185†† 0.44††
Left amygdala Cbl_L −34 −39 −36 31 1.631†† 2.773†† −0.73††
Left sensorimotor IFG_R 35 −18 0 487 −2.485†† −6.045†† 0.91††
MFG_R 51 14 41 175 −1.400†† −2.885†† 0.88††
Network acronyms: Salience: salience network nodes in anterior cingulate gyrus and bilateral insula, SM: sensorimotor network and contralateral cerebellum, Cerebellum: bilateral cerebellum network, DMN ant: default-mode network anterior half, Prefrontal: prefrontal cortex near anterior surface, aCingG: anterior cingulate gyrus.
†p< 0.05. ††p< 0.01.
Appendix A. Supplementary data
Supplementary data to this article can be found online athttp://dx. doi.org/10.1016/j.nicl.2017.07.002.
References
Basser, P.J., Mattiello, J., Le Bihan, D., 1994. MR diffusion tensor spectroscopy and imaging. Biophys. J. 66, 259–267.http://dx.doi.org/10.1016/S0006-3495(94) 80775-1.
Beckmann, Mackay, Filippini, Smith, 2009. Group comparison of resting-state FMRI data using multi-subject ICA and dual regression. NeuroImage 47, S148.http://dx.doi. org/10.1073/pnas.0811879106.
Beckmann, C.F., Smith, S.M., 2004. Probabilistic independent component analysis for functional magnetic resonance imaging. IEEE Trans. Med. Imaging 23, 137–152.
http://dx.doi.org/10.1109/TMI.2003.822821.
Behrens, T.E.J., Johansen-Berg, H., Woolrich, M.W., Smith, S.M., Wheeler-Kingshott, C.A.M., Boulby, P.A., Barker, G.J., Sillery, E.L., Sheehan, K., Ciccarelli, O., Thompson, A.J., Brady, J.M., Matthews, P.M., 2003. Non-invasive mapping of connections be-tween human thalamus and cortex using diffusion imaging. Nat. Neurosci. 6, 750–757.http://dx.doi.org/10.1038/nn1075.
Behrens, T.E.J., Berg, H.J., Jbabdi, S., Rushworth, M.F.S., Woolrich, M.W., 2007. Probabilistic diffusion tractography with multiplefibre orientations: what can we gain? NeuroImage 34, 144–155.http://dx.doi.org/10.1016/j.neuroimage.2006.09. 018.
Biswal, B., Zerrin Yetkin, F., Haughton, V.M., Hyde, J.S., 1995. Functional connectivity in the motor cortex of resting human brain using echo-planar mri. Magn. Reson. Med. 34, 537–541.http://dx.doi.org/10.1002/mrm.1910340409.
Buch, E.R., Modir Shanechi, A., Fourkas, A.D., Weber, C., Birbaumer, N., Cohen, L.G.,
2012. Parietofrontal integrity determines neural modulation associated with grasping imagery after stroke. Brain 135, 596–614.http://dx.doi.org/10.1093/brain/awr331. Caminiti, R., Carducci, F., Piervincenzi, C., Battaglia-Mayer, A., Confalone, G.,
Visco-Comandini, F., Pantano, P., Innocenti, G.M., 2013. Diameter, length, speed, and conduction delay of callosal axons in macaque monkeys and humans: comparing data from histology and magnetic resonance imaging diffusion tractography. J. Neurosci. 33, 14501–14511.http://dx.doi.org/10.1523/JNEUROSCI.0761-13.2013. Carter, A.R., Astafiev, S.V., Lang, C.E., Connor, L.T., Strube, M.J., Pope, D.L.W., Shulman,
G.L., Corbetta, M., 2010. Resting inter-hemispheric fMRI connectivity predicts per-formance after stroke. Ann. Neurol. 67, 365–375.http://dx.doi.org/10.1002/ana. 21905.Resting.
Carter, A.R., Shulman, G.L., Corbetta, M., 2012. Why use a connectivity-based approach to study stroke and recovery of function? NeuroImage 62, 2271–2280.http://dx.doi. org/10.1016/j.neuroimage.2012.02.070.
Chen, J.L., Schlaug, G., 2016. Increased resting state connectivity between ipsilesional motor cortex and contralesional premotor cortex after transcranial direct current stimulation with physical therapy. Sci Rep 6, 23271.http://dx.doi.org/10.1038/ srep23271.
Crofts, J.J., Higham, D.J., Bosnell, R., Jbabdi, S., Matthews, P.M., Behrens, T.E.J., Johansen-Berg, H., 2011. Network analysis detects changes in the contralesional hemisphere following stroke. NeuroImage 54, 161–169.http://dx.doi.org/10.1016/j. neuroimage.2010.08.032.
Damoiseaux, J.S., Greicius, M.D., 2009. Greater than the sum of its parts: a review of studies combining structural connectivity and resting-state functional connectivity. Brain Struct. Funct. 213, 525–533.http://dx.doi.org/10.1007/s00429-009-0208-6. Du, Y., Fan, Y., 2013. Group information guided ICA for fMRI data analysis. NeuroImage
69, 157–197.http://dx.doi.org/10.1016/j.neuroimage.2012.11.008.
Fjell, A.M., Sneve, M.H., Grydeland, H., Storsve, A.B., Amlien, I.K., Yendiki, A., Walhovd, K.B., 2017. Relationship between structural and functional connectivity change across the adult lifespan: a longitudinal investigation. Hum. Brain Mapp. 38, 561–573.http://dx.doi.org/10.1002/hbm.23403.
Fox, M.D., 2010. Clinical applications of resting state functional connectivity. Front. Syst.
a)
b)
nSFC
nSFC
Fig. 8.Behavioral correlations of nSFC in prefrontal and default-mode networks. SFC-enhanced prefrontal network (a) and default-mode network (b) are shown in stroke subjects, age-matched controls, and individual stroke subjects. Blue and red surfaces indicate negative and positive t-values and correlations with significance level ofP< 0.05. STG R: right superior temporal gyrus, PrCG R: right precentral gyrus. (For interpretation of the references to color in thisfigure legend, the reader is referred to the web version of this article.)