Secure multivariate large-scale multi-centric analysis through
on-line learning: an imaging genetics case study
Marco Lorenzi
a, Boris Gutman
b, Paul M. Thompson
b, Daniel C. Alexander
a, Sebastien
Ourselin
a, and Andre Altmann
aa
Translational Imaging Group, Centre for Medical Image Computing, Universtity College
London, London, UK
b
Imaging Genetics Center, University of Southern California, Marina del Rey, CA, USA
ABSTRACT
State-of-the-art data analysis methods in genetics and related fields have advanced beyond massively univariate analyses. However, these methods suffer from the limited amount of data available at a single research site. Re-cent large-scale multi-Re-centric imaging-genetic studies, such as ENIGMA, have to rely on meta-analysis of mass univariate models to achieve critical sample sizes for uncovering statistically significant associations. Indeed, model parameters, but not data, can be securely and anonymously shared between partners. We propose here partial least squares (PLS) as a multivariate imaging-genetics model inmeta-studies. In particular, we propose an online estimation approach to partial least squares for the sequential estimation of the model parameters in data batches, based on an approximation of the singular value decomposition (SVD) of partitioned covariance matri-ces.We applied the proposed approach to the challenging problem of modeling the association between 1,167,117 genetic markers (SNPs, single nucleotide polymorphisms) and the brain cortical and sub-cortical atrophy (354,804 anatomical surface features) in a cohort of 639 individuals from the Alzheimer’s Disease Neuroimaging Initiative. We compared two different modeling strategies (sequential-andmeta-PLS) to the classic non-distributed PLS. Both strategies exhibited only minimal approximation errors of model parameters. The proposed approaches pave the way to the application of multivariate models in large scale imaging-genetics meta-studies, and may lead to novel understandings of the complex brain phenotype-genotype interactions.
Keywords: imaging-genetics, partial least squares, online learning, meta analysis
1. INTRODUCTION
State-of-the-art data analysis methods in genetics and related fields have advanced beyond massively univariate analyses. However, these methods suffer from the limited amount of data available at a single research site. The reliability of multivariate models in imaging-genetics is usually hampered by the low sample size of the studies on the order of 100s of individuals, relatively to the large number of parameters, which is at least one order of magnitude higher.
Genetic variants often have only a small effect on disease risk or other quantitative phenotype such as measures derived from brain imaging. Thus, in order to gather sufficient statistical power to detect significant associations large samples sizes are required typically in the range of 10,000s subjects. Achieving this critical sample size is often hampered by practical considerations such as the need to transfer large volumes of data to one single research site and the bureaucratic burden associated with data transfer agreements. To circumvent data transfer large genetics and imaging-genetics consortia have relied on the concept of meta analysis. For instance, ENIGMA,1which studies the association between brain phenotype and genotype on very large cohorts, relies on meta-analysis of mass univariate models to achieve critical sample sizes. In a meta-analysis only
Data used in preparation of this article were obtained from the Alzheimer’s Disease Neuroimaging Initiative (ADNI) database (adni.loni.usc.edu). As such, the investigators within the ADNI contributed to the design and implemen-tation of ADNI and/or provided data but did not participate in analysis or writing of this report. A complete list-ing of ADNI investigators can be found at: http://adni.loni.usc.edu/wp-content/uploads/how_to_apply/ADNI_ Acknowledgement_List.pdf
the results of a statistical test (i.e., p-value, effect size, standard error, sample size) are shared, but not the individual-level data. In this way, model parameters, but not data, can be securely and anonymously shared between partners. Indeed, meta-analysis represents the standard paradigm of modern large-scale clinical research projects, involving research and medical institutions with different data sharing policies and restrictions. Thus far, meta-analysis has been applied only to classic univariate associate tests. Hence, the development of powerful multivariate modeling approaches within a meta-analysis context is an impelling need to better model the complex brain phenotype-genotype interactions in very large cohorts. We propose here partial least squares (PLS) as a multivariate imaging-genetics model in meta-studies. In particular, inspired by early works on recursive partial least squares2we propose a novel iterative approach to PLS for the sequential estimation of the model parameters in data batches, based on the approximation of the singular value decomposition (SVD) of partitioned covariance matrices.
We propose two different meta-modeling strategies for parameter estimation and cross-validation, which are compliant with the anonymity restrictions: 1) the PLS model parameters are transmitted and updated by each centre sequentially (sequential-PLS), and 2) the PLS model parameters are independently estimated by each centre and subsequently merged (meta-PLS). While both strategies are asymptotically equivalent, their degree of approximation depends on the batch sample size, and on the number of latent components. We applied the proposed strategies to the challenging problem of modeling the multivariate association between 1,167,117 genetic markers (SNPs; single nucleotide polymorphisms) and the brain cortical and sub-cortical atrophy (354,804 anatomical surface features) in a cohort of 639 individuals from the Alzheimer’s Disease Neuroimaging Initiative (ADNI). We compared sequential- and meta-PLS to the classic non-distributed PLS, assessing agreement in model parameters. Both strategies exhibited only minimal approximation errors.
The proposed approaches pave the way to the application of multivariate models in large scale imaging-genetics meta-studies, and may lead to novel understandings of the complex brain phenotype-genotype interac-tions.
2. PLS FOR THE ANALYSIS OF MULTIMODAL FEATURES IN MEDICAL
IMAGING
This section introduces notations and the theoretical context of PLS. Let X={xi}Nsub
1 and Y={yi}
Nsub
1 be
n subjects×n f eaturesobservation matrices of featuresxi∈Rn andyi∈RmforNsub individuals.
PLS is a standard approach for modeling the joint variation betweenXandY, and is classically formulated through the decomposition of the matrices XandY by means of linear mappingsuandv. The mappings are optimised in order to maximise the covariance between the projections,Xu, andYv.
Among the several versions of PLS,3–7we focus here on the symmetric formulation of PLS computed through the SVD of the cross-covariance matrix XY0 = UWV0. This approach has been inspired by the analysis of principal modes of variability in neuroimaging data8 and has been popularized in the field of neuroimaging in the seminal works,5, 6 for the study of positron emission tomography (PET) and functional magnetic resonance images (fMRI) through the analysis of the associated eigen-modes of intensity variation.
The firstkeigen-modesU0 ={ui}ki=1andV0 ={vi}ki=1provide a low-dimensional representation of the main correlation modes betweenXandY, where the relative components weights are informative of the relevance of specific features in explaining the overall variation. In spite of the apparently prohibitive computational cost of the SVD of the large covariance matrixXY0 (n f eaturesX×n f eaturesY), Worsley and colleagues showed that the main eigen-modes of variation can be derived from the solution of the eigen-problem associated to the usually smaller (n subjects×n subjects) matrixXX0YY0.9 Thanks to this contribution it has been shown that PLS can be successfully employed in the modeling of high-dimensional functional and structural brain connectivity,9 as well as of the joint variation between brain structure and function,10and between imaging and genetic data.11, 12
3. SVD-PLS IN LARGE-SCALE MULTI-CENTRIC STUDIES
In this section we propose a novel approach to PLS within an online-learning framework. We assume that the set of observations is partitioned in clusters Cl,l= 1, . . . , Nl, representing for instance different clinical centres, and we denote with Xc andYc the set of observations belonging to the clusterc.
X C, n_Indmdu I r C. Cw Y' n features X, Y, MEE
+
Y'I
Xz MIN x_
11111+
ONE NEE EwY'
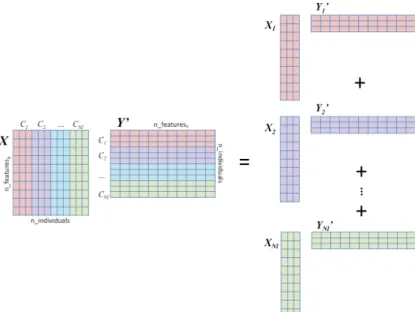
ENE X,v,INN ENE ENE ONE INE Ell MNFigure 1. The cross-covariance matrix of partitioned data can be decomposed as the sum of cluster-specific covariances.
We start by noting that, with reference to Figure 1, the global cross-covariance matrix C = XY0 can be decomposed as the sum of cluster-specific covariances: XY0 =P
lXlY0l. Therefore, in a meta-analysis context, the estimation of the SVD-PLS model does not require the access to individual data, and can be done by sharing the cross-covariance matrices Cl. However this operation may be still prohibitive, since the matrices Cl are as well of dimension n f eaturesX×n f eaturesY, therefore usually very large. However, this limitation can be overcome by replacing the matrices XlYl0 by their approximation via SVD decomposition: XlY0l = UlWlV0l, and thus by sharing only the firstkl eigen-vectors u(il) and vi(l), along with the respective eigen-values{w(il)}. The subsequent analysis can then be carried on the approximated covariance ˜C=P
lUlWlV0l∼
P
lXlY0l. It is worth noting that the SVD of the matrix ˜Cdoes not require the explicit computation of the productsUlWlV0l, which would be computationally cumbersome. Indeed, it is straightforward to show that ˜C= ˜XY˜0, where the columns of ˜Xand ˜Y are respectively the components{u(il)}, and{wi(l)v(il)}, i= 1, . . . , kl, andl = 1, . . . , Nl. In this way the SVD of ˜Ccan still be efficiently computed with the approach proposed by Worsley and colleagues.9 This numerical scheme motivates the definition of the follwing online-learning approaches to PLS, based on two different learning strategies, and denoted respectively bysequential and meta-PLS.
3.1 Sequential-PLS
In sequential-PLS we start from an initial approximation of the firstk0eigen-components of the cross-covariance matrix: {u(0)i },{v(0)i }, and{w(0)i },i= 1, . . . , k0. The components are then transmitted to the centreC1, and are used to generate the augmented matrices ˜X1= [X1,{u
(0)
i }], and ˜Y1= [Y1,{w (0)
i v
(0)
i }]. The SVD of the cross-covariance matrix ˜C1= ˜X1Y˜1
0
thus estimates the updated components{u(1)i },{vi(1)}, and{w(1)i },i= 1, . . . , k1, that are subsequently transmitted to the next centres and updated in an iterative fashion.
This strategy allows at each step to estimate the model parameters by exploiting the data at each centre. The approximation of sequential-PLS arises from the degree of approximation of the transmitted componentsu(l),
v(l), andw(l) in the factorization of the covariance ˜C
l, that can be eventually negligible by sharing an adequate number of SVD components.
The drawback of sequential-PLS lies in the necessity of re-estimating the whole model in case of changes occurring at a single centre. A second practical drawback is that the centers have to coordinate themselves or have to be coordinated by a “moderator”.
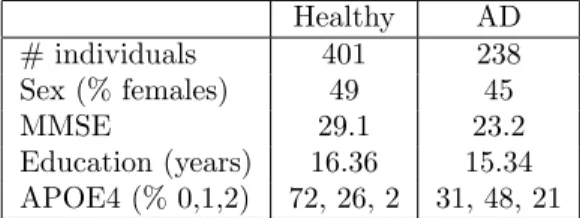
Healthy AD # individuals 401 238 Sex (% females) 49 45 MMSE 29.1 23.2 Education (years) 16.36 15.34 APOE4 (% 0,1,2) 72, 26, 2 31, 48, 21
Table 1. Summary socio-demographic, clinical and genetic information. MMSE: mini-mental state examination.
3.2 Meta-PLS
In meta-PLS each centreClindependently estimates the eigen-components{u
(l) i },{v (l) i }, and{w (l) i },i= 1, . . . , kl approximating the cross-covariances XlYl0. The different components are then concatenated to form matrices
˜
X= [{u(l)}] and ˜Y= [{w(l)v(l)}], and the eigen-components are finally obtained from the SVD of the matrix
˜ X ˜Y0.
Similarly as in sequential-PLS, the approximation introduced in meta-PLS depends on the approximations made at each centre. However, since the full model is estimated on the joint components in ˜Xand ˜Y, it does not directly exploit the data at each centre.
An advantage of meta-PLS is that it can easily accommodate for eventual changes occurring in a single centre, which can eventually re-transmit the data without affecting the model estimation in the others sites.
4. NUMERICAL APPROXIMATION
The quality of the approximation of the proposed strategies clearly depends on the number of eigen-components chosen for approximating the cross-covariance matrix at each site. In what follows the number of eigen-components is automatically estimated from the set of singular values, in order explain the 90% of the overall variability of the entire data available at each centre.
5. MODEL VALIDATION IN A CONTROLLED SETTING: AN IMAGING
GENETICS CASE STUDY
We tested the proposed sequential- and meta-PLS strategies in the context of modeling the joint variability in imaging-genetics, in the same application proposed in.12
5.1 Data processing
We selected genotype and phenotype data available in the ADNI-1/GO/2 datasets for 639 subjects. At time of imaging/study entry subjects were diagnosed as healthy individuals (N=401), and Alzheimer patients (N=238). Summary socio-demographic, clinical and genetic information are available in Table 1.
The imaging phenotype consisted of the individuals’ baseline brain cortical thickness maps estimated by Freesurfer,13 and the bilateral radial thickness maps for hippocampi and amygdalae.14 The imaging compo-nent comprises 327,684 cortical and 27,120 subcortical features per subject. These raw thickness values were normalised by covarying for age, total intracranial volume, and sex. Subsequently, data were standardised by group-wise mean and standard deviation computed in the pooled group of healthy and AD individuals.
Genotype data (Illumina Human610-Quad BeadChip for ADNI-1, and Illumina Human Omni Express for ADNI-2/GO) was downloaded from the ADNI website and preprocessed with PLINK.15Standard quality control (QC) parameters were used to filter SNPs: Minor Allele Frequency (MAF)<0.01, Genotype Call Rate<95% and Hardy-Weinberg Equilibrium<1×10⁻⁶. Finally, SNPs passing QC were imputed to the HapMap III reference panel and further quality controlled to keep only high quality imputed SNPs (i.e., MAF>0.01 and imputation quality score>0.3). Missing individual SNPs were replaced by the group-wise median. The genotype features consisted in the individuals’ minor allele counts for each of the resulting 1,167,126 SNPs in chromosomes 1 to 22. The resulting allele counts were finally standardised by group-wise mean and standard deviation computed in the pooled group of healthy and AD individuals.
0 1 2
1
3 4 St. de Sequential -PLS Meta -PLSgenotype components 1 -5 phenotype components 1 -5
3
veraye UV proaucA
St. dev. clotproduct
1.0 10.9 0.8 0.7 0.6 0.5 0.4
I::
0.00072 0.00064 0.00056 0.000484
0 0.00040 0.00032 0.00024 0.00016 0.00008 0.00000genotype components 1 -5 phenotype components 1 -5
Average dot product
0 1 v. dot product 3 4 3 4 0.9 0.8 0.7 0.6 0.5 0.4 0.3 0.2 0.1 o.o 0.00072 0.00064 0.00056 0.00048 0.00040 0.00032 0.00024 0.00016 0.00008 0.00000
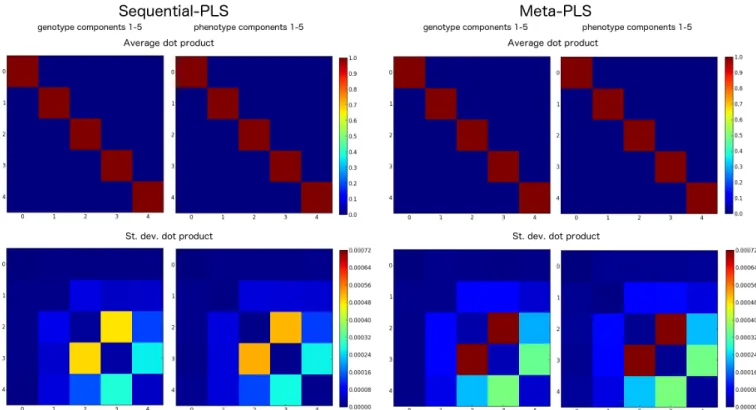
Figure 2. Average (top) and standard deviation (bottom) for the dot product between the components estimated with sequential- and meta-PLS, and the components estimated with the classic non-distributed PLS. Both strategies lead to minimal deviation from the benchmark.
5.2 Statistical analysis
The data was randomly partitioned in two non-overlapping groups (each of size n= 319) in order to simulate independent centres. Within this simulated setting, sequential- and meta-PLS were applied to estimate the respective model parameters. The results were compared to those obtained with the classic non-distributed PLS, in terms of dot-product between components (which quantifies the angle between the spanned eigen-spaces), and of the absolute feature-wise error between the components weights, measured as Σi|wi|−|
˜
wi|
|wi| , where
wi and ˜wiare features for respectively non-distributed and online PLS schemes. The assessment was performed on the first 5 principal eigen-components, and the whole procedure was repeated 50 times with varying data partitions.
6. RESULTS: COMPONENT STABILITY
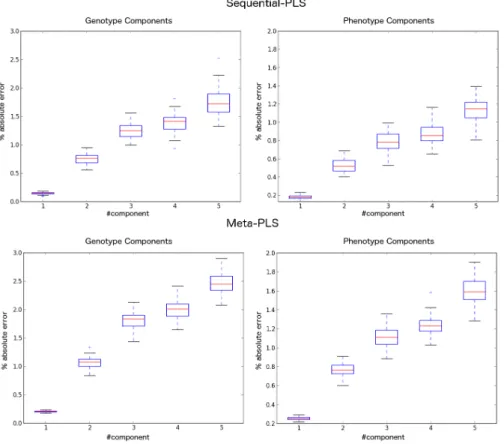
Figure 2 shows the component-wise dot-product between the proposed strategies and the non-distributed PLS, averaged across folds. For all the considered cases the product matrix is diagonal, to indicate that both sequential-and meta-PLS lead to negligible deviations from the benchmark. Nevertheless, the variability introduced by meta-PLS is slightly higher. The approximation quality of the proposed online-learning schemes is confirmed by the feature-wise absolute error between components weights shown in the boxplots of Figure 3. Errors are generally of small magnitude, and increase for the higher components. In particular, sequential-PLS generally leads to slightly better approximation than meta-PLS.
On average 282 components were estimated at each centre in order explain 90% of the overall local variability.
7. CONCLUSIONS
In this work we explored an innovative approach to multivariate modeling in a meta-analysis context. We showed that classical SVD-PLS can be naturally extended to online-learning schemes by leveraging on simple algebraic
3.0 2.5 ó 2.0 p 1.5 1.0 as 0.0 Sequential -PLS
Genotype Components Phenotype Components
2.0 1.8 1.6 -t 1.4 -m 1.2 -Ó 1.0 -y 0.8 0.6 0.4 0.2 -2 3 5 1 3 4 #component Meta -PLS 3.0 2.5 #component Genotype Components 0.5 0.0 2 3 #component z0 1.8 1.6 -1.4 0 1.2 -ri1.0 2 Y 0.80.6 0.4 -Phenotype Components 2 3 #component
Figure 3. Absolute feature-wise error between the components weights estimated with sequential- and meta-PLS and with the classic non-distributed PLS. Both strategies lead to minimal differences with respect to the benchmark.
properties of partitioned covariance matrices. We compared two different modeling strategies (sequential-and
meta-PLS) to the classic non-distributed PLS. We show that the methods have great promise for our target application, imaging genetics. In a preliminary study of 639 subjects from the ADNI dataset with over 105brain MRI-based imaging features and 106genetic variants, we are able to demonstrate good convergence properties of both meta-PLS and sequential-PLS. Indeed, the approximation errors, as measured by overall PLS component compatibility, are negligible, while the individual feature weight error remains within 3%. This is a remarkable consistency in a dataset with thousands of times more features than subjects. The proposed approaches thus pave the way to the application of multivariate models in large scale imaging-genetics meta-studies, and may lead to novel understandings of the complex brain phenotype-genotype interactions. To date, there have been many successful Genome-Wide Association (GWAS), or mass-univariate studies, relying on meta-analysis. For a number of practical reasons, the latter has become the Modus Operandi of large genetics consortia, even beyond brain imaging. Yet, we are not aware of any multi-centre meta-analytic studies using multivariate techniques, such as PLS. Our approach has tremendous potential to lead to new discoveries of associations between brain imaging phenotypes and common genetic variants, particularly where multi-SNP and multi-phenotype interactions are at play.
The accuracy of the proposed schemes critically depends on the low-rank approximation at each centre. Extensions of this work will aim at investigating the relationship between the number of components shared by each centre and the overall model approximation. Another important point that will be tackled in future studies concerns the study of online cross-validation schemes for estimating confidence intervals for sequential-and meta- PLS parameters. This aspect is critical for the inference sequential-and interpretation of modeling results in imaging-genetics studies.
There is an analogy between the proposed approach and the recent group-PCA method proposed in fMRI analysis.16 In both cases we aim at an approximation of the overall covariance matrix by serial updates of
eigen-components estimated in data batches. In this work we extend this idea to the multimodal setting, and we develop the theory necessary for the implementation of the model in meta-analysis.
Finally, we hope this development will soon lead to real imaging-genetics discoveries. As part of future development, we plan to integrate meta-PLS and sequential-PLS into a large imaging genetics consortium study.
REFERENCES
[1] Thompson, P. M., Stein, J. L., Medland, S. E., Hibar, D. P., Vasquez, A. A., Renteria, M. E., Toro, R., Jahanshad, N., Schumann, G., Franke, B., et al., “The ENIGMA consortium: large-scale collaborative analyses of neuroimaging and genetic data,”Brain imaging and behavior 8(2), 153–182 (2014).
[2] Qin, S. J., “Recursive PLS algorithms for adaptive data modeling,”Computers & Chemical Engineering22, 503–514 (1998).
[3] Wold, H., “Estimation of principal components and related models by iterative least squares. multivariate analysis. edited by: Krishnaiaah pr. 1966.”
[4] Martens, H. and Naes, T., [Multivariate calibration], John Wiley & Sons (1992).
[5] McIntosh, A., Bookstein, F., Haxby, J. V., and Grady, C., “Spatial pattern analysis of functional brain images using partial least squares,”Neuroimage3(3), 143–157 (1996).
[6] Worsley, K. J., “An overview and some new developments in the statistical analysis of PET and fMRI data,”
Human Brain Mapping5(4), 254–258 (1997).
[7] McIntosh, A. R. and Lobaugh, N. J., “Partial least squares analysis of neuroimaging data: applications and advances,” Neuroimage23, S250–S263 (2004).
[8] Friston, K., Frith, C., Liddle, P., and Frackowiak, R., “Functional connectivity: the principal-component analysis of large (PET) data sets,” Journal of Cerebral Blood Flow & Metabolism13(1), 5–14 (1993). [9] Worsley, K. J., Chen, J.-I., Lerch, J., and Evans, A. C., “Comparing functional connectivity via thresholding
correlations and singular value decomposition,” Philosophical Transactions of the Royal Society of London B: Biological Sciences 360(1457), 913–920 (2005).
[10] Lorenzi, M., Simpson, I. J., Mendelson, A. F., Vos, S. B., Cardoso, M. J., Modat, M., Schott, J. M., and Ourselin, S., “Multimodal image analysis in Alzheimer’s disease via statistical modelling of non-local intensity correlations,” Scientific reports6(22161) (2016).
[11] Lorenzi, M., Gutman, B., Hibar, D. P., Altmann, A., Jahanshad, N., Thompson, P. M., and Ourselin, S., “Partial least squares modelling for imaging-genetics in Alzheimer’s disease: Plausibility and generalization,” in [2016 IEEE 13th International Symposium on Biomedical Imaging (ISBI)], 838–841, IEEE (2016). [12] Lorenzi, M., Gutman, B., Altmann, A., Hibar, D. P., Jahanshad, N., Thompson, P. M., and Ourselin, S.,
“Linking gene pathways and brain atrophy in Alzheimer’s disease.” Alzheimer’s Association International Conference (AAIC 2016) (2016).
[13] Dale, A. M., Fischl, B., and Sereno, M. I., “Cortical surface-based analysis: I. segmentation and surface reconstruction,”Neuroimage9(2), 179–194 (1999).
[14] Gutman, B. A., Hua, X., Rajagopalan, P., Chou, Y.-Y., Wang, Y., Yanovsky, I., Toga, A. W., Jack, C. R., Weiner, M. W., Thompson, P. M., et al., “Maximizing power to track Alzheimer’s disease and MCI progression by LDA-based weighting of longitudinal ventricular surface features,” Neuroimage70, 386–401 (2013).
[15] Purcell, S., Neale, B., Todd-Brown, K., Thomas, L., Ferreira, M. A., Bender, D., Maller, J., Sklar, P., De Bakker, P. I., Daly, M. J., et al., “PLINK: a tool set for whole-genome association and population-based linkage analyses,”The American Journal of Human Genetics81(3), 559–575 (2007).
[16] Smith, S. M., Hyv¨arinen, A., Varoquaux, G., Miller, K. L., and Beckmann, C. F., “Group-PCA for very large fMRI datasets,”NeuroImage101, 738–749 (2014).