Department of Quantitative Social Science
Do Performance Targets Affect
Behaviour? Evidence from Discontinuities
in Test Scores in England
Marcello Sartarelli
DoQSS Working Paper No. 11-02
March 2011
DISCLAIMER
Any opinions expressed here are those of the author(s) and not those of the Institute of Education. Research published in this series may include views on policy, but the institute itself takes no institutional policy positions.
DoQSS Workings Papers often represent preliminary work and are circulated to encourage discussion. Citation of such a paper should account for its provisional character. A revised version may be available directly from the author.
Department of Quantitative Social Science. Institute of
Education, University of London. 20 Bedford way, London
Do Performance Targets Affect Behaviour?
Ev-idence from Discontinuities in Test Scores in
England
Marcello Sartarelli∗†
Abstract.Performance targets are ubiquitous in all areas of an individual’s
life such as education, jobs, sport competitions and charity donations. In this paper I assess whether meeting performance targets in tests at school has an effect on students’ subsequent behaviour. This is helpful to test whether motivation and effort by students, parents and schools that the targets may induce, contribute to explain observed behaviour. I address potentially spuri-ous correlations between test scores and behaviour by exploiting a regression discontinuity design in tests and a linked dataset of test scores and subse-quent behaviour by students in compulsory education in England. I find that meeting a target that the government sets for students at age 11 has an insignificant effect on outcomes such as the probability of absence from school or of a police warning. I also find that meeting other targets for high and low ability students decreases the probability of being bullied by up to 34% with respect to the mean probability of such outcomes. The effects are heterogeneous as they vary by gender, parents’ education level and type of behaviour. Overall, the research design offers a valuable test to assess unintended consequences that meeting the target or failing to meet it may lead to. The lack of a significant effect of targets on suspension and expulsion from school, as well as police warnings, suggests no adverse behavioural effect of performance targets, which is reassuring evidence on the design of tests in compulsory education. By using Probit estimates, one would conclude that meeting a target has an impact on behaviour. Regression discontinuity estimates show instead an insignificant effect at the expected target and a significant one at other targets for certain outcomes, although smaller than Probit estimates.
JEL classification: C21, I20, I21, I28.
Keywords: Absence, bullying, education, performance targets, police
warn-ing, regression discontinuity, suspension, test scores.
∗Department of Quantitative Social Science, Institute of Education, University of London,
20 Bedford Way London, WC1H 0AL. E-mail: (m.sartarelli@ioe.ac.uk)
†Thanks for helpful comments to Peter Backus, Lorraine Dearden, Christian Dustmann,
John Micklewright, Jeff Smith, Anna Vignoles, seminar participants at the Institute of Education, IMT Lucca, Lancaster University, Rutgers University, Universit`a di Cagliari, the 2nd Meeting of the Danish Microeconometric Society, the 2009 NASM of the Econo-metric Society, and to the Department for Education for access to the data. This research is funded by the ADMIN Node of National Centre for Research Methods (ESRC grant RES-576-25-0014). This paper was previously circulated as ”Do achievement labels affect the well-being of children? Evidence from discontinuities in test scores”.
1
Introduction
Performance targets are important in helping individuals to build human capital or signalling ability in education and in a job. However, they may have unintended consequences. For example, rewarding individuals only if they perform above the average level may increase the average performance in a school or a firm although it may also change individuals’ beliefs about their ability by overstating true ability for those meeting a target and viceversa for those missing the target. In addition, high ability individuals may exert little effort as the payoff is not proportional to one’s performance or effort. This may occur in any agency relationship in which an individual’s effort is not typically observed and may result in suboptimal effort provision and outcome in a production process. Potentially low motivation or performance may lead to actions by parents or teachers to help students, and by employers to help their employees. Failing this, policy interventions may help to rectify incentives and performance.1
Performance targets in employment contracts have been widely explored.2 Instead little is
known about performance targets as incentives for students. If a student fails to meet an important performance target in test scores, this may decrease the motivation for studying. On the contrary, meeting the target may instead make the student more motivated than before to study and obtain a high test score in the future. Self-confidence and beliefs about ability are additional channels through which feedback can foster positive behaviour, such as leading a healthy and safe life in youth as well as in adulthood. For example, an unauthorised absence from school one day may lead to no consequence in the future. Alternatively, the student may engage in risky activities and, perhaps, be caught by the police. Understanding whether meeting performance targets in education has an impact on students’ behaviour is helpful to inform policy decisions about education, such as the design of school curricula.
In this paper I study whether meeting performance targets in tests has an effect on subsequent behaviour by students. I set out to answer this empirically by using linked administrative data from compulsory education in England on test scores and survey data on behavioural outcomes, such as the probability of absence from school or of a police warning. However, actions by parents and schools may confound the effect of meeting performance targets if, for instance, parents with a high education level make more effort than less educated parents in helping students to prepare for tests and in influencing their behaviour before and after tests are held.
Students whose ability appears not to be far from the mean value may concentrate in the test preparation on meeting the expected target that the Department for Education sets for the test, that is the focus in this paper and that is described in Section 2. For students with high or low ability, the Department sets proportional targets that are however ”implicit” or of lower importance with respect to meeting the expected one. I identify the effect of meeting a performance target in test scores, with respect to missing it, on students’ behaviour by exploiting discontinuities in test scores that the expected and implicit targets in test scores offer. The target is absolute rather than relative as scores are not normalised and targets are set before the distribution of students’ test scores in one year is known. Thanks to this research design, I can tease out the effect of confounders that influence students’ test scores and behaviour, such as parents’ or teachers’ effort, as they can only imperfectly influence students’ scores in the neighbourhood of a target threshold. However, parents can influence the behaviour of students also after tests by, for example, inducing students to study harder
1See Stiglitz (2000) for a review of contributions in information economics to overcome informational
failure in such settings as employer-employee contracts as well as in welfare-to-work programs for unemployed workers.
if they missed a test or, similarly, inducing them to carry out extra activities beyond school. In addition, parents with different characteristics, e.g. education level, may influence the behaviour of similar students differently. I will verify whether these or similar influences by parents are relevant to interpret the results in the empirical analysis.
Recent studies show evidence of the determinants of a variety of behavioural outcomes of young individuals that are similar to the ones that I use in this paper. Folianoet al.(2010) find that an increase in a proxy for value added by schools increases the disengagement in school by students in compulsory education in the UK. In related research Gibbons et al.(2010) find that neighbours’ characteristics, such as the socio-economic composition and labour market opportunities, have a positive but insignificant effect on test scores, while the sign of the effect on behavioural outcomes such as general attitudes towards schooling and substance use is mixed. In the USA Reback (2010) finds that school counsellors decrease the probability of behavioural problems in elementary schools. Gaviria and Raphael (2001) show evidence of peer effects in alcohol and drugs use in high schools. Dee (2004) finds that additional schooling has a positive effect on proxies for civic behaviour such as voting and reading newspapers.3
Recent studies also show evidence of the effect of effort and achievement on achievement in the future. De Fraja et al. (2010) model as a game the simultaneous effort by students in studying and by parents and schools in supervising them to maximise students’ achievement. They obtain a positive correlation between effort and achievement at school in equilibrium and find empirical support for it by using household data in the UK. Bandiera et al. (2009) instead study the effect of disclosing information about performance in tests on future perfor-mance in master degrees in the UK by exploiting variation in rules on perforperfor-mance feedback by university. They find a positive effect of feedback on performance in the empirical analysis. Similarly, Azmat and Iriberri (2009) study the relative performance feedback at school and find a positive effect on test scores of giving feedback to students on the distance of their scores from the average score in their class by using a natural experiment in a high school in Spain. Similarly, in this paper I use variation in performance in tests at school that a randomisation of test scores in the neighbourhood of discontinuities in scores.
The literature in economics claims that the effect of incentives on performance is positive, while the literature in psychology suggests the opposite as the two strands in the literature make different assumptions about the determinants of individuals’ motivation. Benabou and Tirole (2002, 2003) reconcile the mixed evidence by studying the effect of incentives on moti-vation with a principal-agent model. Its predictions are that the effect is negative if the agent cares about the principal’s beliefs and it is positive otherwise, because the agent may think that the principal has a bad opinion of her if a principal asks for high effort. This intuition offers an interpretation of how motivation and beliefs may influence students’ behaviour in this paper.
The recent increase in interest by policy-makers in the role of education in influencing stu-dents’ wider behaviour in society confirms the pressing need for additional knowledge on the impact of performance targets on behaviour. In 2001 the Department for Education in the USA funded ”No Child Left Behind” (NCLB). This is a multi-billion dollar policy initiative to study the determinants of test score gaps among students of schooling age and prevent adverse effects in adulthood for those left behind at school. It helps to address such policy issues as low employment and wage profiles over time as well as health problems that lagging
3Grossman (2006) reviews the literature on the positive non-market returns to education in the
long-term by focusing on such outcomes in adulthood as consumption patterns, health, fertility, child quality or well-being. Similarly, Oreopoulos and Salvanes (2009) find positive effects of education on such measures of well-being as health, marriage, parenting, trust and social ties, and a negative effect on risky behaviour in the USA.
behind at school may lead to in adulthood.4 Since 2003 the Department for Education in
the UK has funded ”Every child matters”, which is a similar policy initiative to NCLB but it puts additional emphasis on well-being and fostering positive behaviour in children. Hence, evidence in this paper on the impact of targets in tests for students on their behaviour may be of interest to policy-makers who deal with education and public policies for children. The reason is that most policy papers have focused on such determinants of children’s education outcomes as parents’ education and income.5 In contrast, little is known about the effect of
targets in education on behaviour.
In the empirical analysis I find that in simple Probit regressions an increase in the average test score by one unit is associated with a decrease in the probability of an unauthorised ab-sence from school by 3 percentage points or 22% with respect to the mean probability of this outcome. Estimates also show that a unit increase in test scores is associated with a reduction in the probability of being bullied by 9 percentage points or 21%. Similarly, estimates of differences in the mean probability of these behavioural outcomes for subsamples of students who met a target versus students who did not meet it are negative, although not statistically significant.
Regression discontinuity estimates show instead that the effect of meeting the expected per-formance target set by the Department for Education on behavioural outcomes tends not to be significant. However, for low and high ability students, the effect of meeting the other (implicit) targets versus not meeting them appears to decrease the probability of being bullied by 15 and 4 percentage points respectively, or 34% and 9%. I discuss these results in section 5 to reconcile the mixed signs and significance. The effect of meeting targets for high ability students also varies by gender, e.g. it decreases the probability of being bullied by 7 percentage points or 14% for females. Finally, the effect varies by parents’ education, e.g. it decreases the probability of being bullied by 7 percentage point or 16%, only for high ability students whose parents have a low qualification or none while.
This paper offers a novel contribution to the literature on the effects of achievement in test scores by testing whether achieving a target in test scores in compulsory education, versus missing the target, has an effect on students’ subsequent behaviour. A similar test on the link between targets in test scores and behaviour can be repeated in the future to inform policy decisions. This can be done by using similar linked administrative and survey data in the UK, as well as in other countries whose governments collect rich data on students’ achievement at school and on their behaviour, such as the National Longitudinal Survey of Youth in the USA. The structure of the rest of the paper is as follows. Section 2 describes the institutional setting and the data of students in compulsory education in England. This sets the ground for the research design in section 3 and the empirical analysis in section 4. Finally, section 5 discusses the results and concludes.
2
Institutional setting and data
In this section I describe the source of exogenous variation in test scores that identifies the effect of meeting performance targets in tests in primary school on students’ behaviour in secondary
4See Hastings and Weinstein (2007) for the evaluation of experimental policies in the No Child Left Behind
program.
5Currie and Moretti (2003) and Acemoglu and Pischke (2001) show evidence of the effect of parents’
socio-economic background on children’s education in the USA while Chevalier and Lanot (2002) show similar evidence in the UK.
school and estimate this effect by using data on students in state schools in England.6 In
this country there are 11 years of compulsory education, which is divided into the Foundation Stage Profiles plus 4 Key Stages, as Table 1 shows. It starts at age 3-4 with the Foundation Stage Profile. Primary school starts at age 5-6 with Key Stage 1 and it is followed by Key Stage 2, as columns (1)-(3) show.7 Column (5) shows the type of assessment at each stage,
which varies from teacher assessment to national assessment by external examiners. Lastly, column (6) shows the achievement levels or targets that the Department for Education expects students to meet at each Key Stage. Such targets are set out to help students, parents and schools interpret a student’s progress throughout compulsory education.8
I use two linked datasets in the empirical analysis.9 The first is the National Pupil Database
(NPD) which is an administrative dataset with information on test scores of all students in England. It also contains information from the Pupil Level Annual School Census about the ethnicity of students, whether they are eligible for Free School Meals (FSM), the English as Additional Language (EAL) program or the Special Educational Needs (SEN) program. EAL and SEN provide additional support at school to students who meet the eligibility criteria.10
The second dataset is the Longitudinal Study of Young People in England (LSYPE). This is a longitudinal survey of young people in England who are drawn from the cohort of students taking Key Stage 2 tests in 2001. The students in the survey are born between September 1989 and August 1990 and they are representative of the cohort of test-takers in 2001, whose test scores are recorded in the NPD dataset. The first wave of the survey was held in 2004 when students were 13-14 years old, in Year 9, and attending Key Stage 3 in secondary school. The survey contains information on the education and behaviour of students as well as the education, employment status and work experience of their parents. The sample size of the first wave is 15,770 students.11
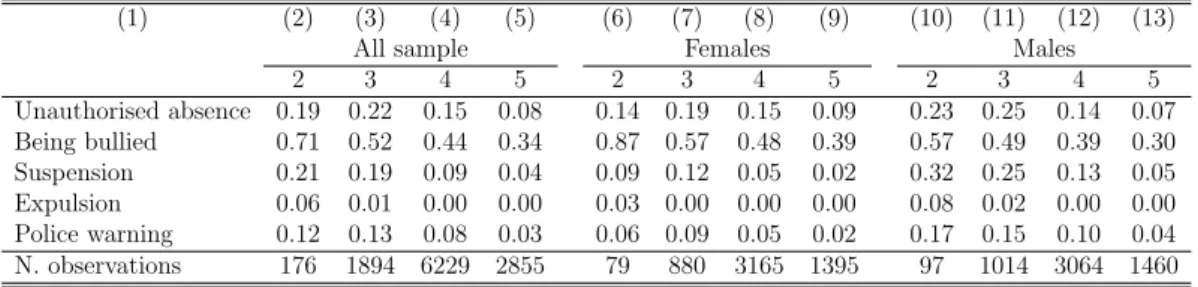
Table 2 shows summary statistics of variables that measure students’ behaviour and test scores for the full sample and for subsamples by gender. The sample size of the dataset used in the empirical analysis is equal to approximately 13,500. It is smaller than that of the full sample in the survey because variables from the survey that I use as outcome variables to measure behaviour suffer from item non-response. The second panel in Table 2 shows the incidence of missingness on these variables, which varies from 5% to 10% and I discuss this further in section 2.2.
2.1
Key Stage 2 tests
Students sit compulsory tests in English, Maths and Science when they are 10 or 11 years old, in year 6, which is the last one in Key Stage 2. The tests are set by the Qualifications
6Private schools account for about 7-8% of students in compulsory education for the period 1990-2006
(Greenet al.(2010)).
7See Bradleyet al.(2000) for additional information about the institutional setting of secondary education
in England.
8DirectGov (2010) is a government-maintained website to inform citizens about the characteristics of
services in the public sector in the UK. It motivates the test score targets by the Department for Education at each Key Stage in compulsory education as follows: ”Children develop at different rates, but National Curriculum levels can give you an idea of how your child’s progress compares to what is typical for their age”.
9The datasets are linked by using the identification number of students, thus leading to a negligible loss
in observations due to the linkage.
10The government determines eligibility for FSM status based on multiple criteria about receipt of social
benefits by parents. Instead teachers and psychologists determine eligibility for EAL and SEN status based on criteria that the Department for Education set out and that allow for discretionary assignment as some of the criteria are subjective.
and Curriculum Development Agency (QCDA), which is an independent authority from the Department for Education.12 Students are also assessed by their teachers before results in the
Key Stage 2 tests are known.
2.1.1 Tests and scores
External examiners rather than teachers mark test scripts by using numerical scores on an integer scale whose range varies by test. Four categorical achievement levels from 2 to 5 are also created as intervals of test scores. For example, in the year in question, a score lower than the threshold 22 in the Maths test leads to an achievement level equal to 2 in Maths and a score in the interval 22-48 leads to a level equal to 3.13 The Department for Education
turns raw test scores into ”fine grade” test scores. These are decimal numbers in the range 2-6 and are obtained by weighting test scores by the distance from the nearest threshold to the right of the score. For example, the threshold in the Math test score equal to 22 in the earlier example is equal to 3 in the fine grade point score scale. Test scores equal to 21 and 23 are equal to 2.96 and 3.04 in the fine grade Maths score. In the empirical analysis I use the
fine grade point score rather than the raw test score as it is advantageous to obtain precise inference.14
Examiners know the thresholds for each achievement level when they mark tests. However, the institutional setting of compulsory education in England ensures imprecise manipulation of test scores in each subject and hence of the average test score that is computed over tests in English, Maths and Science at Key Stage 2, henceforth the ”fine grade average test score”. First, the QCDA is independent from schools and administers the training of examiners who mark test scripts and who do not know students and viceversa. This rules out perfect manipulation of test scores as examiners have no information about students and their behaviour. Second, one examiner gets all test scripts in one type of test, e.g. English, in a school. Third, a student has his or her tests in English, Maths and Science each marked by a different examiner who only knows the score of one of the three tests by a student. This rules out manipulation both of the other two tests and of the average test score. Finally, external grading of tests and no monetary incentives for teachers’ performance do not make efforts by teachers a serious concern for the research strategy.15
2.1.2 Targets and disclosure of test scores
Categorical achievement levels in externally marked tests in English, Maths and Science at Key Stage 2, together with teacher assessments in these subjects, are disclosed to students and parents. Critically for the research design in this paper, the underlying test scores are not disclosed, as the results sheet that schools use to communicate test results to students
12For example the Key Stage 2 Maths test verifies learning ofi) using and applying numbers such as problem
solving and communication,ii) numbers and the number system such as counting, percentages and ratios,iii)
calculations such as mental and written methods andiv) solving numerical problems such as combining number
operations. See QCDA (2010) for additional information.
13QCDA (2010) offers additional information about thresholds in all Key Stage 2 tests.
14See Lee and Card (2008) for additional details about inference in a regression discontinuity design with
an integer-valued running variable.
15Wilson (2004) shows some evidence of responses by teachers to incentives as an increase in test scores
by students in a school with respect to their past achievement may increase future enrolment in the school. Average school performance to inform school choice in compulsory education in England has been disclosed since 1992 using value added models (Ray (2010)). In the USA instead Eberts et al. (2002) and Ladd and Walsh (2002) show evidence of the effect of monetary incentives to teachers on test scores by students.
and parents in Figure 2 shows.16 For example, two students whose fine grade score in the
Maths test is 3.03 and 3.97 get level 3 in Maths. Conversely, two students scoring 3.97 and 4.05 in the same test get level 3 and 4 respectively. When performances in tests are disclosed, students, teachers and parents can compare the students’ achievement level with the expected performance target level, which is equal to 4 as column (6) in Table 1 shows. In addition, achievement levels 3 and 5 are implicit targets for low and high ability students respectively. They may be more relevant than the expected target if students’ past achievement, e.g. in the teacher-assessed tests at Key Stage 1, was so low that they will very unlikely achieve the expected target at Key Stage 2, level 4, or viceversa so high that they will score considerably above that target. This leads to three sharp discontinuities in the ”treatment” (meeting a performance target) in tests in English, Maths or Science because the probability that a student meets a target in, for example, Maths, goes sharply from zero if he scored less than 4, e.g. 3.97, to one if he scored 4 or above, e.g. 4.05.
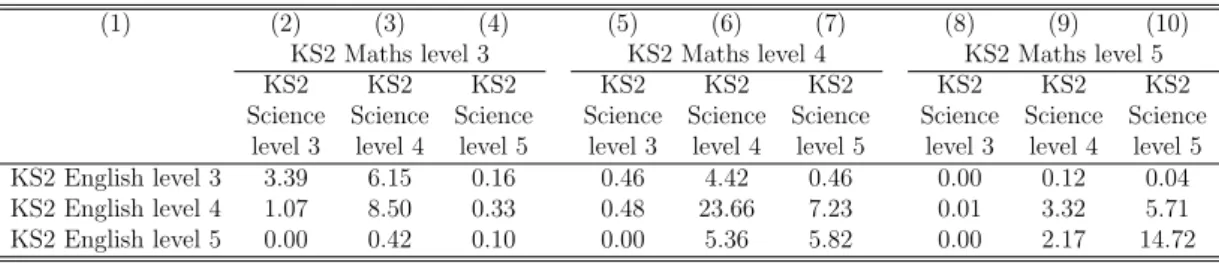
I will also exploit discontinuities in the fine grade average test score, which is the average of test scores over the three subjects. It is the best available proxy to measure the overall performance by a student in all tests at Key Stage 2 and is also not disclosed to students or parents.17 Table 3 shows in each cell percentages of students with a certain achievement level
in tests in English, Maths and Science at Key Stage 2. For example, the cell in the top row and in column (6) shows that 4.42% of students has scored level 3 in English and level 4 in both Maths and Science. These students have marginally failed the expected achievement level 4 in only one out of three tests and their average fine grade point score would be equal to 3.9 if their test score in English were only a few points below the expected target. Similarly, the cell in the second row and in column (6) shows that 23.66% of students achieved level 4 in all three tests. These students have met the expected achievement level in all tests and their average fine grade point score is equal to 4. In addition, the first row in the table shows that most of the students who score level 3 in English, thus failing to meet the target in this subject, meet at most the expected target, level 4, in Maths and/or in Science. Only 0.04% instead score above the target, i.e. they achieve level 5 in these other two subjects, as column (10) shows. This offers empirical support to the assumption that students focus in the test preparation on meeting the expected target, level 4, in all tests, rather than on scoring above the expected target, level 5, in two tests and put less effort in the third test, in which they may score at level 3. This leads to a fuzzy discontinuity because students, who met the performance target at level 4 on average, may have failed to obtain a triplet of 4s in the tests at Key Stage 2, although these students are very few as Table 3 shows.18
Figure 1 shows the empirical density of the fine grade average test score and it also shows the targets as vertical dashed lines. The support of this variable is censored because 1.6% students in the linked dataset get 2.5 as total score as Figure 1 shows. This is the minimum score that a student gets regardless of how poor is the performance in the tests. I exclude students whose fine grade average test score is equal to 2.5 from the sample that I use in the empirical analysis because such censoring is of negligible relevance when focusing on the test scores of students in a small neighbourhood of thresholds. In addition, the density and hence the number of observations are lower around the implicit target for low ability students than around the other targets.
16Additional information about the administration of Key Stage 2 tests is available in the UK Parliament
Statutory Instruments 1999 No. 2188, 2001 No. 1286 and 2003 No. 1038.
17The Department for Education uses the average fine grade point score as an input to compute value added
in schools. See Ray (2010) for additional information about value added in compulsory education in England.
18See Lee and Lemieux (2010) for additional information about sharp and fuzzy regression discontinuity
2.2
Survey evidence of students’ behaviour
A section in the questionnaire of the LSYPE survey asks questions about a child’s behaviour at school and beyond to the main parent. This is defined as ”the parent most involved in the young person’s education” (NatCen (2009)). In the empirical analysis I use as outcomes the following proxies for behaviour: absence, suspension and expulsion from school, being bullied, and police warnings to children’s parents. Each outcome variable is binary: it is equal to one if a student’s main parent answered ”yes” to a question on the behaviour of her child and zero otherwise. Table 4 lists in column (1) the outcome variables. Column (2) shows the wording of the questions underlying each variable. Column (3) shows the number of years prior to the survey interview date in which students’ behaviour may have occurred. I also use an outcome variable on self-reported unauthorised absence by students, that is also known as truancy. These data offer proxies for behaviour that is representative of a cohort of young people in England. What allows me to assess the effect of meeting a performance target on behaviour is that answers to the questionnaire in wave 1 refer to events that occur after the disclosure of the results in tests at Key Stage 2 in July 2001.
Figure 3 describes the timing of the events from Key Stage 2 tests onwards. Students sat tests at age 10-11 in May 2001 and got tests results in July 2001. In September 2001 they started secondary school with Key Stage 3. March to October 2004 is the time period in which the survey data was collected via face to face interviews with main parents and students. The questions to the main parent on students’ absence and whether they were bullied are about behaviour that occurred up to a year earlier, i.e. between March and October 2003. The questions on suspension and expulsion from school and on a police warning are instead about behaviour that occurred up to three years before the survey and up to three months before the disclosure of tests results in July 2001. I will perform robustness checks in the empirical analysis in section 4.3 to deal with potential reverse causality.
The top panel in Table 2 shows the full list of outcome variables and their summary statistics. 14% of students self-report to have been truant, i.e. absent at least one day from school with-out authorisation. 43% of main parents report that students were bullied, 10% that students were suspended, and 7 % that the police warned them about their children’s actions.19 These
variables are proxies for behaviour by students which may capture their learning process about positive behaviour, as well as about potential threats to their education and health beyond what they learn at school and from their parents.
Variables in the survey suffer from non-response which can be due to a number of reasons in-cluding refusal to answer, inability to self-complete the questionnaire and ignorance about the answer. The number of observations in the sample that I use in the empirical analysis varies by outcome variable under the assumption of no selective missingness in the outcome variable on either side of a threshold in test score. This is an identifying assumption of the research design. I discuss it in section 4.3 and robustness checks do not reject missingness at random in the outcome variable, as the percentages of missing observations to the left and to the right of a threshold are not significantly different. Answers by main parents about students’ behaviour offer the advantage of a smaller recall error with respect to surveying students. The reason is that students are 13-14 years old at the time of the survey and answer questions are about events up to three years earlier than the interview date, when their recollection of past events may be imprecise. A dummy that is equal to one if a student is bullied and zero otherwise is a proxy for a latent behaviour rather than a decision by a student. One may
19Parents also report information about expulsions from a school. However, the low variation in suspension
with a mean probability equal to 0.006 makes this behavioural outcome little informative to learn about the determinants of students’ behaviour.
expect no effect of just meeting a performance target in test scores on the probability of being bullied with respect to a similar student who has just missed the target. A non-zero effect may instead suggest statistical discrimination. This is because certain students may react to meeting a performance at school in a variety of ways which may lead other students to bully them for their reactions rather than for their achievement in tests.20 Parents can influence
these measures of behaviour by, for example, emphasising in various ways the importance of going to school regularly and being friendly to other students. This emphasises that parents’ influence on students’ behaviour can be very high on such measures of behaviour as absence while it may be lower on others such as being bullied. Evidence in the summary statistics that nearly one in two students are bullied suggests that parents may over-report whether their child is bullied. This may occur if parents mistakenly conclude that difficulties in socialising that children may experience at some point are in fact episodes in which their children are bullied.
Figure 4 and Table 5 show means of the outcome variables by achievement level. The proba-bility of different measures of behaviour for students achieving levels 2 and 3 is the greatest among all achievement levels at Key Stage 2. It then decreases with the achievement level. However, certain measures of behaviour as, for example, unauthorised absence and being bullied show low variation between achievement levels. This emphasises the importance of assessing whether these correlations between performance targets and behaviour also have a causal interpretation.
3
Research design
I assess the effect of a meeting the performance target at Key Stage 2 on measures of students’ behaviour after the disclosure of tests results. I use as outcome variable a dummyBto measure students’ behaviour. B is equal to one if two to three years after Key Stage 2 tests a student, for example, played truant and zero otherwise. The outcome variable can be interpreted as a binary indicator B = I{B∗ < B¯∗} to describe a student’s behaviour that is driven by the
unobservable motivation or beliefs B∗, for example, about the importance of school if one
considers the outcome absence.
P r(B = 1|T) = Φ(α+βP robitT) (1)
Consider in equation (1) a Probit regression ofB on a continuous measure of test scoreT, the fine grade score of each test at Key Stage 2 or the average test score over all tests, where Φ(.) is the cumulative distribution function of the standard normal. The marginal effect that is associated to βP robit is interpreted as the change in the probability that after tests a student
is, for example, truant due to a unit increase in the fine grade test score. An increase in test score from 3 to 4 or similarly from 3.2 to 4.2 leads a student to meet the expected performance target. Similarly, an increase from 4 to 5 leads a student to meet the performance target for high ability students. This gives an insight into the difference in behaviour by students with different performances in tests. However, unobservable ability of children, parental care and school arrangements that the error term in equation (1) contains may lead to a spurious correlation between test scores and behaviour if unobservables correlate with test scores.
P = I{T ≥T¯} (2)
B = f(T) +βRDP +U (3)
20Anderson et al. (2006) survey different sources of statistical discrimination in laboratory experiments
which are conducted in classrooms and eye colour, subjective preferences for colours or redistribution of pennies determine group divisions.
Using instead information on students who marginally met an achievement target, e.g. obtain a test score greater or equal to 4, with respect to students who marginally failed to meet it, e.g. obtain a score smaller than 4, helps to identify the effect of meeting a performance target with respect to not meeting it on behaviour by using a a regression discontinuity (RD) research design.21 This is the interpretation of the parameter β
RD in equation (3). P is equal to one if
a student’s test score T is greater or equal than a performance target ¯T, and zero otherwise as equation (2) shows. βRD is, for example, negative if students who met a performance target
(P = 1) are also less likely to play truant than those who did not meet it (P = 0), as meeting the target may have increased their motivation to go to school. Three thresholds ¯T equal to 3, 4 or 5 in test scores determine whether a student meets a performance targetP in equation (2). The expected performance target that the Department for Education sets for all students at Key Stage 2 is 4. By exploiting this target and those for low and high ability students at targets 3 and 5, one estimates the effect of just meeting the expected performance target at Key Stage 2 with respect to just missing the target on the probability that, a student is, for example, truant two to three years after the the disclosure of the tests results.
The research design is non-experimental. However, it is similar to an experimental one for three reasons as Lee and Lemieux (2010) suggest. First, students take decisions and act to maximise the probability of meeting a performance target in test scores (the treatment), before the test date and with the aid of parents and teachers. For example, students may prepare for tests by focusing on test topics that will be in a test with high probability. Second, obtaining a test score to the left of a threshold or target (control group) or to the right of it (treatment group) can arguably be seen as a stochastic shock to the test score due to nature, as scripts in the three compulsory tests are marked externally. Third, the treatment is assigned on the basis of the value of the test score, i.e. the running variable. In the empirical analysis I use test scores by subject in English, Maths and Science and also the average test score over all tests as running variables. The RD design holds under the identifying assumptions that students on the left of the threshold ¯T are similar to those on the right of it, for example, in their socio-economic background that parents’ education proxies.22 This is testable by estimating the
mean of conditional residuals in the left neighbourhood of the threshold, limT↑T¯E[U|T], and
in the right neighbourhood, limT↓T¯E[U|T], and it holds if their difference is not statistically
significant. Robustness checks in section 4.3 offer evidence that this assumption holds. The discontinuities in tests score in English, Maths and Science are sharp as the probability of meeting the target in each test jumps from zero to one if a students scores just to the right with respect to just to the left of a threshold. This allows one to estimate the effect of meeting a target on behaviour by fitting in equation (3) smooth polynomials f(T) in test scores T of a binary variable B equal to one, for example, if a student plays truant and zero otherwise. I estimate two smooth polynomials non-parametrically and separately for subsamples of students whose test score is smaller than the threshold ¯T and for those whose score is greater than it. βRD is estimated as the difference in the level of the polynomials at
the threshold ¯T.
Conversely, the discontinuity in the average fine grade test score is fuzzy. Students who do not meet the performance target in at least one of the tests in English, Maths and Science, and would have a probability of receiving the treatment equal to zero in a sharp design, may with a probability between zero and one meet the expected target on average. For example, they may
21Thistlethwaite and Campbell (1960) and Trochim (1984) developed the RD design. Imbens and Lemieux
(2008) and Lee and Lemieux (2010) survey the advances in the theory as well the recent increase in the number of applications of the design in economics.
22The identifying assumptions in a RD design are testable differently from instrumental variable or matching
meet the target for high ability students, level 5, in English and Maths and fail to meet the expected target, level 4, in Science but still score 4 on average. One can recover the treatment effect by dividing the difference in behaviour between students to the right and to the left of a threshold by the share of students who meet the target at either side of the threshold. This is the Wald formulation of a treatment effect in an instrumental variable strategy which can be estimated by using Two Stage Least Squares (2SLS).23I estimate the specification in equations
(2)-(3) using 2SLS for the fuzzy RD design andf(T) is estimated by using polynomials in the distance of the test score T from the threshold ¯T of up to the fourth order. The performance targets 3, 4 and 5 in test scores are thresholds at different percentiles of the distribution of the test score. I estimate the effect on behaviour of meeting a target on behaviour by using a window that is centered at ¯T and contains observations in the interval [ ¯T −1,T¯+ 1] that goes from the threshold ¯T −1 that is to the left of ¯T to the threshold ¯T + 1 to the right of
¯
T. A smaller window around the threshold ¯T would omit relevant observations of students whose test score is equal to 3 or 4. A larger window would instead include students whose fine grade test score is either so low, e.g. 2, or high, e.g. 5 that no random shock in test score would be big enough to achieve the target 4, thus estimating a potentially misspecified model. I choose the bandwidth of the polynomials by using the data-driven choice rule in Imbens and Kalyanaraman (2009) that corrects an asymptotically optimal bandwidth in theory for small sample size and specification problems. In the preferred specification I also add as covariates in the polynomials pre-determined characteristics of students that are listed in Table 2.
4
Results
In section 4.1 I show three sets of estimates, one for each test, of the effect of meeting a performance target in a test on behaviour. In section 4.2 I show similar evidence but by using the fine grade average test score as measure of performance in tests.
4.1
Test scores by subject: English, Maths and Science
Table 6 shows estimated marginal effects in Probit regressions of a dummy for a behavioural outcome in column (1) on the fine grade test score in English, Maths and Science. In each col-umn I estimate a different specification, starting with a baseline and ending with my preferred one. Details of each specification are in the bottom panel in the table and Table 2 lists the covariates in the regressions. Excluded categories of multiple-valued discrete covariates in the regressions are: teacher assessment levels equal to 5 by test subject, white ethnicity, no special educational needs status and enrolment in Community schools at Key Stage 2. Negative and statistically significant coefficients suggest that test scores and positive behaviour by students are complements as increasing the fine grade average test score by one point is associated with a decrease, for example, in the probability of being bullied by 2-5 percentage points or 25-50% with respect to the mean probability of unauthorised absence. Table 7 shows Probit and RD estimates that are obtained by using the English test score as a measure of performance. Col-umn (2) repeats the Probit estimates that are shown in colCol-umn (5) in Table 6. An increase in the test score by a unit appears in general to have a negative and significant effect on several behavioural outcomes for the full sample in column (2) and the males subsample in column (6) while the effect is not significant for the females subsample in column (10). RD estimates show instead that meeting the expected target with respect to not meeting it has a significant and negative effect only on the probability of expulsion for the full sample in column (4) and
23Hahnet al.(2001) show the connection between the Wald estimator and the fuzzy RD design, as well as
results by gender subsamples are not statistically significant. Table 8 shows estimates that are obtained by using as the running variable scores in the Maths test. Neither Probit nor RD estimates tend to be significant. However, RD estimates show that the effect of meeting the expected target, level 4, increases the probability of a police warning for the full sample in column (4) and for the males subsample in column (12). Similarly, meeting the expected target increases the probability of being bullied for males. Finally, Table 9 shows estimates that are obtained by using scores in the Science test and neither Probit nor RD estimates tend to be significant. The positive effect of meeting the expected target, level 4, on the probability of unauthorised absence for females in column (8) is one of the few significant RD estimates. In addition, meeting the implicit target for high ability students has a positive and significant impact on the probability of being bullied for males in column (13).
The estimates offer evidence of the effect of meeting a performance target in one test at Key Stage 2 on behaviour. However, they may be biased as only one out of the three measures of achievement in tests is considered in the RD regression in equation (3). The remaining two measures of achievement are not controlled for and may differ for students to the left or to the right of a threshold, e.g. in English, thus potentially leading to a spurious estimate of the effect of meeting a target. For example, the estimated effect of meeting the expected achievement level in the Maths test on the probability of a police warning for males equals 10% in column (12) in Table 8. Table 5 shows that this is equal to the mean probability of a police warning among males, thus casting doubts on the econometric specification that includes only one out of three measures of ability. In addition, evidence in Table 13 does not exclude that the research design exploiting thresholds in the tests by subject is invalid due to suspicious jumps in the density of test scores at the threshold. This is an empirical challenge as the test scores by subject offer three proxies for ability, students receive achievement levels separately by each test and they are intended to meet the expected target in each test.
4.2
Average test score
The fine grade average test score over all tests allows one to consider all three proxies for ability in the data. This is a more suitable proxy to study the overall effect of meeting tar-gets on behaviour. Estimates of differences in the mean probability of, for example absence, between students who score at the expected performance target 4 and students who score at the target 3 are not statistically different from zero as Table 10 shows. Such estimates are equal to the difference in the relevant histogram bars for the same variable in Figure 4. For example, estimates in column (3) in the table say that a student who scores at level 4 in Key Stage 2 tests is on average 7 percentage points less likely to be truant in the following one to two years with respect to a counterfactual student who scores at level 3. This is what one also obtains by eyeballing the difference in height of the histogram bar for unauthorised absence between achievement levels 4 and 3 in Figure 4. Such a difference is not statistically significant as the high p-value shows. Estimates for subsamples by gender are instead not statistically significant either, as columns (5)-(10) in Table 10 show.
However, Probit estimates of the effect on behaviour of an increase by one unit in test score may be spurious due to such confounders as the support that students get to prepare for tests by parents and teachers, as well as to develop a positive behaviour. The RD design instead allows one to disentangle at the discontinuity the direct effect of incentives that the expected targets induce on behaviour from the effect of confounders. The thresholds in the average fine grade test score, which is constructed by the Department for Education as an average of scores in tests in English, Maths and Science, are fuzzy because a student who fails to meet targets in at least one test can still meet the target on average. However, evidence in section
2.1 shows that this is empirically relevant for only about 1% of students. The challenge lies in interpreting the effect by considering the possible contributions to the observed students’ behaviour by students themselves, teachers and parents.
4.2.1 Full sample
Table 11 shows estimates of the effect of meeting performance targets equal to 3, 4 and 5 on behaviour for the full sample of students and for subsamples by gender. The bottom row in each panel in the table shows the number of observations in windows of size two around a target that I use to estimate the polynomials. For example, column (3) shows estimates using a threshold equal to 3 in the fine grade average score. If students score below or above it, they achieve level 2 or 3 in the fine grade average test score at Key Stage 2. Meeting this achievement level decreases the probability of being bullied by 15 percentage points or 34% with respect to the mean probability of being bullied that Table 2 shows, but the effect is only significant at 10% level. However, meeting the target has no effect on other measures of behaviour. Instead column (4) in the table shows that meeting the target 4 which the Department for Education expects students to meet at Key Stage 2 has mixed effects on dif-ferent behavioural outcomes but it is not statistically significant. Finally, meeting the target 5 for high ability students has a negative effect equal to 4 percentage points or 10% on the probability of being bullied but is only significant at the 10% level.
Overall, estimates in columns (2)-(4) in Table 11 show that few RD estimates are statisti-cally significant, thus suggesting that the impact of meeting targets in tests on behaviour is low.24 Insignificant but different from zero estimates may be economically significant but
also imprecise due to high standard errors. Standard significance tests may be unfit to do inference in a design with multiple discontinuities. For example, the precision of estimates for the threshold 3 along the running variable may be influenced by the observations that are close to the threshold equal to 4 and no guidance from theory has been so far provided to the best of my knowledge.25 In addition, the apparent effects of meeting performance targets
differ by ability group as, for example, the negative effect on the probability of being bullied is greater in absolute value at threshold 3 than at 5. Finally, Probit estimates are smaller than RD ones at low ability and at high ability threshold and estimates of the differences in the mean probability are greater than statistically significant RD estimates. This suggests that Probit estimates tend to underestimate the effect of performance targets on behaviour for students with different ability while difference in the mean probability of behaviour tend to overestimate the effect of significant estimates.
4.2.2 Subsample by gender
Columns (6)-(9) in Table 11 show estimates of the effect of meeting a performance target for the subsample of females. The effect is negative and significant on the probability of be-ing bullied at target 5 for high ability students and it is equal to 7 percentage points or 16%. Conversely, Probit estimates understate the effect for high ability students. Estimates of differ-ences in the mean probability of being bullied instead overstate these effects. Finally, meeting targets has either an insignificant effect on the probability of other behavioural outcomes or
24Estimates from parametric regressions have the same sign and similar precision to the non-parametric
ones in Table 11. Additional estimates on students’ self-reported behavioural outcomes about alcohol, smoking cannabis, vandalism and fights are available upon request.
25See Lee and Card (2008) for corrections in inference in a RD design with an integer-valued running
the point estimates exceed sample means in Table 2, thus suggesting a potential problem with the econometric specification or the sample size in the neighbourhood of a threshold. Columns (10)-(13) show estimates for the subsample of males. Probit estimates are negative and statis-tically significant. RD estimates instead show that meeting the expected performance target by the Department for Education for males has an insignificant effect on the probability of all behavioural outcomes, except that of a police warning which increases by 6 percentage points or 60% at the 10% significance level. Moreover, meeting the target 5 for high ability students has a negative and significant effect on the probability of unauthorised absence which is equal to 6 percentage points or 43%. In contrast, estimates of Probit regressions and differences in the mean probability of behavioural outcomes overstate the effect of meeting targets in test scores. These estimates give relevant information on the difference in the behavioural response to performance targets by gender that estimates obtained by using the full sample in columns (2)-(4) would hide. The probability of being bullied is responsive to meeting a performance target in tests only for females. Instead the probability of unauthorised absence and of a police warning, although significant at 10% level but not at 5%, are responsive to meeting the expected target only for males.
4.3
Robustness checks
I test empirically whether obtaining a test score to either side of a performance target offers a valid research design to identify the effect of meeting a target on a student’s behaviour with three robustness checks. The first one tests the identifying assumption that the design is as if it was locally randomised at the thresholds. The second one tests whether estimates are sensitive to the definition of the variables in the empirical analysis. The third one assesses potential actions by students, parents and schools after the test scores are disclosed as this may be helpful to interpret the estimates.
4.3.1 Pre-determined characteristics and gaming around a threshold
A RD design to study the effect of performance targets is similar to the assignment of students to either side in the neighbourhood of targets 3, 4 and 5 in a coin-flip experiment. The research design is valid if two assumptions hold empirically as Lee and Lemieux (2010) suggest. The first one is that the distribution of all pre-determined characteristics of students, such as gender, ethnicity and other variables proxying socio-economic background, is the same just to the left and to the right of a threshold of the fine grade average test score. This is because such variables are determined before the test scores are disclosed and a local randomisation at the threshold does not alter their distribution. A RD design is valid, for example, if the share of males who score just to the left of a threshold is not different from the share of males scoring just to the right of it. Otherwise, the effect on behaviour that one attributes to meeting a performance target may be confounded by the correlation between gender and performance in tests, which invalidates the randomised design around a threshold. I estimate in Table 12 smooth polynomials in the fine grade average test score of the pre-determined characteristics in column (1), separately for samples of students who score to the left or to the right of thresholds 3, 4 and 5. Insignificant estimates of regression discontinuity regressions of characteristics that are determined before tests at Key Stage 2 on the running variable at Key Stage 2 lead to no rejection of the null hypothesis of no significant difference in the value of pre-determined characteristics of students, thus supporting the validity of the design. The second assumption is the inability of students, parents, test markers or schools to perfectly manipulate test scores. This holds if before test scores are disclosed students, parents or
schools can at best imperfectly guess whether they have scored to the left or right of a target in any subject or manipulate it. Marking of test scripts by external examiners rather than by students’ teachers ensures local randomisation of test scores in the neighbourhood of a threshold.26 I test empirically the absence of manipulation in test scores by plotting an
undersmoothed histogram of the fine grade average test score in Figure 1. I use a binwidth equal to 0.025 to obtain histogram bins such that they contain an arbitrarily small number of students separately to the left and right of a threshold and no bin contains the threshold value. Visual inspection of such bins suggests no suspicious jumps in the empirical density around thresholds. Moreover, McCrary (2008) developed a formal test of the null hypothesis of no manipulation. This is not rejected if the difference in the height of the undersmoothed histogram bins to the left and to the right of a threshold is sufficiently small. The rows in Table 13 shows t-statistics of t-tests in McCrary (2008) at each threshold in test scores for the fine grade test scores in each subject and for the average score. The top three rows in the table show t-statistics of scores in each compulsory subject test: English, Maths and Science. The t-statistics are greater than 2 in all cases and often by a large margin, thus implying the rejection of the null of no manipulation in subject tests. However manipulation is not statistically significant when the fine grade test scores are averaged, as the bottom row in the table shows. This is because manipulation of the running variable is imperfect by design with different external examiners that mark tests in different subject tests for each student. For example, one examiner may attempt to manipulate the score in English tests in one school although he does not know the students. However, such manipulation attempt may cancel out or be reversed when averaging test scores in English, Maths and Science to compute the fine grade average test score.
4.4
Definition of the running variable and the thresholds
The research design is valid if the estimates are not sensitive to changes in the characteristics that contribute to define the fine grade average test score, which is the running variable in the research design. Similarly, meeting falsified performance targets, rather than the ones that the Department for Education sets, should have no effect on behaviour.27
Firstly, I estimate the effect on behaviour of meeting a threshold ¯T by using a window that is centered at ¯T and contains observations in a different interval than [ ¯T −1,T¯+ 1] in the preferred specification that I use to estimate the smooth polynomials. Table 14 shows that estimates which I obtain for each target by altering the size of the window of observations, e.g. a window of size 2.05-3.95 in column (3) versus one of size 2-4 in the preferred specification in column (2), are similar to those in the preferred specification in columns (2), (6) and (10). Secondly, I estimate the effect of meeting a performance target on the probability of suspension from school and on police warning by using subsamples of observations which vary by the date in which the survey data were collected. This is to test the sensitivity of estimates to potential reverse causality because the time window for survey questions on police warnings and suspension from school is up to three years before the interview date. It is the period April 2001 to October 2004 while tests scores are disclosed in July 2001 and a police visit, for example, in May 2001 occurs before Key Stage 2 tests. I create the subsamples by only
26See as examples of potential gaming around threshold Jacob and Lefgren (2004) that study the effect
of remediation courses on test scores in schools in the USA and Urquiola and Verhoogen (2009) that study the effect of class size on test scores in schools in Chile. In both examples gaming is induced by unintended responses of teachers to incentives that are embedded in the institutional setting.
27I show estimates that I obtain by using the full sample of observations but similar ones hold for estimates
considering survey dates from a certain month, e.g. July, onwards. Estimates in Table 15 do not reverse the sign or significance level with respect to those in the preferred specification at the top of each panel in the table. This evidence supports the research design.
Finally, I test with a falsification exercise whether thresholds 3, 4 and 5 in the fine grade average test score are the only relevant ones to students, parents or schools and no other threshold such as 3.4 or 3.5 is. Table 16 shows in column (14) that, for example, the effect of meeting the target 5 is significant on the probability of being bullied in the preferred specification, while it is not for falsified targets such as 4.5 or 5.1 in the neighbourhood of 5. Very few significant estimates, and at 10% significance level for decimal thresholds greater than thresholds 4 and 5, support the validity of the research design.28
4.5
Actions by students, parents and schools after the disclosure
of tests results
Behavioural outcomes by students are observed one to three years after the disclosure of results in tests at Key Stage 2. In this section I test two assumptions about the behaviour of parents and schools after tests results are disclosed.
The first assumption is that missingness in the answers by main parents to survey questions is at random in a small neighbourhood around a threshold. It holds, for example, if parents in poor households feel as comfortable to disclose certain information as those in rich households do. To test this, I estimate polynomials in test scores of binary variables equal to one in the event of item non-response by a main parent and zero otherwise. I obtain estimates separately for students who are to the left and right of a threshold and I assess the significance of the difference in the value of the polynomials at the threshold. Similarly, the assumption holds if the choice by students and parents of a certain type of secondary school, e.g. Voluntary Aided, is arguably random in a small neighbourhood around a threshold. Table 17 shows insignificant estimates of regression discontinuity regressions of dummies for non-response,in the top panel in the table, and for secondary school types, in the bottom panel, on the running variable at Key Stage 2, thus leading to no rejection of the null hypothesis of no difference around a threshold. This excludes selective non-response about students’ behaviour and differential responses by type of school as possible interpretations of the estimates.
The second assumption is that the behaviour of students after the test results are disclosed does not vary with characteristics of parents and schools that, however, were not different at either side of the threshold in test scores, as section 4.3.1 shows. Potential intervention by parents with different characteristics, such as their education level, is informative to interpret the estimates of the effect of meeting performance targets on behaviour. This may occur, for example, if students in a small neighbourhood to the left of the threshold are persuaded by parents and teachers that they missed a target due to bad luck and may, as a consequence, behave more similarly to students who met the target than they would, had they not learnt this. I test whether parents who completed compulsory education or have a higher education level may react more or less about their children’s potential behavioural response to test scores than parents who did not complete compulsory education. Table 18 shows estimates of the effect of meeting performance targets on behaviour for the full sample of students in columns (2)-(4) and separately for subsamples of students whose main parent did or did not complete at least compulsory education in columns (5)-(7) and columns (8)-(10). The magnitude of
28Certain estimates are significantly different from zero for decimal thresholds smaller than 4 although
their magnitude is greater than means in summary statistics. This suggests future work to study whether the intuition of the choice rule to compute the optimal bandwidth of the polynomial in Imbens and Kalyanaraman (2009) holds in a design with multiple thresholds along the running variable.
the effects on all outcomes tends to be greater for students whose parents did not complete compulsory education than for students whose parents did. For example, the estimates of the effect of meeting any performance target on the probability of being bullied are twice to ten times greater for students whose parents did not complete compulsory education.
5
Discussion
In this paper I assess whether meeting absolute performance targets in tests at school has an effect on subsequent behaviour by students. In the empirical analysis, proxies for the behaviour of students in compulsory education in state schools in England include unautho-rised absence from school and police warnings to parents about a student’s behaviour. Simple Probit regressions show that the apparent effect of an increase in test scores decreases the probability of absence from school or of a police warning. However, if such regressions are misspecified due to unobservables that are correlated with test scores, the estimates are biased and may lead to inaccurate policy decisions. By teasing out the effect of confounders, such as parents’ education, with a regression discontinuity design that thresholds in test scores offer, I find instead that meeting the performance target that the Department for Education expects students to meet at age 11 has an insignificant effect on their behavioural outcomes. However, I also find a negative and significant effect of meeting lower and higher implicit performance targets on the probability of being bullied for low and high ability students.
The effect of meeting the expected target on any proxy for behaviour is negative but not significant for subsamples by gender, while meeting targets for low and high ability females decreases the probability of being bullied, and meeting the target for high ability males also decreases the probability of unauthorised absence. Finally, the effect varies by parents’ educa-tion, with significant estimates for high ability students whose parents have a low qualification or none. Probit regressions tend to underestimate the effect of implicit targets for low and high ability students as a Probit specification overlooks the institutional setting of targets in test scores. Similarly, estimates of differences in the mean probability of behaviour, separately for students to the left and right of a target, tend to overestimate the effect as they cannot tease out the effect on outcomes of unobservable characteristics that correlate with test scores. Several reason may help to explain why the effect of the expected target on students’ be-haviour is not statistically insignificant. Firstly, if the Department for Education sets targets for students and schools that are not considered relevant, this leads to no behavioural response by students who may ignore their performance with respect to the target and by schools that may focus on other measures of students’ achievement. Secondly, parents and teachers may persuade students who have just missed a target that they are similar to those who met it, thus attenuating the behavioural response by students. This is because students’ behaviour is observed after information on whether students met performance targets is disclosed to students and parents. Evidence about discontinuities at the expected achievement target does not rule out empirically these as possible mechanisms linking achievement in test scores and behaviour. Finally, the number of observations in a small neighbourhood of each of the three performance targets in the empirical analysis varies from approximately 400 to 3,000, which may influence the precision of the RD estimates.
Estimates that are obtained by using subsamples by gender and parents’ education level show negative and significant effects, at 10% and 5% level, of meeting performance targets on the probability of being bullied and of police warning. However, the lack of empirical relevance of meeting targets in achievement on such outcomes as suspension and expulsion from school as well as a police warning is reassuring for policy-makers as explicit and implicit performance
targets for students and teachers suggest no major behavioural implication that would require an intervention by schools or the government. What it may suggest instead is caution in the use of certain survey information. Parents may have over-reported about whether their children were bullied in the light of the high incidence of bullying at 46% in the summary statistics. This variable may in fact capture a latent attitude for socialising by students, as well as parents’ expectations about the behaviour of the children. In addition, a positive but marginally significant effect of the expected target on a police warning only for males may help parents and schools to study its determinants inside the school and outside, which they may have not learnt about this from estimates using the full sample. Heterogeneous effects by main parent’s education level with lower behavioural responses to performance targets by children of more literate parents offer some empirical support for a tradeoff between nature and nurture in students’ development as Lizzeri and Siniscalchi (2008) and the literature on economics, genetics and sociology also suggest. Moreover, effects vary by the type of control which a parent has over a student’s behavioural outcome. Parents have more control over such activities as absence from school than over bullying, which offers additional support to this tradeoff.
The regression discontinuity design also suggests that using a categorical measurement of per-formance to assess whether students meet perper-formance targets in tests offers policy makers a test to empirically assess behavioural effects of targets in test score in the future and, hence, to inform policy. Reassuringly, the empirical evidence shows that performance targets tend to have an insignificant effect on behaviour, thus suggesting no unintended effects on students. Additional knowledge on the impact of incentives on over-motivation or under-motivation in individuals would be useful to inform future policy in education and beyond, and also recon-cile the contrasting results on incentives and motivation in Economics and Psychology that Benabou and Tirole (2002, 2003) survey. Future research will focus on the role of performance targets in education by assessing whether they have an effect on students’ achievement and behaviour in secondary school and beyond.