FACILITY MANAGEMENT TOOL
Installation & Operation Manual
WARRANTY INFORMATION
The essential purpose of any sale or contract for sale of any of the products listed in the POTTER catalog or price list is the furnishing of that product. It is expressly understood that in furnishing said product, POTTER does not agree to insure the Purchaser against any losses the Purchaser may incur, even if resulting from the malfunction of said product.
POTTER warrants that the equipment herein shall conform to said descriptions as to all affirmation of fact and shall be free from defects of manufacture, labeling and packaging for a period of one (1) or five (5) year(s), depending on the product, from the invoice date to the original purchaser, provided that representative samples are returned to POTTER for inspection. The product warranty period is stated on the exterior of the product package. Upon a determination by POTTER that a product is not as warranted, POTTER shall, at its exclusive option, replace or repair said defective product or parts thereof at its own expense except that Purchaser shall pay all shipping, insurance and similar charges incurred in connection with the replacement of the defective product or parts thereof. This Warranty is void in the case of abuse, misuse, abnormal usage, faulty installation or repair by unauthorized persons, or if for any other reason POTTER determines that said product is not operating properly as a result of causes other than defective manufacture, labeling or packaging.
The Aforesaid Warranty Is Expressly Made In Lieu Of Any Other Warranties, Expressed Or Implied, It Being Understood That All Such Other Warranties, Expressed Or Implied, Including The Warranties Of Merchantability And Fitness For Particular Purpose Are Hereby Expressly Excluded. In No Event Shall Potter Be Liable To Purchaser For Any Direct, Collateral, Incidental Or Consequential Damages In
Connection With Purchaser’s Use Of Any Of The Products Listed Herein, Or For Any Other Cause Whatsoever Relating To The Said Products. Neither Potter Nor Its Representatives Shall Be Liable To The Purchaser Or Anyone Else For Any Liability, Claim, Loss, Damage Or Expense Of Any Kind, Or Direct Collateral, Incidental Or Consequential Damages Relative To Or Arising From Or Caused Directly Or Indirectly By Said
Products Or The Use Thereof Or Any Deficiency, Defect Or Inadequacy Of The Said Products. It Is Expressly
Agreed That Purchaser’s Exclusive Remedy For Any Cause Of Action Relating To The Purchase And/or Use Of Any Of The Products Listed Herein From Potter Shall Be For Damages, And Potter's Liability For Any And All Losses Or Damages Resulting From Any Cause Whatsoever, Including Negligence, Or Other Fault, Shall In No Event Exceed The Purchase Price Of The Product In Respect To Which The Claim Is Made, Or At The Election Of Potter, The Restoration Or Replacement Or Repair Of Such Product.
Table of Contents
Section 1: Introduction ... 1-1
How to Use the Manual ...1-1
Section 2: Panel Setup ... 2-2
Panel Network Settings ...2-2
User Codes Setup ...2-3
Panel Setup Recap ...2-5
Section 3: Installing & Setting up Facility Management Tool ... 3-6
Installing & Accessing FMT Software...3-6
Adding & Connecting Panels ...3-7
Adding Panels ...3-7
Connecting Panels ...3-9
Disconnecting Panels ...3-10
Software Installation & Setup Recap ...3-11
Section 4: Operating in Facility Management ... 4-12
Events & Installed Panels Window Panes ...4-12
Event Fields (Columns) ...4-14
Reviewing Event Data: Sorting, Filtering & Grouping ...4-15
Sorting ...4-16
Filtering ...4-17
Grouping ...4-19
Viewing Events Using the Keypad Option ...4-21
Operating Recap – Part 1: Events Window Overview / Sorting, Filtering & Grouping Events ....4-23
Printing Event Logs ...4-24
Exporting Events to Excel / Word ...4-25
Saving Events to Logs ...4-26
Adding Notes to User-Created Logs ...4-27
Deleting Events ...4-28
Clear All Events ...4-28
Refresh All Panels ...4-28
Deleting Saved Logs ...4-28
Exiting FMT ...4-28
Operating Recap – Part 2: Saving & Printing Event Logs ...4-29
Section 1: Introduction
The Facility Management Tool is a software program that is compatible with all Potter PFC-6000 series and P-Plus fire panels.
The Facility Management Tool displays “real-time” events that occur on one or more panels connected to the same network. This optional software is made available as a convenience to all Network or Security Administrators so they may more effectively manage their panels.
The Facility Management Tool (also referred to as "FMT") allows either a single user or multiple users to view all networked panels from a PC running the FMT software. The single user may be connected to a panel through a dedicated, supervised Facility Management Tool IP port. This enables the user to know immediately when a panel looses connectivity or goes into "Trouble." Please refer to “User Codes Setup” heading for details on configuring a single and/or multiple user(s).
The FMT offers great flexibility in how event information may be used to efficiently organize, manage and analyze panel performance. For example, event history for a specific panel may be exported into either a Word or Excel document to help pinpoint errors by date/time or event type. Event history may also be sorted by specific event types (i.e., all “Troubles”) and then grouped by individual panel. Lastly, event logs may be printed and/or emailed to the Network Administrator or Authority Having
Jurisdiction providing the documentation needed to comply with fire safety requirements or record keeping practices.
How to Use the Manual
The information provided in this manual is intended to assist you in understanding how to properly setup each panel, install the FMT software and productively use the functions and options available. Procedures and examples are presented in a format to
help you quickly and efficiently use the FMT; and at the end of each section, you'll find a recap providing a condensed version of
Section 2: Panel Setup
This section covers the required steps to set up each panel you wish to manage through the FMT software. These steps should be completed before installing and accessing FMT, otherwise, you will not be able to review event history or connect to any of the networked panels.
Here’s a quick synopsis of the required steps:
1. Verify and document panel’s IP address or panel’s serial/NetBIOS name. 2. Verify and document the Network LAN port # (the default port # is "32000").
3. Create one or more user codes with “Review History” access,andchoose a "PC Connect" option for each user code.
Panel Network Settings
The panel’s IP/URI name and PC Connect Port # can be verified through the FACP’s software by accessing the “Panel Network Settings” window. The panel's NetBIOS or serial number can be found on the fire panel's board. Please refer to the illustrations
shown in this section to learn more about this process. Figure 1. Example of the "Panel Network Settings" Window
The FACP software automatically assigns the "PC Connect Port" number as “32000” for each panel. It’s good practice, though, to verify the port number, otherwise, you won’t be able to connect the panel within the Facility Management Tool if the port
number doesn't match. Never change the port number in "Network Settings" unless instructed by your Network Administrator.
The Panel’s IP address displays in
one of these 2 fields as set by your
Network Administrator: 1) "Use DHCP" or 2) "Use Static IP"
Note: Make a note of the IP address to enter into the FMT.
The PC Connect port default # is “32000”.
Note: If port # is different than default,
do not change. Make a note of port # to
The panel’s NetBIOS name (or “serial number”) may alternatively be used to setup the network settings in the FMT. The panel’s name is structured as “PFC6xxxxxxxx” (where “xxxxxxx“ represents the actual panel name, i.e., PFC607500000). The NetBIOS/serial # is shown on the “bar code” label located on the fire panel board, as illustrated below:
Figure 2. Example of Locating a Panel's NetBIOS Serial Number
User Codes Setup
The next step in setting up the panel is to create one or more User Codes specific for use with the FMT. User Codes are created through the FACP’s software by accessing the “Users" menu option. Each User Code must be given "Review History" access,
and a method to connect to each panel from a PC. The process for creating user codes and examples of each PC connection option are described here.
To create user codes:
1. Click on the "Users" menu option. The User’s Code window displays. Figure 3. Examples of "Users" Menu Option and User Code Window Panel Serial Number
DWG #602-3B
Notice that all fields except
"Review History" and a "PC Connect" option are disabled.
5. Click in one of the "PC Connect" fields as described below:
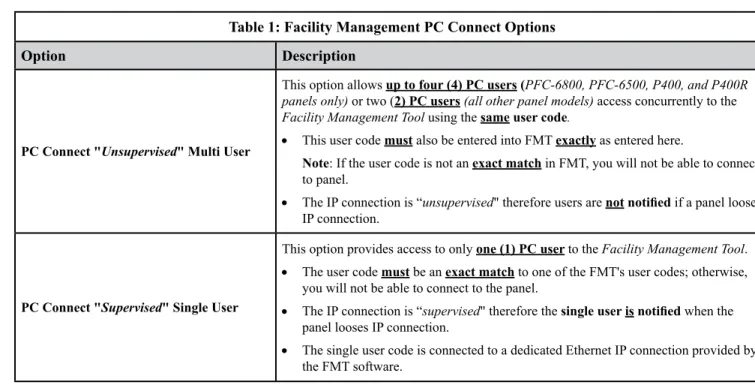
Table 1: Facility Management PC Connect Options
Option Description
PC Connect "Unsupervised" Multi User
This option allows up to four (4) PC users (PFC-6800, PFC-6500, P400, and P400R panels only)or two (2) PC users (all other panel models)access concurrently to the
Facility Management Tool using the sameuser code.
• This user code must also be entered into FMT exactly as entered here.
Note: If the user code is not an exact match in FMT, you will not be able to connect to panel.
• The IP connection is “unsupervised" therefore users are notnotified if a panel looses IP connection.
PC Connect "Supervised" Single User
This option provides access to only one (1) PC user to the Facility Management Tool. • The user code must be an exact match to one of the FMT's user codes; otherwise,
you will not be able to connect to the panel.
• The IP connection is “supervised" therefore the single user is notified when the panel looses IP connection.
• The single user code is connected to a dedicated Ethernet IP connection provided by the FMT software.
1. Verify "Network IP address."
• From the FACP's Menu, select “LAN Settings.”
• Make a note of IP address as shown in the "DHCP" or "Static IP" field.
Note: You may alternatively use the panel's "NetBIOS/serial #." Refer to " Panel Network Settings" discussed earlier in this section.
2. Verify "PC Connect Port number".
• From the FACP’s“LAN Settings" window refer to the "PC Connect Port" field.
• Make note of Port #.
3. Create one or more "User Name(s) & Code(s)."
• From the FACP’s Menu, select “Users."
• Enter a unique user name and code.
• Make a note of each user name and code.
• Select "Review History" and one of the "PC connect" options.
Panel Setup Recap
• Verify and document each panel’s Network IP address or NetBIOS name. • Verify and document each panel's Network LAN port number.
Section 3: Installing & Setting up Facility Management Tool
This section covers the process of installing and setting up FMT. The software can be easily and efficiently installed through Potter's website via a download link. Once the FMT application is installed, you must add and connect each panel you want to
monitor and manage.
Installing & Accessing FMT Software
To install the FMT software:
y Access Potter's website at www.pottersignal.com.
y Move or hover mouse over the "Fire Alarm Systems" menu option, then click "Tools & Resources."
y Click on the "Fire Panel Configuration Software" iconto select and download the "Facility Management Tool." y Follow prompts to download software to the default directory: C:\Program Files\Potter\Potter Facility Management.
TIP: Create a "Facility Management" shortcut on your PC's Desktop to simplify accessing the program.
To access the FMT application:
• Open the C:\ProgramFiles\Potter\Potter Facility Management directory (or double click the "FMT" shortcut if created). • Double click on the "PFPFacility" application file, as shown below:
The Facility Management Tool's window displays as follows: Figure 4. Example of Facility Management Tool Main Window
• Close the C:\ProgramFiles\Potter\Potter Facility Management directory window.
There are two panes displayed as shown: Installed Panels & Events
Adding & Connecting Panels
Once the Facility Management Tool software has been installed, and the program opened, each panel must be added and connected in order to display any event information. At times, you may want to disconnect one or more panels temporarily from FMT. This process is also addressed in this section.
TIP: You'll need to know each panel's IP/NetBIOS name, Port #, and User Code(s) to complete these steps!
Adding Panels
Follow the steps shown below to add one or more panels connected to the same network.
To add a panel:
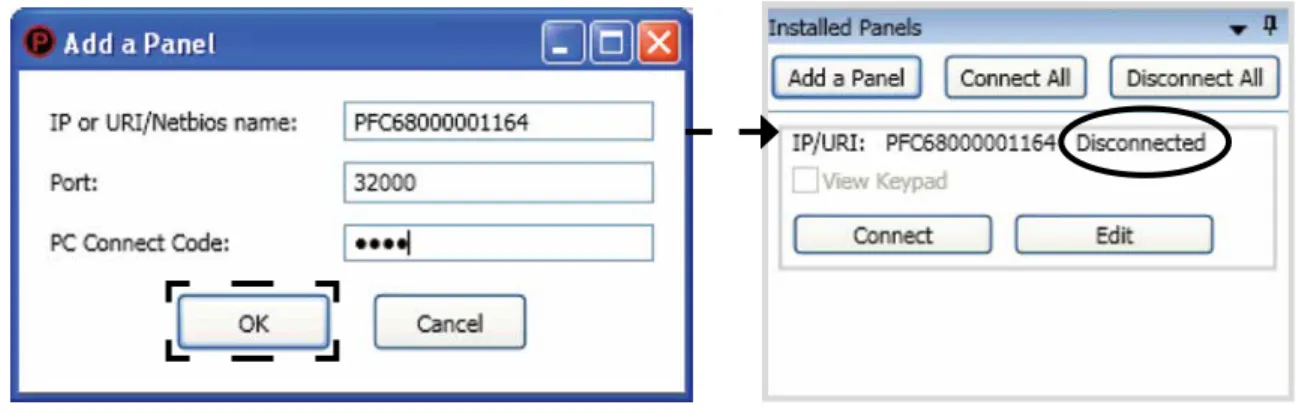
• From "FMT–Installed Panels," click the "Add a Panel"button. The "Add a Panel" dialog box displays. Figure 5. Example of Adding a Panel & "Add a Panel" Dialog Box
• Enter the panel’s "IP or URI/NetBIOS name."(Refer to either "Panel Network Settings" or "Panel Setup Recap" in Section 2 for instructions on locating this information.)
Note: If the IP / URI NetBIOS name is incorrect, you will not be able to connect! You will receive a"Cannot Connect" error message once you press OK.
• Enter the panel's "Port Number," typically 32000, for all panels.
Note: If the Port # is incorrect, you will not be able to connect!
• Enter the "PC Connect Code" or "User Code" as referenced in the FACP software. (Refer to either "User Codes Setup" or "Panel Setup Recap" in Section 2 for details on this step.
Notes:
1. The PC Connect/User Code is encrypted which prevents others from seeing the actual code being entered.
• Click OK. The added panel displays in the "Installed Panels" window pane.
Figure 6. Example of "Add a Panel" Window & Panel Shown as Installed
Notes:
1. The panel's status currently shows as "Disconnected," which is correct status.
2. If an incorrect user code is entered or is not correctly setup in the FACP panel, an error message displays. Figure 7. Example of "Login Failed" Error Message
3. If an incorrect panel IP/URI address name is entered, an error message will not display until you attempt to "Connect"
to the panel (refer to "Connecting Panels" for more information.) 4. If an incorrect port # is entered, an error message displays.
Figure 8. Example of Error Message Caused By Incorrect Port #
5. If any error message displays, use the EDIT button to change or verify the information. Make any necessary changes or it may be necessary to access the FACP software "LAN Settings – Panel Network Settings" or "Users" menu, then proceed to next step.
• Repeat steps to continue adding other panels or proceed to "Connecting" the panel(s).
Use the EDIT button to verify panel information!
Connecting Panels
Once one or more panels have been successfully added, "Connect" each one individually or all at the same time using either the
"Connect" or "Connect All" buttons.
To connect to a single panel:
• Click the "Connect" button located in the "Installed Panels" window pane beneath the applicable panel. Figure 9. Example of Panel Added & Ready to Connect
• The panel's status changes to "Connected" if connection is successful. Figure 10. Example of "Connected" Panel
Notes:
1. If the panel does not successfully connect, an applicable error message displays.
2. If the error message "No such host" displays, the IP/URI name may be incorrect or the Ethernet IP connection may not be available. Check the Ethernet IP connection.
To connect all panels:
• Click the "Connect All" button located at the top of the "Installed Panels" window pane. Figure 12. Example of Connecting All Panels & Panels' Status Shown Connected
• All panels' statuses change to "Connected" if successful.
Note: If a panel does not connect, refer to "Error messages" shown earlier in this section to review possible causes for errors.
Click on the applicable panel's"Edit" button to review and modify incorrect information, if necessary.
Disconnecting Panels
You have the option to disconnect one or all networked panels when needed. One example for disconnecting a panel would be to perform routine maintenance or to conduct a smoke test on SLC devices.
Note: If panels are connected when you choose to exit FMT (File – Exit menu option), a prompt displays querying if you
want to disconnect all panels. It's recommended that you choose "YES" to disconnect all panels.
To disconnect one panel:
• Click the "Disconnect" button beneath the applicable panel name. Figure 13. Example of Disconnecting a Single Panel
• Panel's status shows as "Disconnected." To disconnect ALL panels:
• Click the "Disconnect All" button shown at the top of the "Installed Panels" window pane.
1. Installing & Accessing FMT Software.
• Go to Potter's website - www.pottersignal.com
• Choose "Fire Alarm Systems" menu option, and "Tools & Resources"
• Click "Fire Panel Configuration Software," then "Facility Management Tool"
• Follow prompts to download software into default directory – C:\Program Files\Potter Facility Management
• Open the C:\Program Files\Potter Facility Management directory
• Double click on PFPFacility file icon to access program
2. Adding Panels.
• Click "Add a Panel" button (located in "Installed Panels" window pane) • Enter IP of URI/Netbios name, Port #, and PC Connect Code
• Click OK button.
3. Connecting Panels.
• To connect onepanel, click the "Connect" button locatedbeneath the applicable panel.
• To connect allpanels simultaneously, click the "Connect All" button located at the top of the "Installed Panels"
window pane.
4. Correcting Panel Errors.
• If a panel cannot connect, use the Edit button located beneath the applicable panel to verify the following:
IP or URI/Netbios name; Port #; and PC Connect Code (or User Code).
• If a panel cannot connect for a single supervised user, verify that the Ethernet IP connection is secure.
• If a panel cannot connect, refer to the "Panel Setup Recap" section for instructions on checking Network IP address, port # and user codes setup.
TIP: If a panel still cannot connect after all information has been verified in the Edit dialog box, you may Delete the
Software Installation & Setup Recap
• Install FMT.
• Add each panel you want to view & manage through FMT.
• FACP & FMT Software User Codes must be exact match! • Connect one or more panels.
• Edit panel setup or delete panel. • Disconnect one or more panels.
Same as User Code! Usually port #32000! Check FACP – LAN Settings!
Section 4: Operating in Facility Management
This section covers all functionality and options available within the FMT program. You'll learn how to change the format or
layout of event information, as well as limit the amount of data you view or output to a log from the "Events" window pane.
Events may also be viewed "live" as they display on a panel's keypad by using the "View Keypad" option.
Note: All information is "read only", which prevents any changes being made to the connected panels' operations or
programming.
Some of the topics addressed in this section are:
• Overview of Events Window Pane • Field / Column Headings
• Adjusting Window Panes
• Sorting, Filtering & Grouping Events • Resetting Window Layout
• Displaying Panels' Keypads
• Creating & Printing Logs
• Exporting Events to Excel & Word Documents • Clearing & Refreshing Events
• Adding Notes to Logs • Logging On/Off Buttons • Exiting FMT
Events & Installed Panels Window Panes
Once panels have been installed and added to FMT, the "Events" window pane displays a "Master" Events log. The Events log
lists all event history that have occurred on the connected panels. Event history remains in the "Events" log until you choose to
"Clear All Events" or selectively delete specific events. Refer to the example shown below:
Click to list all opened logs, if any.
This is the "master" Events log.
The "Installed Panels" window pane may be moved, resized or temporarily hidden, if needed, to provide more space for the
Events pane. It is automatically "docked" or locked in position.
To change the "Installed Panels" window position use one of the following two methods:
1. Click the "Window Position" icon, located in the upper right corner of the pane, then click on one of the options, as shown here:
• Dockable is the default "locked" window position.
• Floating will let you move the pane anywhere on the screen. If you want to change position again, right click from the
"Installed Panels" window title bar and select a different option. • Tabbed Document will display the pane in a tabbed format.
• Auto Hide temporarily hides the pane; hover the mouse over the "Installed Panels" tab (located on the far left) to redisplay the pane. Move the mouse away from pane window to hide.
TIP: You may also click the "Auto Hide" icon, located next to the "Window Position" icon. Notice that the icon changes to " "; click to unhide and dock window.
• Hide completely closes the pane. Use the "Window - Restore Window Layout" menu option to redisplay the "hidden" window pane.
2. Move the mouse to right border of pane until cursor shape changes to " " (double-headed arrow), then drag to increase/ decrease width of pane.
Click a different option to change position. "Dockable" is the default
Event Fields (Columns)
The FMT software organizes and displays events in date/time order by fields or columns (refer to the "Events" window pane
example shown below). This format provides a quick snapshot of all events to help you monitor one or more networked panels. Events are color coded based on their event type or classification. For example, "Trouble” events display in “yellow”, "Restore" in "green", and “Alarms” in “red."
Figure 15. Example of Events Window Pane Fields
Please refer to the table below for field descriptions and an explanation of event types:
Table 2: FMT Event Fields
Fields Description
Event # Displays in first field; the number is assigned automatically based on the date/time of event.
Panel's Name Displays panel's descriptive name as configured through the "FACP menu - General Options."
Date/Time Displays the date/time stamp the event occurred.
Event Description Displays more detail about event, such as the device's SLC number, user name, etc.
Event Type
Displays the type of event (or classification) as follows:
• Trouble – These events correlate to FACP Trouble conditions; display highlighted in "yellow." • Supervisory – These events correlate to FACP Supervisory conditions; display highlighted in "yellow." • Alarm – These events correlate to FACP Alarms; display highlighted in "red."
• Restore – These events display when FACP loses Ethernet connection and also after connection is restored.; display highlighted in "green."
• Info – This event category represents a variety of panel status information. It includes any condition or activity that does not affect panel's operation or performance. These events are not highlighted in a color.
Reviewing Event Data: Sorting, Filtering & Grouping
The Sort, Filter and Group functions allow you to reorganize or limit event information that is displayed. These functions can be used independently or in combination depending upon the amount of information you want to analyze or monitor. After using one of or more of these functions, you may choose to save the results to an Excel/Word document, output it to a printer, or save it to a new log. Each of these processes are addressed in this section.
Note: Use the "Window–Reset Window Layout" menu option to redisplay the event information to its original layout. Please refer to the table below for a summary of the Sort, Filter and Group functions.
Table 3: Methods to Organize Event Data
Option Description
Sorting
Reorders all event data alphabetically or numerically based on a selected field, i.e., Panel, Date/Time or Event Type, in ascending/descending order.
Example: If you want to list events alphabetically in ascending (A-Z) order by Panel name, you would
click once on the "Panel" field name. Click again to change to descending (Z-A) order.
Filtering
Limits the amount of data displayed based on selection criteria, i.e., display only "Trouble" events or those events that occurred on a specific date. Data that doesn't match the selection criteria does not display.
Examples:
1. If you want to view only "Trouble" events that occurred on all panels, you would click the "Event
Type" filter icon, and then select "Trouble" from the list of options.
2. If you want to list only events that occurred on a specific date or time, click on the "Date/Time"
filter icon, and then select the specific date/time from the list of options.
Grouping
Limits and changes layout or order of fields. Displays only the fields and associated data selected by the user; all other data is temporarily "hidden."
Note: When you drop fields into the "Group by Area" region, be aware that the order of the fields (i.e., "Panel" followed by "Event Type" vs. "Event Type" followed by "Panel") determines the way information is grouped.
Examples:
1. In this scenario, you may want to view all events grouped by each Panel name. To do this, drag and drop the "Panel" field into the "Group by Area" region. Notice that the information is grouped beneath each applicable panel represented by the "expand" icon (displayed to the far left of each grouped panel).
2. If you want to view all events based on event type that occurred on eachPanel, drag both the
"Panel" and "Event Type" fields into the "Group by Area." The difference between this scenario
and the first one is that each specific type of event (Troubles, Restores, Info., etc.) are grouped on separate lines by their respective panel.
Sorting
Sorting events allows you to quickly reorder all events by any field. For example, you may want to display events alphabetically
by "Event Description" or "Event Type." To sort events:
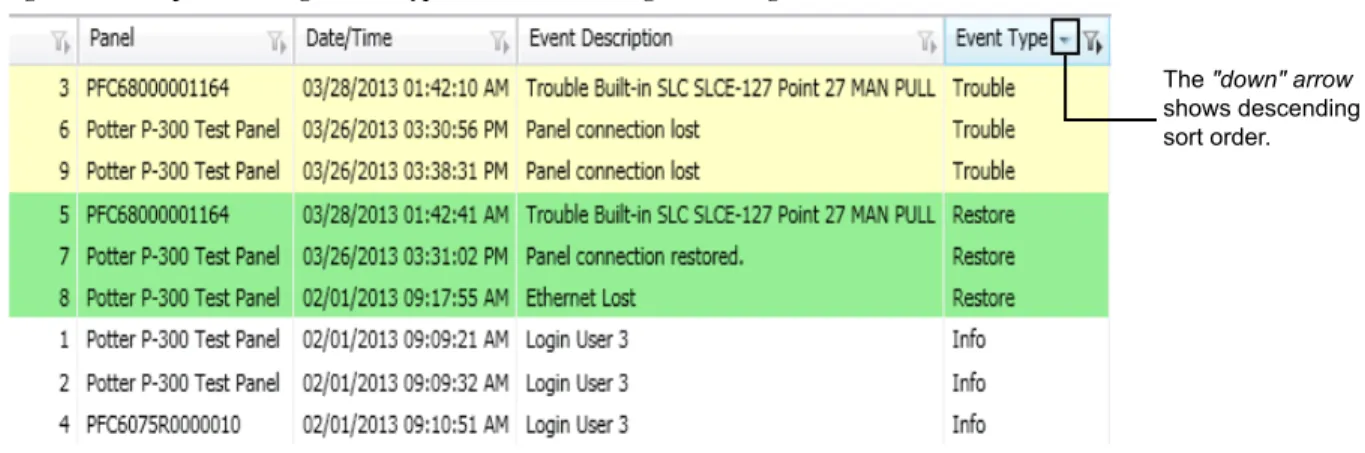
• Point to the field heading you wish to sort by, and then click. Figure 16. Example of Sorting by "Event Type" Field
Notes:
1. All events are reordered alphabetically by that field.
2. The "up/down arrow" shown in the field heading reflects the sort order, i.e., ascending (up) / descending (down). • Click again on the same field heading to reverse alphabetical order, if needed.
Figure 17. Example of Sorting "Event Type" Field in Ascending/Descending Order
Notes:
1. At any time, click the Window – Reset Window Layout menu option toreturn event information to its original order!
2. Refer to the headings "Creating a New Log" and "Saving to Excel/Word Document" located later in manual to permanently save the sort results.
The "up" arrow indicates
field is sorted in ascending
order.
The "down" arrow
shows descending sort order. Click in any field heading
Filtering
The "Filter"option (represented by a " " symbol in field headings) allows you to narrow or limit the amount of data that displays based on any field. For example, you may want to display only "Trouble" or "Info" events. If filtered by "Trouble" event types, then all other type of events are temporarily hidden. This option is particularly useful if you're monitoring a large volume
of events. To filter events:
• Click the "Filter" icon in the applicable field heading to filter events.
Figure 18. Example of Filtering Events by "Panel" Name
• From the "Filter" dialog box, use one of the two methods to select or indicate what text you want to filter by:
– Click in the "Select All" text box to deselect all listed, then click in textselection box(es) to select specific text, or
– Enter specific filter text in the "Text Filters" field.
Click on"Filter" icon to display "Text Filters" dialog box.
Enter filter text here...or
Click here to deselect "all", then select specific filter
• If you deselect "Select All," the "check mark" is removed; then select one or more text options, as needed. Figure 19. Examples of Filtering Events by "Selecting" a Text Option
• If you use the "Text Filters" field to filter events, type in the first few characters of the text until it's selected in the list,
as shown below.
Figure 20. Example of Filtering Events Using "Text Filter" Field
• Click OK to display events based on filter text or selected text.
Figure 21. Example of Filtering Events by "Panel" Name (filtered by P-300 only in this example)
Notes:
1. Click the Window – Reset Window Layout menu option toreturn event information to its original order!
2. Refer to the headings "Creating a New Log" and "Saving to Excel/Word Document" located later in this section
to permanently save the filter results.
Click here to remove or add "checkmark."
Click one or more
text options you wish to filter by.
Enter text here to filter by text entered.
Grouping
Grouping information is another method to change the way information is presented. The "Group by Area" option allows you to temporarily "hide" field information so you can focus specifically on the most important data. This option is particularly useful
when managing many panels across a network.
Note: When you group event information, keep in mind that the "hidden" information isn't deleted or removed. It's simply
hidden until you ungroup it or choose the "Window–Reset Window Layout" menu option. To group data:
• Point or hover mouse over “group bar” and click when cursor shape changes to a "pointing hand." The "Group by Area"
region displays, as shown below.
Figure 22. Example of "Group by Area" Bar Location & Shown Open
Note: Click on “group by area" bar at any time to close region.
• Drag and drop a field heading (i.e., Panel, Date/Time, etc.) into the “group by area” region. All information displays grouped
based on the selected field.
Figure 23. Example of Events Grouped by "Panel"
The "Group by area" bar is shown here! – Click to open – Click to close
Click "+" to expand item(s).
Drag field heading
3. If needed, save the results to a new log file, export to an Excel or Word document or click the "Print" button.
Note: These topics are discussed later in this section. Please refer to the topics "Creating a New Log," "Exporting to Excel/ Word" and "Printing" for details on these procedures.
4. If you wish to group events further, i.e., by specific "event type" within each panel, drag additional field headings into "Group by area," as shown in the example below.
Figure 24. Example of Events Grouped by 2 Fields: "Panel" & "Event Type" Figure 25. Example of Events Grouped by 2 Fields: "Panel "& "Event Type"
• In this example, the events are now grouped by event type within each panel. The P-300 panel now shows "3 items" (previously 6 items) because the events are now grouped by event type (Info, Restore, Trouble) within each panel. Previously, the events were only grouped by panel name.
• If you drop a field heading in the wrong position in the "Group by area", reorder it by dragging and dropping in front of
or behind another field.
• If you want to remove a field heading from the "Group by area," drag it out of the area as illustrated below: Figure 26. Example of Removing a Field Heading Out of "Group by Area"
Notes:
1. Click the "Window – Reset Window Layout" menu option toreturn event information to its original order! Drag field out of group
by area, past field
headings to avoid
Viewing Events Using the Keypad Option
The "View Keypad" option allows you to see a panel's real-time events as they display on the FACP's Keypad. The panel's event
history may also be viewed on the keypad by choosing the "View History" menu option. Each time an event displays on the FACP, it simultaneously displays on the FMT keypad as long as the panel is connected.
The Keypad option also shows the LED status lights as they display on the panel's keypad, i.e., Power, Alarm, rouble, etc., and whenever an event occurs, an audio beep emits. The audio may be disabled by clicking on the "Toggle Keypad Audio" icon.
Figure 27. Example of Displayed Panel Keypad & FACP's Main Menu
To view a panel's keypad and display event history:
• Click on the "View Keypad" selection box located beneath the applicable connected panel, as shown. Figure 28. Example of "View Keypad" Selection Box
• Click the "ENTER" button on the keypad to display the FACP's Main Menu. Figure 29. Examples of FACP Keypad & Main Menu-View History Option
Click
here!
Notes:
1. If the "Access Not Allowed" error message displays, this may indicate that the FMT User Code does not allow "Review History" access. Verify that the User Code has the "Review History" option selected (open FACP's software –"Users" to do this).
2. If you want to close a panel's keypad, click the "Close" button in the upper right corner of the keypad, or click in the
"View Keypad" selection box to remove the check mark.
• Click either the "down arrow" or "ENTER" key on the keypad to scroll through events. Figure 30. Examples of FACP Event History Screens
• Click the "ESC"key to return to the FACP Main Menu.
To disable the keypad audio:
• Click "Toggle Keypad Audio" icon .
• When audio is off, the icon changes to .
1. The "Events" log is a master list of all panels' events, and cannot be deleted.
2. The "Installed Panels" window pane may be moved or hidden to provide more space for the "Events" window pane.
• Click the Window Position icon ( ) to change pane position (floating, dockable, tabbed document, auto hide or hide). • Drag the " " (double-headed arrow) from the right edge of pane's border to increase or decrease width of pane.
3. Event fields separate event information by event #, panel name, date/time, event description and event type.
• Field width can be changed. Drag the " " from field border to increase/decrease width.
• Field order may be changed. Drag and drop field name to different position.
4. Events may be sorted, grouped or filtered by any field to limit and/or change the order events are listed. • To sort, click on a field heading to reorder all events alphabetically or numerically by that field.
• To group, click on "Group bar", then drag one or more field headings into "Group by bar" area.
• To filter, click on the filter icon in a field heading, then check/uncheck filter text or type in text you want to filter by.
5. The "Window – Reset Window Layout" menu option allows you to redisplay the events to their original format. 6. The "View Keypad" option displays "real-time" event history as it displays on the panel's control panel.
• LEDs reflect current panel status (i.e., Power, Trouble, etc.)
• Beeps when an event occurs; audio may be disabled. = Audio On = Audio Off
• Event history may be viewed by selecting "1=View History" from the keypad.
• Remember that the keypad menu options and event history are read-only! No changes can be made.
Operating Recap – Part 1: Events Window Overview / Sorting, Filtering & Grouping Events
• Events ("Master") Log
• Installed Panels Window position • Field (Column) Headings
• Sorting, Filtering & Grouping events • Resetting Window Layout
Printing Event Logs
There are a couple methods available to print event logs, which are summarized in the table below. Additionally, you may
optionally set up to automatically print events logs at a specific time each day or when a set number of events occur.
Table 4: Printing Options
Option Description
"Print" button Click the for information on selecting the default printer. button to output event logs to the default printer. See "Printer Settings" below
"Print Preview" button
The Report Preview window allows you to review the log prior to printing, as shown here.
• Use the PrintPreview icons, if necessary, to magnify the event information or to choose a different page layout option, i.e., page width, whole page, two page layout, etc.
• Click the Print icon to output event log to printer.
Printer Settings
The "Options-Printer Settings" menu option displays the default printer and page orientation. • The default printer is automatically set to your PC's
"Windows Default" printer.
• The default printer may be changed by clicking on the
"Default Printer's" drop-down arrow to display all other networked printers.
• The page orientation defaults to "Portrait" layout (8-1/2" x 11"); choose "Landscape," to rotate event log to print (11" x 8-1/2").
The "Auto Print Settings" menu option allows you to set up two (2) options to automatically print event reports, if wanted, as shown in the example below.
• The "Print when a number of events occurs" option
allows you to automatically print a report based on the number of events you specify.
Exporting Events to Excel / Word
At any time you can export all or limited event information to an Excel or Word document. This is useful for providing documentation if requested by the Fire Marshall or Authority Having Jurisdiction (AHJ) or for other historical record keeping
purposes. Another benefit to exporting events, is that the information can be reformatted and manipulated even more in the export
application.
To export events to a(n) Excel/Word document:
• Click the "Export to" dropdown box, to select Word as the export application (Excel is the default), if wanted. Figure 31. Example of Selecting Export Format Option
• Click the button.
Note: A message immediately displays indicating that records are being processed; once completed, a new Excel worksheet
or Word document opens, as shown in the examples below.
Figure 32. Examples of Events Exported to an Excel Worksheet and a Word Document
Notes:
1. Field headings are included in the exported data, which allows events to be further manipulated, i.e., sorted, filtered.
Saving Events to Logs
Events may be saved to a new user-created log whenever needed. For example, you may want to save all events that occur day by
day in a separate log or you may want to examine specific event types that occurred on a particular day or within a time frame. In the first example, you might create daily logs named "2013-06-24", "2013-06-25", etc., and in the second, a log named "Troubles on 3.30.13." Each new log is represented by a labeled "tab" that displays along the top of the Events window pane.
There's no limit to the number of logs that may be open at the same time, and each can be quickly located by clicking the "Active Files" ( ) icon, located in the upper-right corner of the Events window pane.
Note: Only user-created logs need to be saved. The "Events" master log is automatically saved by FMT! The table below summarizes the different methods you may use to create and save logs.
Table 5: Methods to Save Events to Logs
Option Description
"New Log" icon
Allows you to create a new blank log when you want to capture events that occurred during a particular time, such as when testing devices.
Notes:
• The "Logging On" button must be "on" to allow events to be output to the new log, as shown here:
• Once the events have been captured, click the "Logging On" button to prevent other events from being added to the new log. The button changes to "off" as shown here:
Events Shortcut menu options The Events shortcut menu is accessed by right-clicking the mouse anywhere in the Events window pane.
From the shortcut menu, choose one of the "save" choices:
• Save Selected to New Log File • Save All to New Log File
Note: When saving selected events only, be sure to right-click when the mouse is pointing to one of the selected events. Otherwise, not all selected events will be saved.
"Logging" menu options
The "Logging" menu provides the following options:
• New Log File is the same as the New Log icon.
• Open Log File opens a previously saved log, and is the same as the Open Log File icon.
• Close Log File closes a currently opened log.
Adding Notes to User-Created Logs
Notes may be added to any user-created log to provide additional documentation or clarification. There is no limit to the number of notes that may be added to a log, and you may print, sort or output them to an Excel file like any other event information. When
a "Note" is added, the next available event # is assigned and is given an "Info" event type, as shown in the example below. Figure 33. Example of Adding a Note
To add notes to a log:
• Click the button, or right-click to select "Add Note" from the shortcut menu, as shown below. Figure 34. Example of "Add Note" Window
• Enter note text into "Add Note" window. The text box will expand up to 254 characters for extensive notes. • Press OKbutton to complete.
Deleting Events
Events may be deleted individually or by groups by accessing the shortcut menu's "Delete Selected Events" option, as shown below:
Figure 35. Example of "Delete Selected Events" Option
Clear All Events
The button allows you to delete all events currently listed in any log.
Refresh All Panels
The button is available only in the "Events" master log. Use this feature if you want to update the list of events to
reflect any current off-normal conditions.
Deleting Saved Logs
If you want to delete any user log files, access the Windows–My Documents folder, located at: C:\Documents and Settings\ xxxxxxxx\My Documents (where "xxxxxxxx" represents your network user name). Then, from the "My Documents" folder, delete
one or more files like any other user-created file.
Note: All logs are saved to the "My Documents" window folder by default. To change the default log file location, select "Options - Preferences," as shown in the figure below.
Figure 36. Example of "Options–Preferences" Menu Option
Exiting FMT
Use the "File–Exit" menu option to exit the FMT program properly. If panels are connected when exiting, the "Disconnect All" dialog box prompt displays, as shown here. Choose "Yes" to disconnect.
1. Use the button or from the window, click the icon to print a log or list of events.
2. Use the "Options–Printer Settings" menu option to change printer default or page orientation (portrait vs. landscape). 3. Use the "Auto Print Settings" menu option to automatically print an event log when a specified number of events have
displayed or at a specific time each day.
4. Export events to either an Excel or Word document.
• Click on the drop down arrow to choose Excel / Word.
• Click the button to save all currently displayed events into the selected application document. • Save and/or close the document prior to attempting to export events to the same application.
5. Events may be saved to a user-created log.
• Click the icon to create a blank new log.
Note: Verify that the button is displayed to allow events to be updated to new log. To prevent new events being updated to log, verify that the button is displayed.
• Use the "Save Selected to New Log File" or "Save All to New Log File" options (from the shortcut menu)to create a new log.
• Use the "Logging" menu options to create a new log, open or close a log, or save a log file.
6. Click the button to add a new note to a user-created log. 7. All events may be cleared from any log by clicking the button.
8. Selective events may be deleted from any log by selecting "Delete Selected Events" from the shortcut menu. Operating Recap – Part 2: Saving & Printing Event Logs
• Print Preview & Printing • Setting Printer Preferences
• Exporting to Excel / Word documents • Creating New Logs
• Adding Notes to Logs
• Deleting All or Selective Events • Saving & Exiting