ORGINAL ARTICLE
Dynamic contrast enhanced MRI of wrist
as a useful diagnostic tool in early rheumatoid
arthritis
Khaled Dewan
a,*
, Hanan El-saadany
b aDepartment of Diagnostic Radiology, Faculty of Medicine, Tanta University, Egypt
b
Department of Physical Medicine, Rheumatology and Rehabilitation, Faculty of Medicine, Tanta University, Egypt
Received 15 January 2014; accepted 18 March 2014 Available online 24 April 2014
KEYWORDS
Dynamic; Contrast; MRI
Abstract Magnetic resonance imaging is the only tool, that provides the possibility of studying bone marrow edema.
Aim of the work: To investigate whether DCE-MRI has a role in assessing disease activity in RA. Furthermore, if these imaging parameters could provide reliable information about destructive joint changes during follow up period.
Patients and methods: 48 Patients with early RA were followed up with plain X-ray of both hands and feet with DCE-MRI of the clinically more affected wrist. Synovial inflammation was assessed by measuring E-rate. Synovial membrane hypertrophy, bone edema and erosions were scored by OMERACT at baseline and 18 months. Response to treatment was evaluated based on whether or notP50% improvement was achieved.
Results: Erosion score progressed while clinical and laboratory measures improved significantly from baseline to 18 months. Baseline bone edema, synovitis, pain scores, E-rate and ESR were cor-related with static MRI erosion score at 18 months.
Conclusion: DCE-MRI produces sensitive information regarding diagnosing and scoring synovitis (1–3) in early RA. Furthermore, it provides studying bone marrow edema which is the strongest predictor of bone erosion in early RA. Hence we conclude that DCE-MRI has a diagnostic and prognostic value in predicting bone erosion development later on.
2014 Production and hosting by Elsevier B.V. on behalf of Egyptian Society of Radiology and Nuclear
1. Introduction
Early rheumatoid arthritis (RA) is characterized by synovitis, inflammation and hypertrophy of synovial membrane tissue, which is presumably associated with subsequent cartilage destruction and bone erosion(1). The central importance of joint remodeling processes in RA pathology is highlighted by
* Corresponding author. Tel.: +20 01223598098. E-mail address:khaledabodewan@yahoo.com(K. Dewan).
Peer review under responsibility of Egyptian Society of Radiology and Nuclear Medicine.
Egyptian Society of Radiology and Nuclear Medicine
The Egyptian Journal of Radiology and Nuclear Medicine
www.elsevier.com/locate/ejrnm
www.sciencedirect.com
0378-603X2014 Production and hosting by Elsevier B.V. on behalf of Egyptian Society of Radiology and Nuclear Medicine.
http://dx.doi.org/10.1016/j.ejrnm.2014.03.010
Open access under CC BY-NC-ND license.
the fact that the assessment of structural damage using imag-ing techniques is a major diagnostic, monitorimag-ing, and outcome parameter in both clinical trials and routine clinical practice (2). Structural joint damage, a major outcome in rheumatoid arthritis (RA), has traditionally been measured by scoring methods applied to radiological images. However, only the late signs of preceding disease activity can be visualized by radiog-raphy. Magnetic resonance imaging (MRI) can detect RA ero-sive changes with greater sensitivity than conventional radiography, particularly in early disease. In addition, MRI allows direct visualization and assessment of synovitis, the primary lesion in RA, and of bone edema, a finding unique to MRI and a probable forerunner of bone erosions(3).
Studies on very early arthritis (63 months from symptom
onset) have shown that up to 20% of RA patients already present with erosions at baseline despite early referral, and substantial structural damage further develops even during dis-ease-modifying anti rheumatic drug (DMARD) therapy (4). On the other hand, rheumatologist in daily clinical practice well appreciate that a considerable number of patients does not experience any erosion even after long-term disease. Following the greater availability of treatment targets and options, the prospect of distinguishing which patient with early RA is to run a severe disease course and which is not, at present, is one of the main challenges in the management of RA(4).
DCE-MRI is a technique based on the sequential acquisi-tion of rapid MRI sequences before and during the infusion of a contrast agent. It has previously been used to evaluate synovial inflammatory activity in patients with RA in the knees showing that the steepness of the dynamic curves corre-lates better with histological synovial vascularity and inflam-matory cell infiltrate than measures of the corresponding post-contrast-enhancing synovial volumes(5). E-rate indicat-ing the speed and intensity of the diffusion of contrast agent in inflamed tissue can be calculated from these images. The early enhancement rate has been shown to tolerate the num-ber, size and permeability of synovial vessels as well as to the volume of the synovial membrane(6). DCE-MRI poten-tially allows detection of the early change in perfusion and inflammation upon treatment, which seems to occur before change in synovial volume and BME is seen in conventional MRIs(7). The main objective of this study was to investigate whether dynamic contrast enhanced-magnetic resonance imag-ing (DCE-MRI) has a role in assessimag-ing joint inflammation and disease activity in rheumatoid arthritis (RA). Furthermore, if these imaging parameters could provide reliable information about further destructive joint changes during 18 months follow up period.
2. Patients and methods
Forty-eight patients with early Rheumatoid Arthritis RA (disease duration less than 1 year) fulfilling the revised Ameri-can College of Rheumatology criteria of RA(8)plain X-ray of both hands and feet (modified Sharp score) (9), contrast enhanced MRI of the clinically more affected wrist, laboratory and clinical assessment at baseline and 18 months follow up period. Details of MRI parameters, clinical measures and med-ications are present in (Table 1). All patients were recruited
from out patient clinic of Physical Medicine, Rheumatology and Rehabilitation Department of Tanta University Hospitals. Patients were 40 females and 8 males, with a mean age of 45 years. The mean duration of symptoms was 5 months. Response to treatment at follow up was defined as P50% improvement in the tender and swollen joint scores, HAQ score and normal ESR or CRP. At 18 months follow up, all patients were taking one or more disease modifying anti rheu-matic drugs (DMARDs), but, anti-tumor necrosis factor alpha agents were not used by any of the patients.
2.1. Dynamic MRI scans
Imaging of clinically more affected wrist was done using high field strength 1.5 Tesla MRI scanner (Siemens MAGNETOM ESSENZA). Dynamic scans were obtained in the coronal plane using a 3D gradient – echo technique. The scans were localized using the initial axial spin echo localizing sequence. The continuous slices were arranged to cover all carpal bones. The imaging parameters were: 30 ms, TE 10 ms, flip angle 40 matrix size 128·256, slice thickness 2 mm, field of view 160·160 cm. Each acquisition consists of 12 slices and was obtained in 59 s. A pre-contrast scan was performed, then a 15 ml of Gd DTPA bolus (Magnevist 469 mg/ml, Schering AG) was injected i.v. through a cannula in the opposite fore-arm. This injection was given over a period of 15–25 s with a subsequent flush of 10 ml of normal saline, followed by the first post contrast sequence. Five post contrast sequences were obtained, each of 59 s duration with a delay of 1 s between them. The imaging time of the dynamic scan was 6 min. Before contrast – enhanced dynamic imaging, the following sequences were obtained: STIR SE coronal sequence {1800/25/ 80 ms(TR/TE/TI), 18·18 cm field of view, 216·256 matrix, one excitation slice thickness 3 mm imaging time 9 min 43 s}, T2 FSE axial sequence {4000/100 ms (TR/TE),15·15 field of view,240·256 matrix, slice thickness 3 mm,0,5 mm gap, imaging time 6 min}and T1-weighted 3D GRE coronal sequence {30/10 ms (TR/TE), flip angle 40 16·16 cm field of view, 256·256 matrix, one excitation, slice thickness 2 mm, imaging time 6 min 9 s}. After dynamic imaging, post contrast coronal T1-weighted 3D GRE images were obtained. Total imaging time was about 40 min .
2.2. Assessment of dynamic MRI scans
Analysis of the dynamic data was performed using high field strength 1.5 Tesla MRI scanner (Siemens MAGNETOM ESS-ENZA). Region of interest (ROI) circle (5–25 mm) was placed over the region of maximal synovial enhancement within the carpus. A curve was obtained, plotting the mean pixel intensity of the ROI circle against the time following the gadolinium injection. The curve was typically s-shaped (Fig. 1). The rate of enhancement per second after the first post-contrast sequence (59 s) was calculated as follows: E-rate = SIı – SI/ 59 s where SIis the signal intensity before the contrast injec-tion, and SIı-is the signal intensity reached after completing the first post-contrast sequence (59 s). The highest E-rate value of each wrist was presented as the maximal E-rate (E-rate max). An average E-rate value was calculated and presented as the average E-rate (E-rate average) (seeFig. 2–4).
2.3. Scoring of static MRI images
Scoring of synovial hypertrophy, bone edema and bone ero-sions of the wrist joint was done at baseline and at 18 month follow-up by reading the STIR images (bone edema) and the static T1 3D GRE images obtained before and after contrast enhancement (synovitis and erosions) according to the Outcome Measures (3) in Rheumatology Clinical Trials (OMERACT) group RA-MRI Scoring (RAMRIS) system. Synovitis was scored on a 0–3 scale at three different locations: radio-ulnar joint, radio-carpal joint and intercarpal–carpo-metacarpal joints (total maximum score 9). A score of 0 is normal, with no enhancement or enhancement up to the thick-ness of normal synovium, while the scores from 1 to 3 (mild,
moderate, severe) refer to increments of one-third of the pre-sumed maximum volume of enhancing tissue in the synovial compartment. The carpal bones, distal radius, distal ulna and metacarpal base (15 locations) were scored separately for bone edema (0–3 based on the volume of edema: 1: 1– 33%; 2: 34–66%;3: 67–100%) and bone erosions (0–10, based on the proportion of eroded bone compared with ‘‘assessed bone volume’’: 0: no erosion; 1: 1–10% of bone eroded; 2: 11–20%, etc.). The maximum score for bone edema was 45 and that for bone erosions was 150. The metacarpophalangeal joints were not evaluated, as they were not completely covered in the image sets.
Reader was blinded to the clinical and laboratory parame-ters, and scored the 18 months MRI scans without reference to the baseline scans. After independent readings, however, an additional consensus reading was performed with reference to the baseline scans, to achieve maximum accuracy in scoring the bone erosions and edema.
3. Statistical methods
The association between the baseline parameters and the change of erosion scores from baseline to 18 months were ana-lyzed using Spearman’s rank correlation coefficients (R). The baseline variables that were significantly related to erosive pro-gression, were then incorporated into a multivariate regression model (forward stepwise). Change in the erosion score of two or more was chosen as the cut-off value. Friedman’s test was used to assess the change in the variables over the follow-up. Mann–Whitney’s U test was used to explore the variable dif-ferences between the groups obtained based on erosive pro-gression and the response to treatment. The level of P< 0.05 was considered statistically significant. SPSS 11.0 was used to conduct analyses.
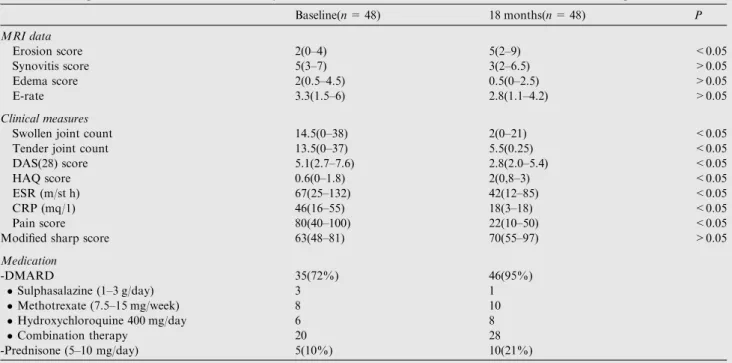
Table 1 MRI parameters, clinical and laboratory measures and medications at baseline and 18 months follow up.
Baseline(n= 48) 18 months(n= 48) P MRI data Erosion score 2(0–4) 5(2–9) <0.05 Synovitis score 5(3–7) 3(2–6.5) >0.05 Edema score 2(0.5–4.5) 0.5(0–2.5) >0.05 E-rate 3.3(1.5–6) 2.8(1.1–4.2) >0.05 Clinical measures
Swollen joint count 14.5(0–38) 2(0–21) <0.05
Tender joint count 13.5(0–37) 5.5(0.25) <0.05
DAS(28) score 5.1(2.7–7.6) 2.8(2.0–5.4) <0.05
HAQ score 0.6(0–1.8) 2(0,8–3) <0.05
ESR (m/st h) 67(25–132) 42(12–85) <0.05
CRP (mq/1) 46(16–55) 18(3–18) <0.05
Pain score 80(40–100) 22(10–50) <0.05
Modified sharp score 63(48–81) 70(55–97) >0.05
Medication -DMARD 35(72%) 46(95%) Sulphasalazine (1–3 g/day) 3 1 Methotrexate (7.5–15 mg/week) 8 10 Hydroxychloroquine 400 mg/day 6 8 Combination therapy 20 28 -Prednisone (5–10 mg/day) 5(10%) 10(21%)
DAS: disease activity score, HAQ score: health assessment questionnaire score, ESR: erythrocyte sedimentation rate, CRP: C reactive protein.
0 50 100 150 200 250 300 350 400 450 500 Signal Int e nsit y Basline 18 months 0 59 120 180 240 300 350 Time/Seconds
Fig. 1 Dynamic MRI shows a steep curve at baseline indicating intense and rapid enhancement with non-significant decrement at 18 months follow up.
4. Results
MRI parameters, clinical and laboratory measures and medi-cations at baseline and 18 month follow up are presented in
Table 1. The erosion score progressed significantly, while
clin-ical and laboratory measures improved significantly from base-line to 18 months follow up period. Regarding sharp score there was non-significant progression from baseline to 18 months.
A persistent response to the treatment was found in 20 patients out of 48 (41%), while inadequate response in 28
(59%) throughout 18 months of follow up. There was a signif-icant difference between responders and non-responders regarding MRI data (Table 2) while, non-significant differ-ences regarding clinical and laboratory findings, age, sex and medication were found between these groups (data not shown). Furthermore in the group of non-responders, 18 patients out of 28 (64%) presented new/progressive erosions, while 10 (36%) had stopped erosive progression. We also found that patients who presented with erosive progression from baseline to 18 months had highly significant MRI synovi-tis scores, edema scores and E-rate, while had non-significant Fig. 2 Serial MRI scans of early RA patient born in 1970. (A) Baseline contrast enhanced coronal T1-weighted MR image shows intermediate signal intensity consistent with synovitis (B) STIR image shows synovitis as high signal intensity (white arrow). High signal intensity bone marrow edema appears at the base of the second metacarpal and capitate bones (black arrows). (C) Coronal T2 fat suppressed MR image at 18 months later shows erosions at sites of previous bone edema at 2nd metacarpal and capitate bones (arrows).
Fig. 3 Serial MRI scans of 45 years old woman with early RA. (A) Baseline coronal T1W MR image scan of the wrist shows low signal in the trapezium and scaphoid bones reflecting bone marrow edema. (B) Baseline contrast enhanced image shows marked synovial enhancement. (C) At 18 months, there is marked reduction of enhancement with appearance of two new erosions in trapezium and scaphoid.
difference regarding clinical measures and sharp score than non-responders without progressive bone damage (Table 3).
Erosive development on MRI correlated significantly (P< 0.05) with the baseline bone edema score, synovitis score, E-rate, pain score, and ESR, while age, sex, medication use (presence of DMARDs or prednisone at baseline), swollen or tender joint count, DAS score, sharp score, and HAQ score did not correlate with changes in the bone erosion score from baseline to 18 months (Table 4). Regarding E-rate it was cor-related significantly with all MRI parameters at baseline, but did not correlate with sharp score and clinical and laboratory measures except for ESR and pain score (Table 5). In multivar-iate logistic regression analysis, bone marrow edema was found to be the only variable that predicts bone erosion later
on (Table 6).
5. Discussion
Imaging techniques have played an important role in assessing disease progression and response to treatment in rheumatoid arthritis (RA) for many years. Plain X-rays have been widely used together with scoring systems designed to quantify disease and measure progression and response to treatment. However, these rely on relatively late disease features such as bone ero-sions and joint space narrowing(10)hence the use of advanced imaging modalities has allowed greater understanding of the rheumatoid arthritis (RA) disease process and the links between inflammation and damage(11).
MRI is the only tool to provide the possibility of studying BME, which is true inflammatory osteitis (12,13) so, it was chosen as the outcome measure of this study. Many studies Fig. 4 MRI scans of 51 years old woman with early RA and normal X-ray finding at presentation. (A) Baseline coronal fat suppressed T2weighted image shows diffuse bone marrow edema with high signal intensity in carpal bones and base of second metacarpal bone. (B) At 18 months follow up, bone edema subsides with appearance of bone erosions at sites of previous marrow edema.
Table 2 Comparison between clinical responders and non responders regarding MRI data from baseline to 18 months.
MRI Data Respondersn= 20 (41%) Non respondersn= 28(59%) P
Erosion score 3(0.1–0.7) 8(4–10) <0.05
Synovitis score 2.5(1.5–3.5) 5(2.5–7.5) <0.05
Edema score 1.5(1–2.5) 6(2–9) <0.05
E rate 1.9(0.9–2.8) 3.2(1.2–4.9) <0.05
Table 3 Parameters of clinical non responders regarding erosion progression at 18 months follow up period.
Without (n= 10) (36%) With (n= 18) (64%) P MRI data Erosion score 3(1.1–7.1) 7(4–8) <0.05 Synovitis score 4(2–4) 7(6–9.1) <0.05 Edema score 2(0–2.1) 6(1.9–9.1) <0.05 E-rate 1.3(0.9–3.2) 2.9(2.1–4.8) <0.05 Clinical measures
Swollen joint count 8(4–16) 11(6–20) >0.05
Tender joint 10(6–18) 13(8–22) >0.05 DAS score 4.8(2.5–6.1) 5.6(2.9–6.8) >0.05 HAQ score 1(0,6–1.8) 1,5(0,8–3) >0.05 ESR 29(10–131) 32(20–40) >0.05 CRP 12(4–22) 15(7–25) >0.05 Pain score 30(18–42) 45(12–55) >0.05
have been shown that E-rate correlates with clinical findings including joint swelling, pain (14) disease activity score (DAS), HAQ (15), erosion progression (6) and response to treatment(16). In contrast, Reiser et al. did not find any cor-relation between E-rate and clinical activity(17). The picture with ESR is more confused with some studies finding a corre-lation(1,18), while others were unable to do so(7). Two stud-ies have compared DCE-MRI with progression of bone erosion (defined by OMERACT score) and have demonstrated a correlation between E-rate and erosive progression after 1 year (42 patients)(18)and 2 years (24 patients)(6). This pro-vides that DCE-MRI predicts erosive progression.
In our study we did not find any correlation between E-rate and clinical and laboratory measures except for ESR and pain score while there was a significant correlation between E-rate and all MRI parameters at 18 months follow up.
Although conventional radiography has been considered as the golden standard for the assessment of joint damage in RA, MRI has been shown to have higher sensitivity in the monitor-ing of erosive progression(6). In an established RA follow-up study, 78% of the new radiographic erosions could be visual-ized 2 years earlier by MRI than by conventional radiography. Longitudinal studies have demonstrated the relationship between MRI-detectable inflammation, bone edema and sub-sequent MRI-detectable bone damage, Mc Queen (19) and Hetland(20)reported that baseline edema score was the only MRI feature on multivariate analysis to predict 6 and 2 year sharp score, respectively while baseline synovitis score did not predict changes in sharp score(19,20,23). Moreover Oster-guard (21) concluded that MRI erosive progression at 3 months correlates with X-ray progression at 9 months, these findings are more or less in accordance with our results where we found no correlation between MRI erosion score and X-ray progression (modified Sharp score) during follow up period. On the other hand, Bird et al.(22) concluded that there was no clear benefit of MRI over X-ray.
In this study, non-significant improvements in imaging synovitis and osteitis were concordant with significant reduc-tions in clinical and laboratory measures, as would be expected. This is consistent with the findings of other studies which have also reported MRI to be more sensitive for detect-ing synovitis than clinical assessment (24), in addition Molenaar et al. reported that clinically relevant progression of joint damage does sometimes occur in patients in prolonged clinical remission where there is minimal if any clinical synovitis(25).
This could also be concluded from the findings documented here, as patients clinically responding to treatment had resid-ual imaging synovitis at 18 months despite responding clini-cally to DMARD therapy. Brown et al. also reported that imaging synovitis occurred frequently in patients with RA who fulfilled the clinical criteria for remission(26) suggesting a ‘floor effect’ for the clinical detection of joint inflammation below which subclinical inflammation can only be revealed by imaging, concerning the ability of MRI to act as a tool for monitoring change in synovitis or osteitis. A proof of con-cept of the tight relationship between clinically active joints and structural changes is provided by the demonstration that repair (the opposite of progression), although it remains an extremely rare feature in RA(27), may only occur in associa-tion with improvement or cessaassocia-tion of clinical swelling(28).
The crucial importance of joint assessment to predict radio-graphic outcomes in patients with RA is further highlighted by recent evidences showing that joint damage progression in remission is driven by residual swollen joints (29), which appear to be more predictive compared with other variables of inflammation such as acute phase reactants(30). This find-ing accentuates the importance of early aggressive treatment of MRI-detected inflammation, with the target of reducing the total load of MRI inflammation over time in order to reduce bone destruction and improve patient outcome. The results of the present study indicate that patients at high-risk for ero-sive progression on wrist MRI have high local inflammatory activity at baseline, which can be reliably detected in contrast-enhanced dynamic and static MRI. Furthermore, at follow-up, active erosive disease can be detected with this method. Our results support the existing data on the impor-tance of MRI in disease monitoring and the prognostication Table 4 Correlation between erosion score and baseline
variables at 18 months. Variables R P MRI data Edema score 0.77 <0.05 Synovitis score 0.58 <0.05 E-rate 0.48 <0.05 Clinical findings
Swollen joint count 0.22 >0.05
DAS 0.22 >0.05
Tender joint count 0.18 >0.05
HAQ 0.25 >0.05
ESR 0.59 <0.05
CRP 0.27 >0.05
Pain score 0.38 <0.05 Modified sharp score 0.19 >0.05
Table 5 Correlation between E-rate and baseline variables at 18 months.
Variables R P
Edema score 0.75 <0.05 Erosion score 0.66 <0.05 Synovitis score 0.58 <0.05 Swollen joint count 0.18 >0.05 Tender joint count 0.29 >0.05
DAS score 0.21 >0.05
HAQ score 0.25 >0.05
ESR 0.59 <0.05
CRP 0.24 >0.05
Pain score 0.39 <0.05 Modified sharp score 0.23 >0.05
Table 6 Multivariate logistic regression analysis of baseline variables associated with changes in bone erosion.
Variables OR 95% CI -Bone edema 28 (11.7–67.1) -E-rate 12 (4.1–29.2) -Static synovitis 14.9 (6.3–34.9) -ESR 10.3 (6–27.1) -Pain score 9.9 (5.5–25)
of erosive disease. This study and several others
(11,19,20,24,26)clearly show that osteitis in the subchondral
bone is far more predictive of the later development of bone erosion than is synovitis. It can be hypothesized that the devel-opment and progression of erosions would be most closely associated with osteitis (MRI bone edema), but there would also be a weaker association with synovitis (as both synovitis and osteitis are sponsored by the same underlying process(11). Only in the study reported by Brown et al. MRI bone edema has been found to be less predictive of radiographic ero-sions than MRI synovitis (31). Interestingly, that group did not use T2-weighted or STIR sequences in their MRI protocol for the detection of bone edema, as recommended by the Out-come Measures in Rheumatology Clinical Trials (OME-RACT) Rheumatoid Arthritis Magnetic Resonance Imaging Scoring (RAMRIS) system(32).
There is no doubt that synovial inflammation, osteitis and bone erosion are all intimately connected. However, much evi-dence exists to suggest that osteitis is more strongly predictive of bone erosion than synovitis, supporting the notion that there is a more direct connection between bone inflammation and bone damage than between synovial inflammation and bone damage. Synovitis and osteitis might be viewed as cous-ins with a common ancestor, the process that ultimately drives both remaining obscure but quite possibly sited in the bone marrow. However, the reduction of both synovitis and osteitis is clearly an important therapeutic goal. The detection and monitoring of synovitis are often more feasible in clinical prac-tice using US than MRI scanning, but the latter does afford the opportunity to detect and monitor bone edema at the same time(11).
6. Conclusion
Dynamic contrast enhanced MRI produces sensitive informa-tion regarding synovitis score (1–3) in early RA. Furthermore, it is the only tool that provides the possibility of studying bone marrow edema which is the strongest predictor of subsequent bone erosion in early RA patients. Hence we can conclude that MRI has a diagnostic and prognostic value in predicting early RA patients at high risk of erosion development later on.
Conflict of interest None.
References
(1)Palosaari K, Vuotila J, Takalo R, et al. Contrast-enhanced
dynamic and static MRI correlates with quantitative 99Tcm labeled nanocolloid scintigraphy. Study of early rheumatoid arthritis patients. Rheumatology 2004;43:1364–73.
(2) Lillegraven S, Van Der Heijde D, Uhlig T, et al. What is the clinical relevance of erosions and joint space narrowing in RA? Nat Rev Rheumatol 2012. http://dx.doi.org/10.1038/nrrhe-um.2011.20210.1038/nrrheum.2011.202.
(3) stergaard M, Edmonds J, McQueen F, et al. An introduction to the EULAR–OMERACT rheumatoid arthritis MRI reference image atlas. Ann Rheum Dis 2005;64(Suppl. I):i3–7. http:// dx.doi.org/10.1136/ard.2004.031773.
(4)Bugatti Serena, Manzo Antonio, Caporali Roberto, et al.
Assessment of synovitis to predict bone erosions in rheumatoid arthritis. Ther Adv Musculoskel Dis 2012;4(4):235–44.
(5)Boesen Mikael, Kubassova Olga, et al. Correlation between
computer-aided dynamic gadolinium-enhanced MRI assessment of inflammation and semi-quantitative synovitis and bone mar-row oedema scores of the wrist in patients with rheumatoid arthritis––a cohort study. Rheumatology 2012;51:134–43.
(6)Palosaari Kari, Vuotila1 Jorma, Takalo Reijo, et al. Bone
oedema predicts erosive progression on wrist MRI in early RA––a 2-yr observational MRI and NC scintigraphy study. Rheumatology 2006;45:1542–8.
(7)Ostergaard M, Stoltenberg M, Henriksen O, et al. Quantitative assessment of synovial inflammation by dynamic gadolinium-enhanced magnetic resonance imaging. A study of the effect of intra-articular methylprednisoloneon the rate of early synovial enhancement. Br J Rheumatol 1996;35:50–9.
(8)Arnett FC, Edworthy SM, Bloch DA, et al. The American
Rheumatism Association 1987 revised criteria for the classifica-tion of rheumatoid arthritis. Arthritis Rheum 1988;31:315–24. (9)Vander Heijde D, Hardert T, Nieman F, et al. Reliability and
sensitivity to charge a simplification of the Sharp Van der Heijde radiological assessment in rheumatoid arthritis. Oxford Rheuma-tology 1999;38(10):941–7.
(10)Hodgson RJ, Connor PO, Moots R. MRI of rheumatoid arthritis –image quantification for assessment of disease activity, progres-sion and response to therapy. Rheumatology 2008;47(1):13–21.
(11)McQueen Fiona, Naredo Esperanza. The ‘disconnect’ between
synovitis and erosion in rheumatoid arthritis: a result of treatment or intrinsic to the disease process itself? Ann Rheum Dis 2011;70:241–4.
(12)Dohn UM, Ejbjerg BJ, Hasselquist M, et al. Detection of bone erosions in rheumatoid arthritis wrist joints with magnetic resonance imaging, computed tomography and radiography. Arthritis Res Ther 2008;10:R2.
(13)Boesen M, Ellegaard K, Boesen L, et al. Ultrasound Doppler
score correlates with OMERACT RAMRIS bone marrow edema and synovitis score in the wrist joint of patients with rheumatoid arthritis. Ultraschall Med 2011 [E pub ahead of print].
(14)Ostegaard M, Lorenzen I, Henriksen O. Dynamic
gadolinium-enhanced MR imaging in active and inactive immune inflamma-tory gonarthritis. Acta. Radiol. 1994;35:275–81.
(15)Cimmino MA, Innocenti S, Livrone F, et al. Dynamic gadolin-ium-enhanced magnetic resonance imaging of the wrist in patients with rheumatoid arthritis can discriminate active from inactive disease. Arthritis Rheum 2003;48:1207–13.
(16)Tam LS, Griffith JF, Yu AB, et al. Rapid improvement in
rheumatoid arthritis patients on combination of methotrexate and infliximab: clinical and magnetic resonance imaging evaluation. Clin Rheumatol 2007;26:941–6.
(17)Reiser MF, Bongartz GP, Erlemann R, et al. Gadolinium DPTA
in rheumatoid arthritis and related diseases: first results with
dynamic magnetic resonance imaging. Skeletal Radiol
1989:591–7.
(18)Huang J, Stewart N, Crabbe J, et al. A 1-year follow-up study of dynamic magnetic resonance imaging in early rheumatoid arthri-tis reveals synoviarthri-tis to be increased in shared epitope-positive patients and predictive of erosions at 1 year. Rheumatology 2000;39:407–16.
(19)McQueen FM, Benton N, Perry D, et al. Bone edema scored on
magnetic resonance imaging scans of the dominant carpus at presentation predicts radiographic joint damage of the hands and feet six years later in patients with rheumatoid arthritis. Arthritis Rheum 2003;48:1814–27.
(20)Hetland ML, Ejbjerg BJ, Hørslev-Petersen K, et al. MRI bone edema is the strongest predictor of subsequent radiographic progression in early rheumatoid arthritis. Results from a 2-year
randomized controlled trial (CIMESTRA). Ann Rheum Dis 2009;68:384–90.
(21)Ostegaard M, Duer A, Nielsen H, et al. Magnetic resonance
imaging for accelerated assessment of drug effect and prediction of subsequent radiographic progression in rheumatoid arthritis: a study of patients receiving combined anakinra and methotrexate. Ann Rheum Dis 2005;64:1503–6.
(22)Bird P, Kirkham B, Portek I, et al. Documenting damage
progression in a two year longitudinal study of rheumatoid arthritis patients with established disease (the DAMAGE study cohort): is there an advantage in the use of magnetic resonance imaging as compared with plain radiology? Arthritis Rheum 2004;50, 1383-106.
(23)Bøyesen P, Haavardsholm E, Ostergaard M, et al. MRI in early rheumatoid arthritis: synovitis and bone marrow edema are independent predictors of subsequent radiographic progression. Ann Rheum Dis 2011;70:428–33.
(24)Døhn UM, Ejbjerg B, Boonen A, et al. No overall progression and occasional repair of erosions despite persistent inflammation in adalimumab treated rheumatoid arthritis patients: results from longitudinal comparative MRI, ultrasonography, CT and radi-ography study. Ann Rheum Dis 2011;70:252–8.
(25)Molenaar ET, Voskuyl AE, Dinant HJ, et al. Progression of
radiologic damage in patients with rheumatoid arthritis in clinical remission. Arthritis Rheum 2004;50:36–42.
(26)Brown AK, Conaghan PG, Karim Z, et al. An explanation for
the apparent dissociation between clinical remission and
contin-ued structural deterioration in rheumatoid arthritis. Arthritis Rheum 2008;58:2958–67.
(27)van der Linden M, Boja R, Klarenbeek N, et al. Repair of joint erosions in rheumatoid arthritis: prevalence and patient
charac-teristics in a large inception cohort. Ann Rheum Dis
2010;69:727–9.
(28)Lukas C, van der Heijde D, Fatenajad S, et al. Repair of erosions occurs almost exclusively in damaged joints without swelling. Ann Rheum Dis 2010;69:851–8.
(29)Aletaha D, Smolen J. Joint damage rheumatoid arthritis pro-gresses in remission cording to the disease activity score in 28 joints and is driven by residual swollen joints. Arthritis Rheum 2011;63:3702–11.
(30)Aletaha D, Alasti F, Smolen J. Rheumatoid arthritis near
remission: clinical rather than laboratory inflammation is
associ-ated with radiographic progression. Ann Rheum Dis
2011;70:1975–80.
(31)Mundwiler ML, Maranian P, Brown DH, et al. The utility of
MRI in predicting radiographic erosions in the metatarsophalan-geal joints of the rheumatoid foot: a prospective longitudinal cohort study. Arthritis Res Ther 2009;11:R94.
(32)Østergaard M, Peterfy C, Conaghan P, et al. OMERACT
rheumatoid arthritis magnetic resonance imaging studies. Core set of MRI acquisitions, joint pathology definitions, and the
OMERACT RA-MRI scoring system. J Rheumatol