From the Veterans Affairs (VA) Center for Clinical Management Research, VA Ann Arbor Healthcare System, Ann Arbor, MI (R.A.H., W.L.W.); Phoenix VA Health Care System, Phoenix, AZ (P.D.R., W.C.D.); and the Hines VA Cooperative Studies Program Coordinating Center and Edward Hines, Jr., VA Hospital (G.D.B., D.J.R., L.G., N.V.E.), and VA Pharmacy Benefits Management Services (M.M.) — all in Hines, IL. Address reprint requests to Dr. Hayward at the Robert Wood Johnson Foundation Clinical Scholars Program, 2800 Plymouth Rd., North Campus Re-search Complex, Bldg. 10, Rm. G016, Ann Arbor, MI 48019-2800, or at rhayward@ umich . edu.
This article was updated on June 5, 2015, at NEJM.org.
* A complete list of the investigators in the Veterans Affairs Diabetes Trial (VADT) is provided in the Supplementary Appen-dix, available at NEJM.org.
N Engl J Med 2015;372:2197-206. DOI: 10.1056/NEJMoa1414266 Copyright © 2015 Massachusetts Medical Society. BACKGROUND
The Veterans Affairs Diabetes Trial previously showed that intensive glucose lower-ing, as compared with standard therapy, did not significantly reduce the rate of major cardiovascular events among 1791 military veterans (median follow-up, 5.6 years). We report the extended follow-up of the study participants.
METHODS
After the conclusion of the clinical trial, we followed participants, using central databases to identify procedures, hospitalizations, and deaths (complete cohort, with follow-up data for 92.4% of participants). Most participants agreed to addi-tional data collection by means of annual surveys and periodic chart reviews (survey cohort, with 77.7% follow-up). The primary outcome was the time to the first major cardiovascular event (heart attack, stroke, new or worsening congestive heart failure, amputation for ischemic gangrene, or cardiovascular-related death). Secondary outcomes were cardiovascular mortality and all-cause mortality.
RESULTS
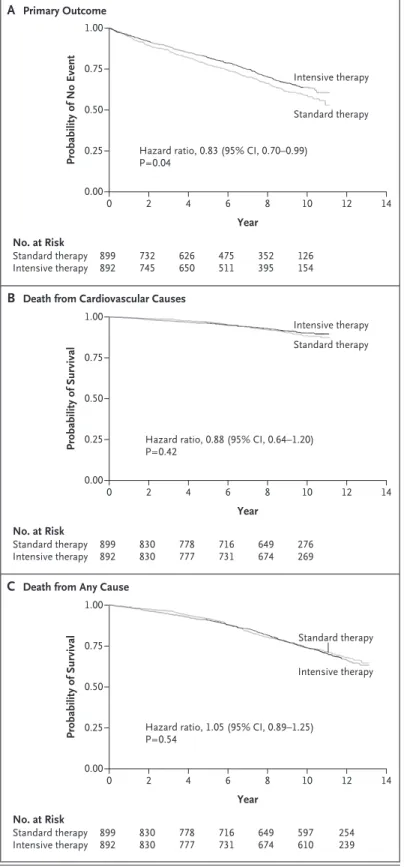
The difference in glycated hemoglobin levels between the intensive-therapy group and the standard-therapy group averaged 1.5 percentage points during the trial (median level, 6.9% vs. 8.4%) and declined to 0.2 to 0.3 percentage points by 3 years after the trial ended. Over a median follow-up of 9.8 years, the intensive-therapy group had a significantly lower risk of the primary outcome than did the standard-therapy group (hazard ratio, 0.83; 95% confidence interval [CI], 0.70 to 0.99; P = 0.04), with an absolute reduction in risk of 8.6 major cardiovascular events per 1000 person-years, but did not have reduced cardiovascular mortality (hazard ratio, 0.88; 95% CI, 0.64 to 1.20; P = 0.42). No reduction in total mortality was evident (hazard ratio in the intensive-therapy group, 1.05; 95% CI, 0.89 to 1.25; P = 0.54; median follow-up, 11.8 years).
CONCLUSIONS
After nearly 10 years of follow-up, patients with type 2 diabetes who had been randomly assigned to intensive glucose control for 5.6 years had 8.6 fewer major cardiovascular events per 1000 person-years than those assigned to standard therapy, but no improvement was seen in the rate of overall survival. (Funded by the VA Cooperative Studies Program and others; VADT ClinicalTrials.gov number, NCT00032487.)
ABS TR ACT
Follow-up of Glycemic Control and
Cardiovascular Outcomes in Type 2 Diabetes
Rodney A. Hayward, M.D., Peter D. Reaven, M.D., Wyndy L. Wiitala, Ph.D., Gideon D. Bahn, Ph.D., Domenic J. Reda, Ph.D., Ling Ge, M.S.,
Madeline McCarren, Ph.D., William C. Duckworth, M.D., and Nicholas V. Emanuele, M.D., for the VADT Investigators*
P
atients with type 2 diabetes have a greatly increased risk of cardiovascular events.1 Although end-stage microvascularevents (such as end-stage renal disease and blind-ness) represent important complications of dia-betes, the morbidity and mortality related to cardiovascular events are an order of magnitude greater than that related to microvascular events.2
Therefore, whether improved glucose control re-duces the rate of cardiovascular events is an im-portant clinical question.
Most observational studies have shown an as-sociation between glucose control and cardiovas-cular disease.3-6 Among the four large,
random-ized, controlled trials of improved glucose control in patients with type 2 diabetes — the United Kingdom Prospective Diabetes Study (UKPDS), the Veteran Affairs Diabetes Trial (VADT), the Action in Diabetes and Vascular Disease: Preterax and Diamicron Modified Release Controlled Evaluation (ADVANCE) trial, and the Action to Control Cardiovascular Risk in Diabetes (AC-CORD) trial7-12 — the most evidence for a
reduc-tion in the rate of cardiovascular events with intensive glucose control came from the UKPDS. The fact that the UKPDS had a more extended follow-up than the other trials could potentially explain its positive results. Alternatively, the more favorable outcomes in the UKPDS could be re-lated to interventions in a younger, healthier group of patients with newly diagnosed type 2 diabetes or could be related to the fact that the UKPDS used a less intensive glucose treatment protocol than that used in the other trials.
The ACCORD trial also recently showed a sig-nificant reduction in the rate of nonfatal cardio-vascular events in a follow-up of its study popu-lation,13 but that benefit was offset by an
increase in mortality in the original trial.12 In
contrast, no reduction in the rate of cardiovascu-lar events or in mortality was found in a follow-up of the ADVANCE trial.14 Consequently, one of
the most important questions facing clinicians who care for patients with type 2 diabetes re-mains unanswered — what benefits and risks are conferred by tight glucose control in patients with diabetes who receive modern combination glycemic therapy?
We report cardiovascular outcomes after an extended follow-up period of the VADT,10 a
multi-site, randomized, controlled trial of intensive versus standard glucose control in U.S. military
veterans with type 2 diabetes, in which patients were followed for up to 7.5 years (median, 5.6 years). At the end of the VADT, the primary out-come of major cardiovascular events was nonsig-nificantly lower in the intensive-therapy group than in the standard-therapy group (hazard ratio, 0.88; 95% confidence interval [CI], 0.74 to 1.05; P = 0.14). At the conclusion of the trial, all the participants were returned to usual care with no further clinical intervention by the research team. The current prespecified analysis includes approximately 5 additional years of observa-tional follow-up of the study cohort.
Methods
Study Design
The design of the active portion of our study and the main results were published previously.10
Briefly, the original study included 1791 military veterans with type 2 diabetes who were ran-domly assigned to receive either intensive or standard glucose control. The interventional component of the study ended on May 29, 2008 (median follow-up, 5.6 years).
As approved by the institutional research board at the Central Database Collection Center (VA Ann Arbor), all the participants who were alive and enrolled at the conclusion of the study are being followed through a national data regis-try (a description of the complete cohort is pro-vided in the Supplementary Appendix, available with the full text of this article at NEJM.org). Some patients (the survey cohort) provided writ-ten informed consent for additional data collec-tion, including a yearly survey and chart reviews to detect outcomes that were not easily obtained from central data registries (Fig. 1). The coordi-nating sites in Hines, Illinois, and Ann Arbor, Michigan, collected all the data for this follow-up study.
The third and fourth authors vouch for the data and analyses. The manuscript was written by the first author, with all the coauthors ap-proving the final version. The timing of this re-port and the statistical analysis plan were pre-specified by the lead investigators of the study (the first, second, and last authors). At the time that the statistical analysis plan was finalized, the lead investigators were unaware of all the results and had no access to the data set. No agreements concerning the confidentiality of the
data were made between the sponsors and the authors or the institutions listed in the Supple-mentary Appendix, other than those required to protect the confidentiality of study participants. The protocol, available at NEJM.org, has ongo-ing approval and oversight by the institutional review boards at the Hines and Ann Arbor VA health systems. The study is reviewed annually by a data monitoring committee.
Data Sources
Four national data registries are being used to collect follow-up data on patients — the central VA medical information files, the Centers for Medicare and Medicaid Services (CMS) Medicare claims files, the VA death files, and the National Death Index (NDI) (Tables S1 and S2 in the Sup-plementary Appendix). The survey cohort receives an annual self-administered survey that asks, among other questions, whether major events (e.g., heart attacks and strokes) occurred during the previous year. Patients who report having had a heart attack, stroke, or amputation in the past year are asked whether they received care for the event within the VA system or from an
outside provider. For participants younger than 65 years of age (for whom CMS data are not avail-able), those reporting an event outside the VA sys-tem are asked to provide written informed consent to allow review of their hospital records; medical records were successfully received and reviewed for 15 of 18 reports (83%). The adjudication pro-cess is described in the Supplementary Appendix. The present interim report includes all the follow-up data that were available through De-cember 2013. For most study outcomes, we ob-tained a median of 11.8 years of follow-up data. However, two of the central data registries — NDI (the source for data on deaths from cardio-vascular causes) and CMS (used to detect events occurring outside the VA system in participants 65 years of age or older) — have a lag time in data availability of approximately 2 years. We decided a priori that our primary analysis of the time to the first major cardiovascular event would be limited to the period in which we have complete capture of data on primary-outcome events (median follow-up, 9.8 years), and we in-cluded a sensitivity analysis that used available outcome data for the full 11.8-year period. Figure 1. Study Enrollment and Follow-up for the Primary Outcome.
Complete follow-up refers to participants who were followed either until a primary-outcome event occurred or until the end of the scheduled data collection. The primary outcome was the time to the first major cardiovascular event (a composite of heart attack, stroke, new or worsening congestive heart failure, amputation for ischemic gangrene, or cardiovascular-related death).
1791 Patients with type 2 diabetes were enrolled
899 Were assigned to receive
standard therapy 892 Were assigned to receiveintensive therapy 81 Withdrew from the trial
before primary-outcome event occurred
55 Withdrew from the trial before primary-outcome
event occurred 818 Were included in the follow-up
in complete-cohort analyses 837 Were included in the follow-upin complete-cohort analyses 130 Did not have
primary-outcome event and were not part of survey cohort
134 Did not have primary-outcome event and were not part of survey cohort 688 Completed follow-up in
Primary and Secondary Outcomes
The primary outcome was the time to the first major cardiovascular event (a composite of heart attack, stroke, new or worsening congestive heart failure, death from cardiovascular causes, or am-putation for ischemic gangrene). This composite outcome was selected a priori and differs slight-ly from the outcome used in the original VADT, which also included selected cardiac procedures and the occurrence of new peripheral vascular disease. The former was excluded from the com-posite outcome because of a desire to focus on hard outcomes, and the latter was excluded be-cause of the lack of reliable methods for identi-fication of these events with the use of central data collection. Since these changes in the pri-mary outcome make direct comparisons with the original VADT results difficult, we also sepa-rately show our results obtained during the original VADT and during observational follow-up in Table S6 in the Sfollow-upplementary Appendix.
Events during the interventional part of the study were evaluated with the use of the original outcome-assessment method (adjudication by a committee whose members were unaware of the study-group assignments), although data regard-ing a few major cardiovascular events and deaths in patients who missed their final study visit during the last 6 months of the intervention were captured from central databases (see the Additional Details on End Points section in the Supplementary Appendix). During the observa-tional follow-up period, heart attacks, strokes, and new or worsening congestive heart failure were identified by means of the primary discharge diagnosis in VA or CMS registry files (which have been shown previously to have excellent positive predictive value)15,16 or by review of
out-side records in the case of participants younger than 65 years of age who reported an event on their survey, as described above. New or worsen-ing congestive heart failure was identified by means of the primary discharge diagnosis in the CMS or VA data registry or by an ejection fraction of less than 40% as observed on echocardiogra-phy (see the Additional Details on End Points section in the Supplementary Appendix).
The two prespecified secondary outcomes were cardiovascular mortality and total mortal-ity.17 Both of these secondary outcomes were
assessed in the complete cohort.
Sensitivity Analysis
To assess for potential sample-selection bias (i.e., the possibility that the survey cohort was not representative of the original study population), we sought and were granted a Health Insurance Portability and Accountability Act waiver to ex-amine our primary and secondary outcomes in the complete cohort (see the Supplementary Ap-pendix). In the case of patients who were not in the survey cohort and who had not had an event during the interventional phase of the study, we estimate that only approximately 6% of cardio-vascular outcomes were missing from registry data (specifically, amputations for ischemic gan-grene [events that require adjudication] and strokes and heart attacks in participants younger than 65 years of age at non-VA facilities [since persons younger than 65 years of age are not included in CMS files]).
Statistical Analysis
The main analysis was performed according to the intention-to-treat principle, and Kaplan–Meier survival curves were generated by means of the product-limit method. Cox proportional-hazards modeling was used to estimate hazard ratios. Data were censored when the participants had a primary-outcome event, died, or withdrew from the study or at the end of the follow-up period for this report.
Differences in attributes between the two treatment groups were assessed with the use of the chi-square test for proportions and Student’s t-test or analysis of variance for continuous vari-ables. We prespecified three variables to exam-ine heterogeneity of treatment effects, following the approach proposed by Kent and colleagues18
— baseline cardiovascular risk (with the use of the baseline UKPDS score or the Framingham risk score),18,19 history of cardiovascular disease,
and the baseline glycated hemoglobin level. R esults
Characteristics of the Patients
Figure 1 shows the enrollment and follow-up of the patients in the VADT.20 For the primary
out-come (time to the first major cardiovascular event), complete follow-up data were available for 92.4% of the complete cohort and for 77.7% of the survey cohort. At baseline, study
partici-pants were on average older (60.5 years of age in the complete cohort) and had had diabetes for many years (mean, 11.5 years), and more than 40.0% had had a previous cardiovascular event or had a history of microvascular disease (Ta-ble 1). The characteristics at baseline were simi-lar in the intensive-therapy group and the stan-dard-therapy group in the two cohorts.
The difference in the glycated hemoglobin level between the intensive-therapy group and the standard-therapy group averaged 1.5 per-centage points during the interventional compo-nent of the trial (median level, 6.9% vs. 8.4%), but for unclear reasons the difference declined to a level closer to 1.0 percentage point in the last 6 months of the intervention. The difference in the glycated hemoglobin level declined to 0.5 percentage points 1 year after the end of the trial (7.8% in the intensive-therapy group vs. 8.3% in the standard-therapy group) and re-mained at 0.2 to 0.3 percentage points from 3 years after the end of the trial until the end of follow-up for this interim analysis (Fig. 2). No significant differences were observed between the standard-therapy group and the intensive-therapy group in blood-pressure or lipid levels either during the interventional phase of the trial or after the conclusion of that phase (Figs. S1, S2, and S3 in the Supplementary Appendix).
Primary Outcome and Secondary Outcomes
Figure 3A shows the time to the first major car-diovascular event in the two treatment groups. At 9.8 years of follow-up, 288 major cardiovascu-lar events had occurred in the standard-therapy group, as compared with 253 in the intensive-therapy group. These results indicate a signifi-cant increase in the time to a first major cardio-vascular event in the intensive-therapy group (hazard ratio, 0.83; 95% CI, 0.70 to 0.99; P = 0.04). This finding represents 8.6 major car-diovascular events prevented per 1000 person-years (or 1 event prevented per 116 person-person-years) (Fig. 3 and Table 2). Results for the individual components of the primary outcome are shown in Tables S4 and S5 in the Supplementary Ap-pendix.
Results regarding mortality are shown in Figure 3 and Table 2. No significant between-group differences were observed in either car-diovascular mortality (hazard ratio in the
inten-sive-therapy group, 0.88; 95% CI, 0.64 to 1.20; P = 0.42) or all-cause mortality (hazard ratio, 1.05; 95% CI, 0.89 to 1.25; P = 0.54).
Heterogeneity of Treatment Effects
The effect of intensive glucose control did not differ significantly between patients with lower overall cardiovascular risk and those with higher overall cardiovascular risk, as assessed by means of the UKPDS score or the Framingham risk score (P>0.20 for both comparisons) (Table S7 in the Supplementary Appendix). There was also no evidence of heterogeneity in treatment effect ac-cording to status with respect to a prior cardio-vascular event or according to baseline glycated hemoglobin level.
Sensitivity Analysis
We found no evidence of sample-selection bias. The results of the analyses that used available data regarding major cardiovascular events from the complete cohort were similar to those that used data from the survey cohort.
Discussion
The leading cause of complications and death in patients with type 2 diabetes is cardiovascu-lar disease.1-3 This extended follow-up study of
the VADT showed that a current multidrug glycemic treatment regimen can be associated with a significant reduction in major cardiovas-cular events among older patients who have had diabetes for many years. However, there was no evidence of an improved rate of overall survival after almost 12 years of follow-up.
When our results are combined with those of the three other major clinical trials of glycemic control in type 2 diabetes,7-12 a clearer picture of
the effect of improved glycemic control seems to be emerging. We found a 17% relative reduction in the rate of cardiovascular events with inten-sive therapy, as compared with standard therapy, which is similar to that observed in the fol-low-up studies of the ACCORD trial13 and the
UKPDS, after accounting for the greater reduc-tion in glycated hemoglobin level observed in the VADT.8,9 However, we found no evidence of a
reduction in total mortality even after almost 12 years of follow-up, which was similar to the re-sults of the ADVANCE study.11,14 In contrast, the
Characteristic Complete Cohort (N = 1655) Survey Cohort (N = 1391) Standard Therapy
(N = 818) Intensive Therapy (N = 837) P Value Standard Therapy (N = 688) Intensive Therapy (N = 703) P Value
Age — yr 60.5±8.6 60.5±8.8 0.85 61.1±8.6 61.1±8.8 0.99
Sex — no. (%) 0.82 0.36
Male 794 (97.1) 814 (97.3) 672 (97.7) 681 (96.9)
Female 24 (2.9) 23 (2.7) 16 (2.3) 22 (3.1)
Time since diabetes
diagnosis — yr 11.5±7.2 11.6±7.9 0.81 11.6±7.2 12.0±8.2 0.36
Previous cardiovascular
event — no. (%) 338 (41.3) 335 (40.0) 0.59 297 (43.2) 298 (42.4) 0.77
Hypertension — no./total
no. (%)† 593/816 (72.7) 604/836 (72.2) 0.85 510/687 (74.2) 504/702 (71.8) 0.31
Race or ethnic group — no. (%)‡ 0.51 0.52
Non-Hispanic white 517 (63.2) 507 (60.6) 446 (64.8) 440 (62.6)
Hispanic white 121 (14.8) 144 (17.2) 100 (14.5) 122 (17.4)
Black 141 (17.2) 141 (16.8) 112 (16.3) 108 (15.4)
Other 39 (4.8) 45 (5.4) 30 (4.4) 33 (4.7)
Glycated hemoglobin level
— % 9.5±1.6 9.4±1.5 0.45 9.4±1.6 9.4±1.4 0.44 Weight — kg 97.2±16.4 97.2±16.2 0.98 97.3±16.4 97.4±15.9 0.93 Body-mass index§ 31.1±4.4 31.3±4.4 0.61 31.1±4.4 31.3±4.3 0.49 Blood pressure — mm Hg Systolic 132±17 132±17 0.72 132±17 132±16 0.59 Diastolic 76±10 76±10 0.75 76±10 76±10 0.57 Cholesterol — mg/dl Total 184±54 182±40 0.29 183±47 181±40 0.35 Low-density lipoprotein 108±34 107±31 0.72 107±33 106±30 0.56 High-density lipoprotein 36±11 36±10 0.69 35±10 36±10 0.20 Estimated GFR¶ 82±21 82±23 0.98 81±21 81±23 0.62
Tobacco smoking status
— no./total no. (%) 0.60 0.72
Current 126/816 (15.4) 144/837 (17.2) 100/686 (14.6) 110/703 (15.6)
Past 465/816 (57.0) 468/837 (55.9) 394/686 (57.4) 397/703 (56.5)
Never 225/816 (27.6) 225/837 (26.9) 192/686 (28.0) 196/703 (27.9)
Estimated 10-yr cardio-
vascular risk‖ 0.37±0.21 0.36±0.20 0.45 0.38±0.21 0.37±0.20 0.25
* Plus–minus values are means ±SD. Data are baseline values before randomization. The group numbers are participants who have complete follow-up data in the analyses (i.e., who were followed until the end of December 2013, had a primary-outcome event, or died during active follow-up). The complete cohort included follow-up data for 92.4% of participants in the original trial. The survey cohort included partici-pants who agreed to additional data collection by means of annual surveys and periodic chart reviews, with follow-up data for 77.7% of trial participants. The P values are for the comparisons of the standard-therapy group with the intensive-therapy group. There were no significant differences between the complete cohort and survey cohort in any of the above characteristics. To convert the values for weight to pounds, multiply by 2.2. To convert the values for cholesterol to millimoles per liter, multiply by 0.02586.
† Hypertension was defined as current treatment for hypertension or a blood pressure of 140/90 mm Hg or more. ‡ Race or ethnic group was self-reported.
§ The body-mass index is the weight in kilograms divided by the square of the height in meters.
¶ The estimated glomerular filtration rate (GFR) was calculated with the use of the Modification of Diet in Renal Disease equation. ‖ The estimated 10-year cardiovascular risk was calculated with the use of the United Kingdom Prospective Diabetes Study Risk Engine.19
follow-up study of the UKPDS showed a signifi-cant reduction in mortality,21 whereas the
AC-CORD trial showed a significant increase in mortality.12
The four major clinical trials of glycemic con-trol to date have potentially important clinical heterogeneity. The VADT participants were more similar to the participants in the ACCORD trial (mean age, 62 years; mean duration of diabetes, 10 years) than to those in the UKPDS (mean age, 53 years; newly diagnosed diabetes), and the intensity of the intervention in the VADT was intermediate between these two studies. Unlike the UKPDS, in which most participants received monotherapy, the VADT added multiple glycemic medications to reduce the glycated hemoglobin level to less than 7.0%, but the intensive thera-peutic algorithm in the VADT was less aggres-sive than that used in the ACCORD trial, in which investigators tried to normalize the gly-cated hemoglobin level. Unfortunately, it is not possible to know whether this clinical heteroge-neity explains the increased mortality observed in the ACCORD trial, the lack of a treatment effect on mortality in our study, and the reduced mortality shown in the UKPDS.
In the observational follow-up of the UKPDS, the rates of microvascular and cardiovascular events remained lower in the intervention group than in the control group after the trial ended. Because glucose control had equalized in the intervention group and the control group, a legacy effect (sometimes referred to as meta-bolic memory) was postulated.20 It would be
in-correct, however, to suggest that our results support evidence of a legacy effect. First, a sub-stantive difference in the glycated hemoglobin level persisted for 2 years after the trial ended and never completely reached zero, and second, the statistical power of the study at present is insufficient to fully assess this issue. Ongoing follow-up of this cohort may help address this question.
Our results should not be interpreted as sup-porting a performance measure for evaluating the quality of care provided by clinicians and health systems that uses the proportion of pa-tients who reach a glycated hemoglobin level of less than 7.0%.21-23 Even with the support of a
dedicated research team, only approximately half the participants had a glycated hemoglobin level of less than 7.0%. In addition, in the
ab-sence of a reduction in total mortality, a small-to-moderate reduction in the rate of cardio-vascular events needs to be weighed against potential harm due to overly aggressive care and the burden, long-term safety profile, and side effects of treatment, including weight gain and hypoglycemia.
For example, Vijan and colleagues examined the net benefit of glucose lowering, assuming a 15% reduction in the rate of nonfatal cardiovas-cular events for every reduction of 1 percentage point in the glycated hemoglobin level (a slight-ly greater reduction per 1-percentage-point re-duction in the glycated hemoglobin level than that found in our study).24 They found that once
patients began taking metformin and their gly-cated hemoglobin level was less than 8.5%, the preferences of the patients were a critically im-portant factor in determining whether further glycemic treatment resulted in net benefit or net harm, especially in patients older than 55 years of age. Their results suggested that the risk–ben-efit ratio of intensive glycemic control might be better in younger patients but that the attitudes of patients regarding the burden and adverse
ef-Figure 2. Changes in Median Glycated Hemoglobin Level, According to Year since the Start of the Study.
Data are shown starting at year 3 because that was the point at which all the participants had been enrolled and had been in the study for at least 3 months. The I bars (slightly offset for better visibility) represent interquar-tile ranges. The vertical line represents the end of the interventional com-ponent of the trial and the beginning of the follow-up study period. The reason for the slight decline in the difference in glycated hemoglobin levels between the two groups that was observed in the last 6 months of the trial is unclear.
Median Glycated Hemoglobin Level (%)
10.0 8.0 9.0 7.0 6.0 4.5 5.0 8.5 9.5 7.5 6.5 5.5 0.0 0 3 5 7 9 11 13 15
Year since Start of Study
Intensive therapy Standard therapy
fects of the treatment are very relevant in all age groups once the glycated hemoglobin is less than 9.0%.24 Our results provide further
evi-dence that improved glycemic control can reduce the rate of major cardiovascular events. This potential benefit may be considered in conversa-tions with patients and balanced with the bur-dens and side-effect profile of the specific glu-cose-lowering treatment being considered.
Our study has several limitations. First, it is an observational follow-up of an unblinded, ran-domized, controlled trial. The possibility that there were differences between the two groups other than the difference in glycated hemoglo-bin levels, either during or after the trial, cannot be completely excluded. However, we found no evidence of a differential treatment effect in the follow-up period with respect to blood-pressure and lipid levels — two major modifiable cardio-vascular risk factors. Second, the survey cohort is a subgroup of the full study population and the findings in that cohort may not fully repre-sent findings for the whole cohort. However, we found no evidence of sample-selection bias. The intensive-therapy group and the standard-therapy group did not differ significantly with respect to any baseline characteristics, and a sensitivity analy-sis that used data from the complete cohort showed results very similar to the results of analy-ses that used data from the survey cohort. Finally, we had limited power to assess cardiovascular mortality, although our power to assess overall mortality was similar to that for the primary out-come.
In conclusion, we found that among patients who had been randomly assigned to intensive glucose control or standard therapy for a median of 5.6 years, the intensive-therapy group had a significant 17% relative reduction in major
car-Probability of No Event 1.00 0.75 0.50 0.25 0.00 0 4 6 8 10 12 14 Year
B Death from Cardiovascular Causes
A Primary Outcome No. at Risk Standard therapy Intensive therapy 899 892 626 650 2 732 745 475 511 352 395 126 154 Standard therapy Hazard ratio, 0.83 (95% CI, 0.70–0.99)
P=0.04
Hazard ratio, 0.88 (95% CI, 0.64–1.20) P=0.42
Hazard ratio, 1.05 (95% CI, 0.89–1.25) P=0.54 Intensive therapy Probability of Survival 1.00 0.75 0.50 0.25 0.00 0 4 6 8 10 12 14 14 Year No. at Risk Standard therapy Intensive therapy 899892 778777 2 830 830 716731 649674 276269 Standard therapy Intensive therapy
C Death from Any Cause
Probability of Survival 1.00 0.75 0.50 0.25 0.00 0 4 6 8 10 12 Year No. at Risk Standard therapy Intensive therapy 899892 778777 2 830 830 716731 649674 597610 254239 Standard therapy Intensive therapy
Figure 3. Probability Curves for Time to the First Major Cardiovascular Event and for Cardiovascular Mortality and Total Mortality.
The primary outcome was the time to the first major cardiovascular event (a composite of heart attack, stroke, new or worsening congestive heart failure, amputation for ischemic gangrene, or death from cardiovascular causes).
diovascular events, as compared with the stan-dard-therapy group, after almost 10 years of to-tal follow-up; this relative reduction represented 8.6 major cardiovascular events prevented per 1000 person-years. As compared with standard therapy, intensive glucose control was not asso-ciated with a significant decrease in all-cause mortality after almost 12 years of follow-up.
The views expressed in this article are those of the authors and do not necessarily reflect the position or policy of the De-partment of Veterans Affairs (VA) or the U.S. government.
Supported by the VA Cooperative Studies Program, a grant (P30DK092926) from the National Institute of Diabetes and
Di-gestive and Kidney Diseases, and grants from the National Insti-tutes of Health (RO1HL067690 and RO1HL094775). Support for obtaining data from the VA system or the Centers for Medicare and Medicaid Services was provided by the Information Re-source Center of VA Health Services Research and Development (Service Directed Research numbers, 02-237 and 98-004).
Dr. Reaven reports receiving grant support from AstraZeneca and Novo Nordisk and serving as a consultant for Amgen; and Dr. Emanuele, receiving lecture fees from Merck. No other po-tential conflict of interest relevant to this article was reported.
Disclosure forms provided by the authors are available with the full text of this article at NEJM.org.
We thank Carlos Abraira, William Henderson, and John Col-well for instrumental roles in the conceptualization and design of the VA Diabetes Trial; and Douglas Bentley and Tamara Paine for project management.
References
1. Fox CS, Coady S, Sorlie PD, et al. In-creasing cardiovascular disease burden due to diabetes mellitus: the Framingham Heart Study. Circulation 2007; 115: 1544-50. 2. Haffner SM, Lehto S, Rönnemaa T, Pyörälä K, Laakso M. Mortality from cor-onary heart disease in subjects with type 2 diabetes and in nondiabetic subjects with and without prior myocardial infarc-tion. N Engl J Med 1998; 339: 229-34. 3. Duckworth WC, McCarren M, Abraira C. Glucose control and cardiovascular complications: the VA Diabetes Trial. Dia-betes Care 2001; 24: 942-5.
4. Khaw KT, Wareham N, Bingham S, Luben R, Welch A, Day N. Association of hemoglobin A1c with cardiovascular dis-ease and mortality in adults: the Europe-an prospective investigation into cEurope-ancer in Norfolk. Ann Intern Med 2004; 141: 413-20. 5. Kirkman MS, McCarren M, Shah J, Duckworth W, Abraira C. The association between metabolic control and prevalent macrovascular disease in type 2 diabetes:
the VA Cooperative Study in diabetes. J Diabetes Complications 2006; 20: 75-80. 6. Selvin E, Marinopoulos S, Berkenblit G, et al. Meta-analysis: glycosylated he-moglobin and cardiovascular disease in diabetes mellitus. Ann Intern Med 2004; 141: 421-31.
7. Control Group, Turnbull FM, Abraira C, et al. Intensive glucose control and macrovascular outcomes in type 2 diabe-tes. Diabetologia 2009; 52: 2288-98. 8. UK Prospective Diabetes Study (UKP-DS) Group. Intensive blood-glucose con-trol with sulphonylureas or insulin com-pared with conventional treatment and risk of complications in patients with type 2 diabetes (UKPDS 33). Lancet 1998; 352: 837-53.
9. UK Prospective Diabetes Study (UKP-DS) Group. Effect of intensive blood-glu-cose control with metformin on compli-cations in overweight patients with type 2 diabetes (UKPDS 34). Lancet 1998; 352: 854-65.
10. Duckworth W, Abraira C, Moritz T, et al. Glucose control and vascular compli-cations in veterans with type 2 diabetes. N Engl J Med 2009; 360: 129-39.
11. The ADVANCE Collaborative Group. Intensive blood glucose control and vas-cular outcomes in patients with type 2 diabetes. N Engl J Med 2008; 358: 2560-72. 12. Gerstein HC, Miller ME, Byington RP, et al. Effects of intensive glucose lowering in type 2 diabetes. N Engl J Med 2008; 358: 2545-59.
13. Gerstein HC, Miller ME, Ismail-Beigi F, et al. Effects of intensive glycaemic con-trol on ischaemic heart disease: analysis of data from the randomised, controlled ACCORD trial. Lancet 2014; 384: 1936-41. 14. Zoungas S, Chalmers J, Neal B, et al. Follow-up of blood-pressure lowering and glucose control in type 2 diabetes. N Engl J Med 2014; 371: 1392-406.
15. Petersen LA, Wright S, Normand SL, Daley J. Positive predictive value of the di-agnosis of acute myocardial infarction in
Outcome Standard Therapy Intensive Therapy Hazard Ratio (95% CI) P Value
Events Rate Events Rate
no. of participants/
total no. person-yrper 1000 no. of participants/total no. person-yrper 1000
Primary outcome: major
cardiovascular event 288/688 52.7 253/703 44.1 0.83 (0.70–0.99) 0.04
Secondary outcomes Death from cardiovascular
causes 83/818 11.3 74/837 10.0 0.88 (0.64–1.20) 0.42
Death from any cause 258/818 30.3 275/837 32.0 1.05 (0.89–1.25) 0.54
* The primary outcome was the time to the first major cardiovascular event (a composite of heart attack, stroke, new or worsening congestive heart failure, amputation for ischemic gangrene, or death from cardiovascular causes) and was analyzed in the survey cohort. Mortality out-comes were analyzed in the complete cohort.
an administrative database. J Gen Intern Med1999; 14: 555-8.
16. Kiyota Y, Schneeweiss S, Glynn RJ, Cannuscio CC, Avorn J, Solomon DH. Ac-curacy of Medicare claims-based diagno-sis of acute myocardial infarction: esti-mating positive predictive value on the basis of review of hospital records. Am Heart J 2004; 148: 99-104.
17. Pocock SJ. Clinical trials with multi-ple outcomes: a statistical perspective on their design, analysis, and interpretation. Control Clin Trials 1997; 18: 530-45. 18. Kent DM, Rothwell PM, Ioannidis JP, Altman DG, Hayward RA. Assessing and
reporting heterogeneity in treatment ef-fects in clinical trials: a proposal. Trials 2010; 11: 85.
19. University of Oxford Diabetes Trials Unit. UKPDS risk engine (https:/ / www .dtu .ox .ac .uk/ riskengine).
20. Holman RR, Paul SK, Bethel MA, Matthews DR, Neil HA. 10-Year follow-up of intensive glucose control in type 2 dia-betes. N Engl J Med 2008; 359: 1577-89. 21. Hayward RA, Hofer TP, Kerr EA, Krein SL. Quality improvement initia-tives: issues in moving from diabetes guidelines to policy. Diabetes Care 2004; 27: Suppl 2: B54-B60.
22. Pogach LM, Rajan M, Aron DC. Com-parison of weighted performance mea-surement and dichotomous thresholds for glycemic control in the Veterans Health Ad-ministration. Diabetes Care 2006; 29: 241-6. 23. Hayward RA. All-or-nothing treatment targets make bad performance measures. Am J Manag Care 2007; 13: 126-8. 24. Vijan S, Sussman JB, Yudkin JS, Hay-ward RA. Effect of patients’ risks and preferences on health gains with plasma glucose level lowering in type 2 diabetes mellitus. JAMA Intern Med 2014; 174: 1227-34.