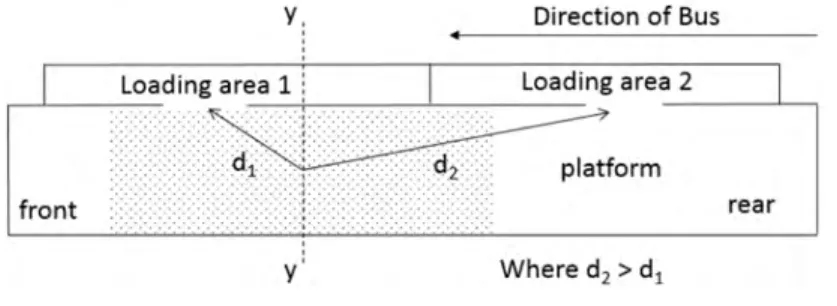
Examining Bus Lost Time Dynamics for a Bus Rapid Transit Station
Full text
Figure
Related documents
• Pilot response times against Corrective alerts ~5sec faster than observed in Phase 1; no difference observed for Warning alerts. – Closer proximity at
Na figura 5C foram apresentados os dados de vazão por área de vegetação natural, onde o ribeirão São Tomás apresenta os maiores valores de vazão do rio por
We then summarize the empirical findings to date on how marketing creates shareholder value, including the impact of brand equity, customer equity, customer satisfaction, R&D
Results indicate that Cash Dividend, Retention Ratio and Return on Equity has significant positive relation with stock market prices and significantly explains the variations in
6 , with the proper selection of the spread constant value, the trained GRNN calculated the 60 energy bins values of the spectrum, said values are around the target value (the
In that case, we suggest to choose a set of candidate nodes and then see, for each one of them, if there is a well defined bi-ego-centered community containing node1 that emerges
A lower altitude gave the highest overall accuracy for thematic maps, and best represented the most habitats in a seascape through a high classification performance, measured by
