Field Implementation,
Testing, and Refinement
of Density Based Coordinated
Ramp Control Strategy
John Hourdos, Principal Investigator Minnesota Traffic Observatory
Department of Civil, Environmental, and Geo- Engineering University of Minnesota
June 2015
Research Project Final Report 2015-37To request this document in an alternative format call 651-366-4718 or 1-800-657-3774 (Greater Minnesota) or email your request to [email protected]. Please request at least one week in advance.
Technical Report Documentation Page
1. Report No. 2. 3. Recipients Accession No.
MN/RC 2015-37
4. Title and Subtitle 5. Report Date
Field Implementation, Testing, and Refinement of Density
Based Coordinated Ramp Control Strategy June 20156.
7. Author(s) 8. Performing Organization Report No.
John Hourdos, Nikolas Geroliminis, Stephen Zitzow, and Ypatia
Stefania Limniati
9. Performing Organization Name and Address 10. Project/Task/Work Unit No.
Minnesota Traffic Observatory
Department of Civil, Environmental, and Geo- Engineering University of Minnesota
500 Pillsbury Drive SE Minneapolis, MN 55455-0220
CTS # 2012059
11. Contract (C) or Grant (G) No.
(c) 99008 (wo) 57
12. Sponsoring Organization Name and Address 13. Type of Report and Period Covered
Minnesota Department of Transportation Research Services & Library
395 John Ireland Boulevard, MS 330 St. Paul, Minnesota 55155-1899
Final Report
14. Sponsoring Agency Code
15. Supplementary Notes
http://www.lrrb.org/pdf/201537.pdf
16. Abstract (Limit: 250 words)
In the Twin Cities metropolitan area, freeway ramp metering goes back as early as 1969, when the Minnesota Department of Transportation (MnDOT) first tested ramp metering in an I-35E pilot project. To date, the Twin Cities ramp metering system has grown to include more than 433 ramp meters. Research on better, improved ramp control strategies has continued over the years and MnDOT has implemented minor and major changes in the control logic. Two independent studies both aimed at developing the next generation in ramp metering by focusing on density. Based on these efforts, two new algorithms were developed: the UMN Density and the UMD KAdaptive, named based on the campus at which they were developed. The goal of this project was to implement both algorithms and test them under real conditions. Priorities and technical problems prevented the evaluation of the UMN algorithms, so this report focuses on the evaluation of the UMD KAdaptive algorithm on two freeway corridors in the Twin Cities, MN. The first site, a section of TH-100 northbound between 50th Street and I-394, was
selected to compare the then current logic, the Stratified Zone algorithm, with the new one. During the course of this project, the UMD algorithm eventually replaced the Stratified Zone algorithm and was implemented in the entire system. This full deployment also included corridors that were not controlled before. The second evaluation site on eastbound TH-212 was a site that allowed for a with/without control evaluation of the UMD algorithm. This report describes the experiments conducted at both sites and includes a comprehensive review of the state of ramp metering strategies around the world to date.
17. Document Analysis/Descriptors
Ramp metering, Freeway management systems, Interrupted flow, Traffic density
18. Availability Statement
No restrictions. Document available from: National Technical Information Services, Alexandria, Virginia 22312
19. Security Class (this report) 20. Security Class (this page) 21. No. of Pages 22. Price
Field Implementation, Testing, and Refinement of Density
Based Coordinated Ramp Control Strategy
Final Report
Prepared by:
John Hourdos Stephen Zitzow
Minnesota Traffic Observatory
Department of Civil Environmental and Geo- Engineering University of Minnesota
Nikolas Geroliminis Ypatia Stefania Limniati
Ecole Polytechnique Federale de Lausanne (EPFL)
June 2015
Published by:
Minnesota Department of Transportation Research Services & Library 395 John Ireland Boulevard, MS 330
St. Paul, Minnesota 55155-1899
This report represents the results of research conducted by the authors and does not necessarily represent the views or policies of the Minnesota Department of Transportation, the University of Minnesota or the Ecole Polytechnique Federale de Lausanne. This report does not contain a standard or specified technique.
The authors, the Minnesota Department of Transportation, the University of Minnesota, and the Ecole Polytechnique Federale de Lausanne do not endorse products or manufacturers. Any trade or manufacturers’ names that may appear herein do so solely because they are considered essential to this report.
Acknowledgments
We would like to thank the Minnesota Department of Transportation for supporting this project. We would like to acknowledge the help, support, and cooperation of Brian Kary and Jesse Larson at the RTMC. We also would like to acknowledge the help received from the staff of the Minnesota Traffic Observatory in collecting the data used in this research, and the undergraduate students who helped extract the information from the video recordings.
Table of Contents
1 Introduction ... 1
2 An Overview of Ramp Metering Operations and Research ... 3
2.1 Ramp Metering Algorithms ... 3
2.2 Ramp Metering Status in the US ... 6
2.3 Ramp Metering Status in Europe ... 10
2.3.1 Ramp Metering Status in the UK ... 12
2.3.2 Ramp Metering Status in France... 12
2.3.3 Ramp Metering Status in the Netherlands ... 13
2.3.4 Ramp Metering Status in Germany... 15
2.4 Ramp Metering Status in Australia ... 15
3 Preparation for the field deployment ... 16
3.1 Implementation of the UMN Density algorithm in IRIS ... 16
3.2 Preparation of the MTO Traffic Surveillance and Detection Stations ... 17
3.3 Field Deployment Region ... 19
3.3.1 Specific Observation Locations ... 20
4 Reduction of Video Data and Collection of Traffic Measurements ... 29
4.1 Video Data Collected on TH-100... 29
4.2 Travel Time Measurement collection and analysis methodology ... 34
4.3 Loop Detector Traffic Measurements and analysis methodology ... 35
4.3.1 Description of Methodology ... 40
5 TH-100 Field Experiment Results ... 44
5.1 Travel Time based comparison ... 44
5.1.1 June 3rd and June 10 ... 44
5.1.2 June 4th and June 11th ... 48
5.2 Loop Detector based Comparison ... 51
5.2.1 Day Pair of May 22nd and May 29th ... 56
6 Evaluation of Ramp Metering Implementation on TH-212 ... 63
6.1 Analysis Corridor and Data Sources ... 63
6.2 Travel Time Analysis ... 65
6.2.1 Selection of Correlated Days ... 68
6.3 Delay Analysis ... 71
6.3.2 Delay from HART Data ... 71
6.4 Sample Output Data and Figures ... 71
6.5 Results ... 75
6.5.1 Total Travel Time Analysis Results ... 75
6.5.2 Delay Analysis Results ... 88
7 Conclusions ... 97
8 References ... 99 Appendix A - Figures for TH-100 Analysis
List of Figures
Figure 2-1. Ramp metering algorithms [Zhang et al., 2001]. ... 5
Figure 3-1. TH-100 simulated network for testing the UMN Density Algorithm. ... 16
Figure 3-2. MTO portable traffic observation station deployed along HW-280. ... 18
Figure 3-3. Region of interest for ramp metering field test. ... 19
Figure 3-4. Site 1 overview images. ... 20
Figure 3-5. Site 2 overview images. ... 21
Figure 3-6. Site 3 overview images. ... 22
Figure 3-7. Site 4 overview images. ... 23
Figure 3-8. Site 5 overview images. ... 24
Figure 3-9. Site 6 overview images. ... 25
Figure 3-10. Site 7 overview images. ... 26
Figure 3-11. Site 8 overview images. ... 27
Figure 3-12. Site 9 overview images. ... 28
Figure 4-1. Data collection locations: (blue) is video, (black) loop stations. ... 31
Figure 4-2. Sample images from each video collection location: (a) 50th Street, (b) Pedestrian Bridge, (c) Auto Club Way, (d) 36th Street, (e) Greenway, (f) Tree, (g) Minnetonka... 32
Figure 4-3. Example of one Autoscope detector layout for 50th Street. ... 34
Figure 4-4. Travel time graphs before and after interpolation. ... 37
Figure 4-5. Station to station travel time graphs. ... 38
Figure 4-6. Example fundamental diagram in a merge location. ... 41
Figure 5-1. Station to station travel time graphs for June 3 (SZM) and June 10 (UMD). ... 45
Figure 5-2. Station to station travel time graphs for June 3 and June 10 (continued). ... 46
Figure 5-3. Travel time surface for June 3rd (SZM) and June 10th (UMD). ... 47
Figure 5-4. Station to station travel time graphs for June 4 (SZM) and June 11 (UMD). ... 48
Figure 5-5. Station to station travel time graphs for June 4 and June 11 (continued). ... 49
Figure 5-6. Travel time surface for June 4th (SZM) and June 11th (UMD). ... 50
Figure 5-7. Average flow versus average occupancy measured at the ramps for each day in the morning. ... 55
Figure 5-8. Average flow versus average occupancy measured at the ramps for each day in the afternoon. ... 56
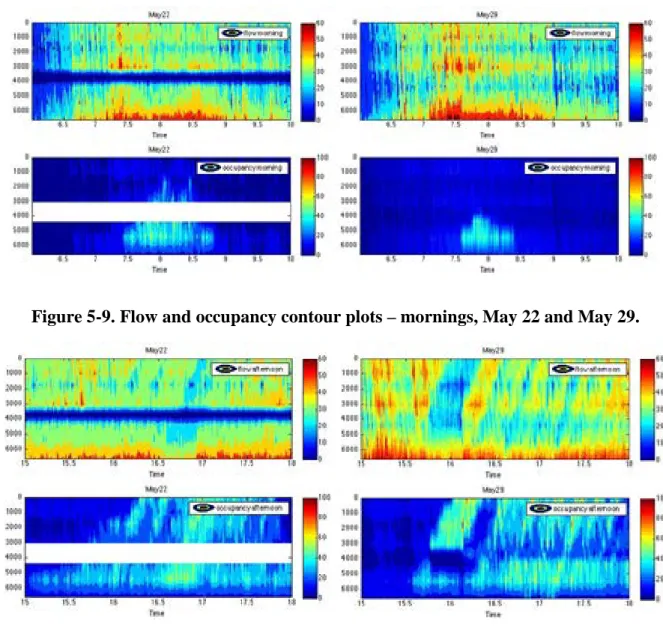
Figure 5-9. Flow and occupancy contour plots – mornings, May 22 and May 29. ... 57
Figure 5-10. Flow and occupancy contour plots – afternoons, May 22 and May 29. ... 57
Figure 5-11. Mainline flow and occupancy at the active bottleneck - mornings, May 22 (SZM) and May 29 (UMD). ... 58
Figure 5-12. Flow (passage detector 2022) and occupancy (queue detector 3652) downstream of the active bottleneck – mornings, May 22 (SZM) and May 29 (UMD). ... 59
Figure 5-13. Mainline flow and occupancy at the active bottleneck – afternoons, May 22 (SZM) and May 29 (UMD). ... 60
Figure 5-14. Flow (passage detector 2022) and occupancy (queue detector 3652) downstream of the active bottleneck – afternoons, May 22 (SZM) and May 29 (UMD). ... 61
Figure 5-15. Total throughput (mainline upstream and ramp) versus occupancy (only mainline upstream) – mornings, May 22 (SZM) and May 29 (UMD). ... 61
Figure 5-16. Total throughput (mainline upstream and ramp) versus occupancy (only mainline upstream) – afternoons, May 22 (SZM) and May 29 (UMD). ... 62
Figure 6-1. TH-212 corridor diagram indicating contiguous segments. ... 64
Figure 6-2. Sample calculation figure for Segment Z. ... 65
Figure 6-3. Ramp queue adjustment methodology illustrated as three curves. ... 67
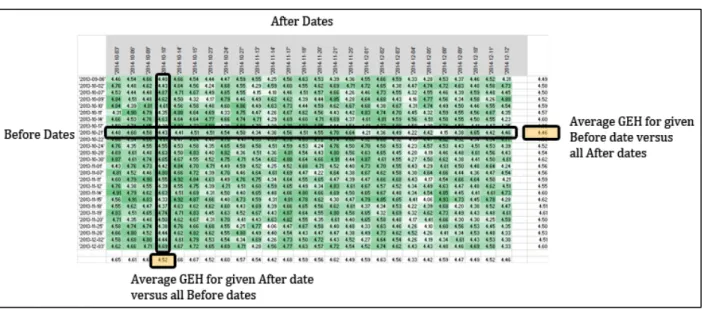
Figure 6-4. GEH statistic averaging to identify best-matching date clusters. ... 69
Figure 6-5. GEH meta-statistics through the date winnowing process. ... 70
Figure 6-6. Sample contour plot figure for TH-212 corridor... 72
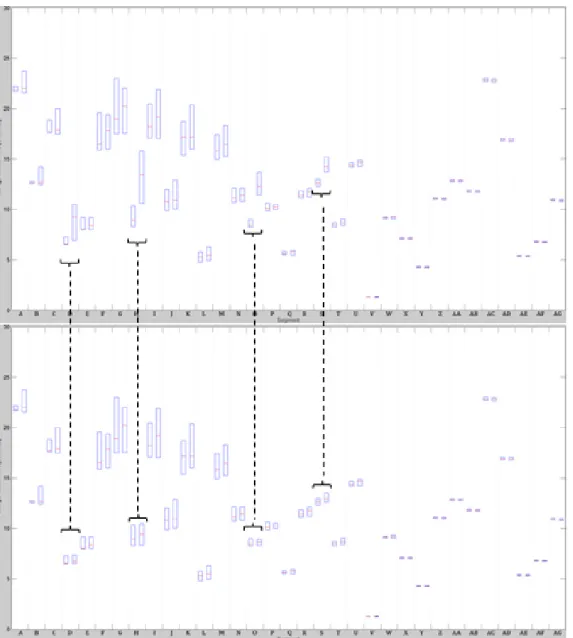
Figure 6-7. Average travel time by segment. ... 73
Figure 6-8. Average travel time between stations. ... 74
Figure 6-9. Example speed contour plot from a heavy-congestion day. ... 77
Figure 6-10. Average travel time in seconds for 'All Correlated Days' by segment. ... 78
Figure 6-11. Average travel time in seconds for 'All Correlated Days' by station. ... 79
Figure 6-12. Average travel time in seconds for 'Correlated Days with Normal Congestion' by segment. ... 80
Figure 6-13. Average travel time in seconds for 'Correlated Days with Normal Congestion' by station. ... 81
Figure 6-14. Average travel time in seconds for 'Worst Congestion Days' by segment... 82
Figure 6-15. Average travel time in seconds for 'Worst Congestion Days' by station. ... 83
Figure 6-16. Boxplot of delay from vehicles under 65 MPH in vehicle-hours by segment. ... 89
Figure 6-17. Medians of delay from vehicles under 65 MPH in vehicle-hours by segment. ... 90
Figure 6-18. Boxplot of delay from vehicles under 55 MPH in vehicle-hours by segment. ... 91
Figure 6-19. Medians of delay from vehicles under 55 MPH in vehicle-hours by segment. ... 92
Figure 6-20. Boxplot of delay from vehicles under 45 MPH in vehicle-hours by segment. ... 93
Figure 6-21. Medians of delay from vehicles under 45 MPH in vehicle-hours by segment. ... 94
List of Tables
Table 2-1. Ramp metering systems in the United States as of 1995 [ITSA, 1995]. ... 7Table 2-2. Benefits of ramp meters [Piotrowicz and Robinson, 1995]. ... 10
Table 2-3. Evaluations of ramp metering systems [Kang and Gillen, 1999]. ... 11
Table 4-1. Video reduced by Autoscope... 33
Table 4-2. Detector IDs, types, and distances expressed in meters. ... 39
Table 4-3. Relabeled mainline detectors. ... 39
Table 5-1. Average flows of mainline loop detectors during morning peak. ... 52
Table 5-2. Average occupancies of mainline loop detectors during morning peak. ... 52
Table 5-3. Average flows and occupancies on entrance ramp during morning peak. ... 53
Table 5-4. Average flows of mainline loop detectors during afternoon peak. ... 54
Table 5-5. Average occupancies of mainline loop detectors during afternoon peak. ... 54
Table 5-6. Average flows and occupancies on entrance ramp during afternoon peak. ... 55
Table 6-1. Segment travel time statistics: A to L... 84
Table 6-2. Segment travel time statistics: M to X. ... 85
Table 6-3. Segment travel time statistics: Y to AG. ... 86
Table 6-4. Station to station travel time statistics. ... 87
Table 6-5. TICAS delay results. ... 88
Table 6-6. Delay within the ramp-controlled region and entire corridor with and without ramp delay. ... 96
EXECUTIVE SUMMARY
In the Twin Cities metropolitan area, freeway ramp metering goes back as early as 1969, when the Minnesota Department of Transportation (MnDOT) first tested ramp metering in an I-35E pilot project. To date, the Twin Cities ramp metering system has grown to include more than 433 ramp meters. Some operate only in the morning peak (5:30 a.m.–9:00 a.m.), some only during the afternoon peak (2:00 p.m.–6:30 p.m.), and others during both peaks. The ramp metering strategy employed by MnDOT has evolved over the years with some notable changes. Prior to year 2000, the deployed control strategy—the ZONE Metering strategy (Lau, 1996)—focused on maximizing freeway capacity utilization without handling ramp queue spillbacks and controlling ramp waiting times. By 2003, MnDOT had developed a new strategy aiming to strike a balance between freeway efficiency and reduced ramp delays. This new strategy, termed Stratified Zone Metering (SZM), took into account not only freeway conditions but also real-time ramp demand and queue size information (Xin et al.,2004).
Research on better, improved ramp control strategies has continued. More algorithms were implemented by other DOTs in the U.S. and abroad and a similar increase took place on the number of new algorithms proposed by researchers. A review of the most well-known cases is included in this report. While the aforementioned MnDOT control strategies primarily work with volume/capacity information, a different family of algorithms utilizes mainline density as the control variable. Specifically, two independent studies were performed in Minnesota, both aimed at developing the next generation in ramp metering by focusing on density. First, the “Development of the Next Generation Stratified Ramp Metering Algorithm Based on Freeway Density” project was performed by Geroliminis et al. (2011) at the U of M Twin Cities. The second, “Development of Freeway Operational Strategies with IRIS-in-Loop Simulation,” was performed at the U of M- Duluth by Kwon et al. (2012). In both projects, the proposed density-based algorithms—termed the UMN Density and UMD KAdaptive algorithms—were tested through simulation and found superior to the SZM algorithm. Based on these preliminary results, MnDOT decided to test and evaluate the two algorithms in the field.
The project presented in this report was performed by the Minnesota Traffic Observatory (MTO), which was called to assist in the deployment of the two density-based ramp control strategies and to design and execute a field test involving all three ramp metering strategies: Stratified Zone Metering, serving as base conditions, and the two new density-based algorithms. A section of TH-100 northbound between 50th Street and I-394 was selected as the first study site. During the course of this project, multiple problems, operational issues, and unfortunate timing altered the original project goals and priorities. Although great effort was spent to integrate the UMN algorithm with the IRIS traffic operations system and deploy it in the field, an analysis of its performance based on the collected data was not completed because it was later discovered that the geometry of TH-100 did not allow for proper operation of the control algorithm. Although all three algorithms were affected by the peculiar geometry and detector layout of this section of TH-100, the UMN algorithm was the one most affected. Unfortunately, when this issue was discovered it was too late to switch test sites, and it was decided that the
TH-100 evaluation would only include the UMD algorithm. In addition, separately from this project MnDOT also run tests of the UMN algorithms on sections of Hwy-77 and I-35W with also poor results.
Later, during 2013 and 2014, the UMD algorithm underwent adjustments and was implemented on most of the ramp metering system. One specific location involves a recently reconstructed section of TH-212 in the southwest corner of the metro area. TH-212 was not controlled in the past and started being controlled by the UMD KAdaptive algorithm in the summer of 2014. MnDOT modified the scope of this project to include a before–after evaluation of the ramp metering system on TH-212.
Two types of analysis were performed for the evaluation of the new density ramp metering on TH-100: an analysis based on travel time data and an analysis based on loop detector data. Both methodologies compared traffic measurements between pairs of days with similar traffic and environmental conditions. The manually collected travel times show that during the PM period under the SZM control a shorter congested period developed in terms of time compared to the PM period under the UMD algorithm. Regardless, the congestion under the SZM seems to be stable with no evidence of recovery while the congestion under the UMD algorithm shows evidence of recovery, supporting the assumption that the control managed to recover from the heavy congestion, albeit briefly. Focusing on more detail, it can be noted that the congestion under the UMD algorithm seems to be more stable while the congestion under the SZM has great fluctuations for the entire length of the site, indicating the presence of shockwaves. This can indicate that the UMD algorithm, although handling more demand, was able to meter steadily while the SZM was closer to the tipping point and got trapped in a series of restrict and dump cycles. Both algorithms show greater instability closer to the bottleneck with the UMD algorithm keeping conditions in the mainline more fluid upstream compared to the SZM. The UMD algorithm seems to handle the large demand ramp of TH-7 better, and conditions immediately upstream of it are less congested. One other observation is that the UMD algorithm shows some sharp spikes of very large travel time, which could represent short-lived heavy congestion conditions from which the control is able to recover.
The loop detector data analysis on TH-100 show that the UMD KAdaptive metering strategy performs better than the SZM when conditions on TH-100 are not extremely congested. The UMD algorithm allows on average more vehicles to flow into the mainline and keeps the on-ramp occupancy relatively low. In the mainline, the flows are also higher with the UMD algorithm and in 3 out of 5 day-pairs investigated the speeds are also higher. In general, for the same occupancy, the flows are less when the SZM algorithm is applied. The main reason is that the UMD algorithm is more protective in the morning and queue detector occupancies are lower. Thus, the queue violation is not activated as often and the ramp metering is active (and successful) for longer time periods.
In the before–after analysis of the UMD KAdaptive algorithm on TH-212, we see that in terms of total travel time there are small gains from ramp metering. Focusing on the delays, which represent the gains to the traveling public from avoiding congestion, we see that an approximate 12% reduction in delay and a 3% increase in VMT is observed when considering only the
metered part of TH-212. These gains are reduced when the entire corridor is considered because the metering seems to spread lower speeds farther upstream but no severe congestion. When the ramp delays are included, we see an overall increase in delay with ramp metering indicating that with the present strategy (only four meters active), the gains on the mainline are not big enough to offset the delays accumulated in the ramps.
1
1
I
NTRODUCTION
Continuous urban sprawl and reliance on automobiles as a primary mode of transportation has led to a national increase in traffic congestion; from 1980 to 2010, there was a 77% increase in vehicle miles traveled nationally, compared to only a 6% increase in road mileage (Office of Highway Policy Information, 2013). This issue has been particularly noticeable in Minnesota, where only 20% of the Minneapolis-St. Paul metropolitan area population lives in one of the core cities (United States Census Bureau, 2014). In addition, travel per licensed driver and vehicles per person are 21% and 17% higher in Minnesota than the national averages, respectively (Office of Highway Policy Information, 2013).
Freeways by design are expected to be free-flowing and provide the desired level of service. In recent years, however, it is not uncommon for freeway traffic to become highly congested, even reach a stop-and-go state during peak periods. Of the various measures intended to alleviate freeway congestion, ramp control has been increasingly recognized as one of the most effective and viable strategies since its first deployment in the 1960s. In effect, the function of ramp control is (1) to limit the entering traffic from exceeding the operational freeway capacity and (2) to provide more efficient and safer merging at the freeway entrance by breaking up vehicle platoons. The benefits of ramp control reported in the literature include improved use of freeway capacity, increased throughput and freeway average speed, alleviated congestion, reduced system travel time as well as environmental benefits (Arnold, 1998; Cambridge Systematics, 2001; Elefteriadou, 1997; Papageorgiou et al., 1997; Taylor et al., 1996; Zhang and Levinson, 2003). In the Twin Cities metropolitan area, freeway ramp metering goes back as early as 1969, when the Minnesota Department of Transportation (MnDOT) first tested ramp metering in a I-35E pilot project. To date, the Twin Cities ramp metering system has grown to include 433 ramp meters. Some operate only in the morning peak (5:30 a.m. - 9:00 a.m.), some only during the afternoon peak (2:00 p.m. - 6:30 p.m.), and others during both peaks. The ramp metering strategy employed by MnDOT has evolved over the years with some notable changes. Prior to year 2000, the deployed control strategy, i.e., the ZONE Metering strategy (Lau, 1996), focused on maximizing freeway capacity utilization without handling ramp queue spillbacks and controlling ramp waiting times. With this strategy, breakdowns at freeway bottlenecks can be effectively prevented; yet ramp delays and queues were often excessive. (Cambridge Systematics, 2001; Hourdakis and Michalopoulos, 2002). The latter resulted in public concerns, leading to a six-week system-wide shutdown study in late 2000. The study confirmed the overall benefits of the ZONE strategy; however, it also “highlighted the need for modifications towards an efficient but more equitable ramp control algorithm” (Cambridge Systematics, 2001). In response, MnDOT developed a new one aiming to strike a balance between freeway efficiency and reduced ramp delays. This new strategy, termed Stratified Zone Metering (SZM), took into account not only freeway conditions but also real time ramp demand and queue size information (Xin et al.,2004). Implementation of the new strategy with the Twin Cities freeway system began in early 2002; full deployment was completed in 2003.
2
Research on better, improved ramp control strategies has continued. While the aforementioned control strategies primarily work with volume/capacity information, a different family of algorithms utilize mainline density as the control variable. Two independent studies, both aimed in developing the next generation in ramp metering by focusing on density, were performed. The first by Geroliminis et al. 2011 in the “Development of the Next Generation Stratified Ramp Metering Algorithm Based on Freeway Density” project performed at the U of M- Twin Cities and the second by Kwon et al., 2012 in the “Development of Freeway Operational Strategies with IRIS-in-Loop Simulation” project performed at the U of M- Duluth. In both projects the proposed Density based algorithms, for short termed the UMN Density and UMD KAdaptive algorithms, were tested through simulation and found superior to the Stratified Zone metering algorithm. Based on these preliminary results, MnDOT decided to test and evaluate the two algorithms in the field.
The project presented in this report was performed by the Minnesota Traffic Observatory (MTO) which was called to assist in the deployment of the UMN algorithm, oversee the deployment of the UMD algorithm, and design and execute a field test involving all three ramp metering strategies, the Stratified, serving as base conditions vs the two density based algorithms. A section of TH-100 northbound between 50th Street and I-394 was selected as the deployment site. During the course of this project a lot of problems, operational issues, and simple bad timing had altered the project original goals and priorities. Although the UMN algorithm was integrated with the IRIS traffic operations system and was deployed in the field, analysis of its performance based on the collected data was not completed because it was later discovered that the geometry of TH-100 did not allow the correct operation of the control algorithm. Although all three algorithms were affected by the peculiar geometry and detector layout of this section of TH-100, the UMN algorithm was the one affected the most. Unfortunately, when this issue was discovered it was too late to switch test sites and it was decided to press on and only include the UMD algorithm in the evaluation. In addition, separately from this project MnDOT also run tests of the UMN algorithms on sections of Hwy-77 and I-35W with also poor results. During 2013 and 2014 the UMD algorithm underwent adjustments and has been implemented on most of the ramp metering system. One specific location involves a recently reconstructed section of TH-212 in the Southwest corner of the metro area. TH-212 was not controlled in the past and started been controlled by the UMD KAdaptive algorithm the summer of 2014. MnDOT modified the scope of this project to include a before/after evaluation of the ramp metering system on TH-212. In summary, this report first covers a comprehensive review of the state of ramp metering strategies to date. It continues with a description of the selected site in TH-100 and the data collection layout deployed as well as with a description of the conducted field deployment of the two new density based algorithms. The results and comparison of the performance of the UMD KAdaptive based algorithm against the Stratified control are presented next followed by a before/after study of the UMD control on TH-212. Finally some overall conclusions are presented highlighting the lessons learned both during the implementation of the control algorithms as well as during the field test on TH-100.
3
2
A
N
O
VERVIEW OF
R
AMP
M
ETERING
O
PERATIONS AND
R
ESEARCH
The first task in the project presented in this report was to conduct a thorough review of the state-of-practice as well as state-of-the-art in ramp metering. The chapter starts with a description of the different ramp metering families and representative algorithms followed by the status of ramp metering in the United States and Europe.
2.1
R
AMPM
ETERINGA
LGORITHMSRamp metering algorithms can be mainly divided into three categories; fixed-time strategies (local and system-wide), local traffic responsive strategies and system-wide traffic responsive strategies.
1. Fixed-time control: Fixed time control strategies are implemented based on historical demand for particular times of day. They do not consider real-time measurements, and they are not adaptive systems. The objective criterion in the fixed time control case is to maximize number of served vehicles or total traveled distance considering the capacity constraints on the freeway and on the ramp. Nevertheless, as the metering rates are based on historical data, these systems are not able to produce efficient strategies in case of varying demands due to special events or incidents, and they are not able to adapt to traffic conditions on the freeway. Note that fixed-time control can be applied in either local or system-wide level, although system-wide fixed-time control is very rarely used.
2. Local traffic responsive control: Local control strategies compute ramp metering rate based on traffic conditions at the adjacent freeway section only. In contrast to fixed time control strategy, reactive ramp metering considers real-time measurements and computes metering rate based on downstream capacity. The primary reactive ramp control is demand-capacity strategy, which is described as follows:
𝑞𝑐𝑎𝑝 − 𝑞𝑖𝑛(𝑘 −1) 𝑖𝑓 𝑜(𝑘 −1)≤ 𝑜
𝑟(𝑘) =� 𝑐𝑟 Eq. 2-1
𝑟𝑚𝑖𝑛 𝑜𝑡ℎ𝑒𝑟𝑤𝑖𝑠𝑒
where 𝑞𝑐𝑎𝑝 is freeway capacity at downstream of ramp, 𝑞𝑖𝑛(𝑘 −1) is the flow measurement at the previous time interval, 𝑜(𝑘 −1) is freeway occupancy measurement at downstream of the ramp, 𝑜𝑐𝑟 is the critical occupancy value where freeway flow at downstream of ramp reaches its maximum, and 𝑟𝑚𝑖𝑛 is the minimum allowed ramp metering rate. Basically, this
strategy computes as high metering rates as necessary to reach capacity flow at the freeway section downstream of ramp. However, if 𝑜(𝑘 −1) exceeds 𝑜𝑐𝑟, ramp metering rate is
reduced to the minimum allowed level to dissipate the congestion. This open-loop strategy is converted to a closed-loop policy, known as ALINEA, by Papageorgiou et al. (1991). The new feedback control law reads as follows:
4
where K is a regulator parameter, and ALINEA’s performance is not very sensitive to its choice. Other local ramp metering strategies are reviewed in Papageorgiou and Kotsialos (2002).
3. System-wide (area-wide) traffic responsive algorithm: This refers to the control of a series of ramps in conjunction considering the interdependency between them. The aim of area-wide ramp control is to optimize the traffic flow over a freeway stretch, rather than a specific location. They can be divided into three groups regarding the way they are implemented (Zhang et al., 2001).
• Cooperative algorithms: The ramp metering rate computed by local strategies is further adjusted in this method to avoid congestion at the freeway stretch. The adjustment of metering rates is mainly done using heuristics in an ad hoc way. Examples of these algorithms are HELPER (Lipp et al., 1991) and Linked-Ramp (Banks, 1993).
• Competitive algorithms: In these algorithms, ramp metering rate is calculated using both local and area-wide strategies, and the most restrictive one is implemented. This rate can also be further adjusted using some heuristics. Examples of competitive algorithm are Zone (Stephanedes, 1994), Bottleneck (Jacobson et al., 1989) and SWARM (Paesani et al., 1997) algorithms.
• Integral algorithms: In these algorithms, metering rates at multiple ramp locations are computed to optimize the objective function (e.g. total travel time, throughput of the section) which represents the performance of the whole freeway stretch. They can also consider system constraints such as maximum allowable ramp queue, bottleneck capacity, etc. This group of algorithms is the most appealing regarding the problem design. However, they call for a sophisticated design procedure which is more demanding in computation. These algorithms can be implemented in a reactive way, considering the measurements from the previous time interval, or in a proactive way, considering demand predictions. Examples of integral algorithms are METALINE (Papageorgiou et al., 1990), fuzzy logic (Meldrum and Taylor, 1995) and MILOS (Ciarallo and Mirchandani, 2002).
Zhang et al. (2001) developed a ramp metering evaluation framework using microscopic simulation environment and compared the performances of 4 important ramp metering algorithms; ALINEA, Bottleneck, SWARM and Zone algorithms. Following findings are reported as the result of the analysis.
• “Ramp metering reduces the total vehicle travel time up to 7% compared with no metering. The effectiveness of a ramp control algorithm depends on the level of traffic demand. As traffic demand increases, ramp metering tends to be more effective in reducing system travel time.
• No significant performance differences exist among ALINEA, modified Bottleneck, modified SWARM with 1 time-step-ahead prediction, and Zone algorithms under the tested scenarios.
5
• Modified SWARM with five-step-ahead prediction has the poorest performance among all tested algorithms due to the inaccuracy of the five-step-ahead prediction model. This indicates a good traffic prediction is the key to SWARM's performance. • Coordinated ramp metering algorithms do not necessarily perform better than local
control algorithms if some of their key parameters are not well calibrated. Well-tuned parameters are critical for the good ramp metering performance.
• Ramp metering performance and parameter values are non-linearly related. There is a broad range of parameter values over which ramp metering performance does not change significantly. Outside of this range, however, ramp metering performance deteriorates quickly.
• Ramp metering seems to be more effective under certain demand patterns than others.”
Zhang et al. (2001) provides a classification tree for algorithms, displayed in Figure 2-1. Note that although zone algorithm is classified as an isolated control method in Figure 2-1, it is considered as a coordinated strategy in this study, as it considers traffic conditions in a freeway stretch rather than a specific location. The algorithms presented in Figure 2-1 are reviewed in Zhang et al. (2001).
Figure 2-1. Ramp metering algorithms [Zhang et al., 2001].
An extension to the above proposed control methods is the incorporation of breakdown probability models into the ramp metering strategy proposed by Elefteriadou et al. (2011). They develop a breakdown probability model for the merge areas as a function of freeway flow and ramp flow. This model is, then, incorporated in an existing ramp metering algorithm (e.g. COMPASS, stratified zone algorithm). Breakdown probability models can be used with current or predicted traffic volumes, depending on the type of the algorithm used. Elefteriadou et al. (2011) tested this approach in a microscopic simulation environment and concluded that the new
6
approach has the potential to improve the performance of existing ramp metering algorithms by delaying or preventing flow breakdown and by increasing freeway throughput.
Although ramp metering algorithms have, in general, compact structures, a real-world ramp metering system consists of a combination of algorithms designed to handle various conditions. For instance, Highways Agency (2007) lists seven algorithms needed for their ramp metering operation system.
• Ramp metering algorithm: The core algorithm that produces ramp metering rates based on local or area-wide traffic conditions on the freeway.
• Data filtering algorithm: Filtering algorithm detects and removes outlier flow, speed and occupancy observations from raw data collected by detectors. The success of filtering algorithm is critical to the performance of ramp metering system.
• Switch on-off algorithm: This algorithm basically switches the ramp metering system on or off based on traffic conditions on the freeway and a pre-defined flow, occupancy or speed threshold.
• Queue override algorithm: It monitors the queue size on the ramp and releases the vehicles from the ramp to clear the queue that may spillback to the arterials.
• Queue management algorithm: This algorithm attempts to keep queue length on the ramp at a pre-defined desired level by monitoring proportional occupancy measurements. This algorithm is implemented to minimize the action of queue override function.
• Arbitration algorithm: This algorithm collects the output from ramp metering, queue management, queue override and switch on-off modules, and determines the final allowed inflow rate from the on-ramp to the freeway. Arbitration algorithm always selects the highest allowed inflow rate and passes it to the release algorithm.
• Release algorithm: This algorithm sets traffic signal durations based on the allowed flow rate computed by the controller. There are various signal policies that can be implemented in this step: one-car per green, two-cars per green or traffic-cycle realizations.
2.2
R
AMPM
ETERINGS
TATUS IN THEUS
Benefits of ramp metering reported in literature include system-wide travel time savings, improved safety, and reduction of fuel consumptions and vehicle emissions. However, there are no standard evaluation criteria to quantify these benefits. In addition, it is difficult to evaluate certain changes in particular (e.g. diversion of travelers to the arterials). Early ramp metering applications in Illinois, Michigan, California, Minnesota, and Washington have been very successful and have led to the extension of ramp metering systems to other metropolitan areas in US. There is no recent study that describes the current status of ramp metering systems in US, but Table 2-1 lists most of the ramp metering sites as of 1995 (ITSA, 1995).
7
Table 2-1. Ramp metering systems in the United States as of 1995 [ITSA, 1995].
State Area No. of Meters Arizona Phoenix 65 California Fresno 15 Los Angeles 808 Orange County 278 Sacramento 19 San Bernardino 51 San Diego 134 San Francisco 96 Illinois Chicago 109 Michigan Detroit 49 Minnesota Minneapolis 367 New York Long Island 75 Virginia Arlington 26 Washington Seattle 54 Wisconsin Milwaukee 43
Ramp Metering Development plan (RMDP) 2011 prepared by California Department of Transportation reports that there are 2460 existing ramp meters throughout the state, which accounts for 60% of all existing ramp meters in the US. RMDP 2011 indicates that state of California plans to implement 1715 new ramp meters within the next 10 years.
The ramp metering system in Minneapolis / St. Paul area has been first implemented in 1970s as a fixed-time control strategy by Minnesota Department of Transportation (MnDOT). This system is first converted to a local traffic responsive system and, later, to an area-wide traffic responsive control system using Zone algorithm. In 2000, an empirical experiment on ramp metering is conducted in Minneapolis-St. Paul area (Cambridge Systematics, 2001). Traffic flow and safety impacts are investigated by disabling 430 ramp meters for six weeks. The results indicated 9% reduction in freeway throughput, 22% increase in travel time, 7% decrease in freeway speed and 26% increase in the number of crashes. MnDOT implemented stratified zone metering strategy (Xin et al., 2004) in 2002 to dissolve the congestion on the freeway but also to minimize the waiting times on the ramps. Michalopoulos et al. (2005) evaluated the stratified zone algorithm in a microscopic simulation environment, and concluded that the algorithm produced less on-ramp delays compared to the previous zone metering algorithm, while the freeway delays increased with the implementation of the new algorithm. However, the algorithm presented clear improvements over the no-control case regarding freeway delay, freeway speed and number of stops.
Washington State Department of Transportation (WsDOT) developed Bottleneck algorithm (Jacobsen et al., 1989), a competitive area-wide ramp control strategy, and implemented it in Seattle central business district starting from 1981. WsDOT conducted a six-year evaluation study, which indicates that travel time decreased by 48%, mainline flow increased by 62-86%,
8
and crash rate decreased by 39%. WsDOT implemented fuzzy logic control (Meldrum and Taylor, 1995) later in 1999, considering the improvements over the existing Bottleneck algorithm. However, there is no study, to the authors’ knowledge, that discusses the evaluation results of the fuzzy logic algorithm in details.
SWARM (Paesani et al., 1997) was first developed by the National Engineering Technology Corporation under a contract with the California Department of Transportation. The first field implementation of the algorithm was in Orange County for 6 weeks with no quantitative evaluation. Moreover, the system did not appear to operate properly. Later the implementation and evaluation of SWARM was more successful in Los Angeles and Ventura Counties, California, in the late 1990s. The benefits of the new SWARM algorithm compared with the previous ramp-metering operations were evaluated during the morning peak periods on a freeway corridor that contains 20 controlled on-ramps. The evaluation revealed an 11% increase of the main-line speed, a 14% decrease of the travel time, and a 17% decrease of the freeway delay. Moreover, the queue lengths at the nine busiest on-ramps increased by more than 40%. The global mode of SWARM operates on an entire freeway stretch based on forecast densities at the bottleneck location. The density prediction is done by performing a linear regression on a set of short term historical data and applying a Kalman filtering process. A parameter, Tcrit, denotes the forecasting time span, which is usually several minutes. The excess density is then the difference between the predicted density at Tcrit and a predetermined threshold density representing the saturation level at the bottleneck. This excess density is converted to the (current) required density to avoid congestion at Tcrit by reduction in volume at each detector station:
required density = current density – (excess density/Tcrit)
volume reduction = (local density − required density) * (no. of lanes) * (distance to next station).
SWARM algorithm has also been tested in Portland metropolitan area by Oregon Department of Transportation (ODOT). Ahn et al. (2007) study the implementation during a 2-week pilot study on a 7 mile long freeway corridor and report the benefit of the new SWARM system as compared with the fixed-time algorithm regarding the savings in delay, emissions and fuel consumption, and safety improvements on and off the freeway. The analysis shows that the percentage of communication failures was below 2% at most locations with the fixed-time strategy, whereas the failure percentages with SWARM were much larger, such as exceeded 10%. In addition, the VMT increased marginally (0.8%) with the SWARM operation, which indicates that the demand remained nearly independent of the ramp metering control deployed in the field (at least for the short term). However, surprisingly, SWARM increased the VHT and the average travel time by 6.0% and 5.1%, respectively, corresponding to a significant increase of 34.7% in total freeway delay. Empirical evidence suggests that this deterioration resulted from high metering rates at most of the on-ramps, resulting in lower travel times on on-ramps and increase in freeway delays. Currently, SWARM is under development and refinement by Delcan, the company which first developed the algorithm (Chu et al., 2009).
9
Chu et al. (2009) reports that there are three major real-world ramp control systems deployed in California:
• San Diego Ramp Metering System (SDRMS), deployed in Sacramento, Fresno, San Bernardino and Riverside, and San Diego areas
• Semi-Actuated Traffic Management System (SATMS), deployed in Los Angeles and Orange County
• Traffic Operations System (TOS), deployed in the Bay Area
These systems can be operated under traffic responsive metering control or pre-timed metering control. SATMS is based on demand capacity control, while SDRMS and TOS are based on occupancy control. Even though ramp metering algorithms have simple structures, these real-world ramp metering systems are complicated because of the necessity to handle various conditions.
There are various studies that evaluate ramp metering implementations in the state of California. The evaluation study on I-580 indicates that installation of ramp meters over an 18 mile long section of freeway led to 30% reduction in travel time (Kimley-Horn and Associates, 2008). Metropolitan Transportation Commission published the fact sheet that presents the benefits of ramp metering implementations; 80% of evaluated freeway segments exhibit 30% or greater delay reduction (MTC, 2011).
Ramp metering system, along with an isolated control strategy, has been installed in Denver (Colorado) on I-25 freeway in 1981. HELPER (Lipp et al., 1991) algorithm was first introduced in 1984 in the same area. Evaluation results indicated that if isolated ramp control is able prevent the breakdown, HELPER has little benefit. However, if not, cooperative control was found to be very effective in dissolving congestion.
METALINE (Papageorgiou et al., 1990) was tested in Milwaukee (Wisconsin) area, in 1997. Although the field results indicated improvements over local ramp control strategies, its deployment has been stopped (Bogenberger and May, 1999).
COMPASS algorithm was first implemented on the Queen Elizabeth Way in Toronto, Canada, in 1975. Ramp metering system can be operated under automated competitive control strategy or can be manually regulated from traffic control center. Local metering rates are computed using an ad hoc look-up table with various levels for each ramp, while global rates are computed using off-line optimization procedure based on area-wide traffic conditions. No evaluation study, to the authors’ knowledge, exists related to the implementation of COMPASS algorithm.
In overall, ramp metering reduces congestion, decreases travel time and increases freeway throughput by managing the ramp flow and improving the efficiency of the merging area. This results also in fewer accidents, which in turn may cause significant delays in the freeways. As there are no standard evaluation criteria to assess the benefits of ramp metering systems, it is extremely difficult to compare performance of various algorithms described above, unless one develops an evaluation platform using a simulation environment (Zhang et al., 2001; Chu et al., 2009). In addition, there are few studies in the literature that attempt to put evaluation results
10
together for numerous field implementations. Table 2-2 summarizes such an evaluation study from six locations in the US (Piotrowicz and Robinson, 1995).
Table 2-2. Benefits of ramp meters [Piotrowicz and Robinson, 1995].
Speed (mph) Changes in (%)
State Area Before After Travel Time Accidents Flow Colorado Denver 43 50 -37 -50 19 Michigan Detroit - - - -50 14 New York Long Island 29 35 -20 - - Minnesota Minneapolis 34 46 - -27 32 Oregon Portland 16 41 -156 -43 - Washington Seattle - - -91 -39 62
Kang and Gillen (1999) also reviewed numerous ramp metering implementations and summarized the impacts of ramp metering strategies on system performance. A part of this review is presented in Table 2-3.
2.3
R
AMPM
ETERINGS
TATUS INE
UROPEDespite the accelerated ramp metering deployment in Europe in the last decades, only few hundred of on-ramps in few European countries are equipped with ramp metering technology where all installations employ only local algorithms. Furthermore, there is no freeway in Europe with ramp metering installation in most of its on-ramps. In addition, motorway-to-motorway metering is non-existent in Europe. Thus, there is a huge potential for motorway traffic flow improvements, if available state-of-the-art ramp metering strategies would be applied in a coordinated way (Nearctis deliverable report 8, 2010).
A European Union funded research project, European Ramp Metering Project (EURAMP) has been conducted and completed in 2007. The first step of the project is the design and simulation testing of various ramp metering algorithms. The second step is the field implementation of different ramp metering strategies. Demonstration sites are A6 motorway (Paris, France), A28 and A2 motorways (Utrecht, Netherlands), A94 motorway (Munich, Germany) and Ayalon Highway (Tel Aviv, Israel). Evaluation results indicate that all test sites, except Utrecht, indicate travel time benefits. However, in Utrecht, ramp delays are more significant than travel time improvements achieved on the mainline. Among several control strategies used, coordinated ramp metering provided the best results. On the other hand, 1-car per green or 2-car per green strategy is used in Utrecht, which may lead to significant ramp delays.
11
Table 2-3. Evaluations of ramp metering systems [Kang and Gillen, 1999]. Location and Agency Site Description Results
Austin, Texas
Texas Department of
Transportation Three ramp meters installed in 1997 on I-35 northbound -- Throughput increased by 7.9% Speeds increased by 60%
Houston, Texas
Texas Department of
Transportation I-10 freeway in 1996 - Total daily estimated travel time savings of 2,875 veh.h
Denver, Colorado
Colorado Department of
Highways 5 ramp meters on I -25 Evaluated in 1981-1982 HELPER algorithm
- Speeds increased by 58%. - Emissions dropped by 24% - Accidents dropped by 5%
- Flows on area arterials increased from 100vph to 400vph, no degradation on surface street conditions
Detroit, Michigan
Michigan Department of
Transportation Six ramp meters installed in 1982 on I-94 eastbound -- Speeds increased by 8%. Accident dropped by 50%
Long Island, New York
New York Department
of Transportation Sixty ramp meters installed in eastbound Long Island Expressway
Evaluated between 1987-1990
- Travel times dropped from 26 min to 22 min
- A motorist using a metered ramp saved 13% in travel time on average.
- No significant change in throughput
Portland, Oregon
Oregon Department of
Transportation I-5 freeway in 1981 16 meters in fixed-time are evaluated
- Speeds increased from 16-40 mph to 41-43 mph
- Fuel consumption reduced by 540 gallons/day
12 2.3.1 Ramp Metering Status in the UK
The first ramp metering system in England has been installed on M6 J10 roadway in 1986 (Highways Agency, 2007). The first widespread deployment of ramp metering on the highway network was started in 2005 with the aim to deploy 30 ramp metering systems by the end of 2007. These ramp metering systems are implemented on the M1, M5, M6, M42, M56, M60, and M62 motorways located in the West Midlands and the North of England.
The operational evaluation of ramp metering installation has indicated benefits to the travelling vehicles on the mainline of the motorway in terms of travel time savings, increased speeds, increased flow, and more stable traffic conditions. The overall increase in peak period mainline flow and speed after the implementation of ramp metering are reported as between 1% and 8% and between 3.5% and 35%, respectively. In many cases, ramp metering has delayed the onset of flow breakdown and/or recovered earlier from the flow breakdown. The mainline travel time savings during peak periods is reported up to 40%. With daily 13% average travel time saving across all sites, the economic assessment indicates that ramp metering installation results to First Year Rate of Return of 48%. It is worth to note that ramp metering has not been successful at all sites. For instance, mixed results were obtained from ramp metering on the M27 and M3 motorways in Southern England, which has been stopped there. As of 2011, there are 88 ramp metering sites on England’s motorway network (Nearctis deliverable report 7, 2010).
2.3.2 Ramp Metering Status in France
METALINE (Papageorgiou et al., 1990) and ALINEA (Papageorgiou et al., 1991) were introduced in Paris, in 1990 and early 1991. Both control strategies were tested during the morning peak period for 10 days, which resulted in higher mainline speeds for both. In the framework of the PDU (Plan de Déplacement Urbain) program and according to the results obtained in the EURAMP project, the authorities decided the renewal of the existing ramp metering system to consider the possibility of real-time control of several candidate on-ramps (Nearctis deliverable report 7, 2010). A field evaluation is done on the generalized ramp metering strategy on the East part of Ile-de-France motorway network using ALINEA strategy. The implementation started in February 2008 on 17 on-ramps with heavy peak period congestions. The obtained results indicated a positive impact of ALINEA on the traffic, which the total time spent (veh·h) on the mainstream plus the on- ramps and the total travel distance (veh·km) are between 3% to 15% and 1% to 8%, respectively. The overall collective benefit is evaluated to be equal to 13.5 M€/year for the 17 on-ramps field test.
Another field test was done to develop, test, and evaluate the traffic impact of four ramp metering strategies: No control, ALINEA, VC_ALINEA (Variable Cycle ALINEA), and Coordination (CORDIN). The field test site was located in the south of the Ile de France motorway network, 20 km-length A6W, which includes 5 consecutive on-ramps fully equipped with loop detectors and traffic signals. Each on-ramp is equipped with 2 detector loops, one at the signal stop line for on-ramp volume measurements, and the second one at the upstream of the on-ramp for the queue override strategy. In addition, the freeway is equipped with detectors stations (each 500 m) for traffic volume, occupancy and speed measurements. In the following, two ramp metering strategies (VC_ALINEA and CORDIN) are introduced.
13
The basic formula of VC_ALINEA requires computing the split ratio as the control variable instead of the green duration. The split is defined as α =G/C, where G is the green time and C is the cycle time. The VC_ALINEA control law is:
α(k) = α(k-1) + K [ô-oout(k-1)] Eq. 2-3
where K is a predefined parameter, ô, and oout denote the desired and current occupancies. Similar to ALINEA, the split (α) is constrained by the minimum and maximum cycle durations. Similarly, the CORDIN strategy is based on ALINEA, in which the coordination is coded to a systematic manner to find first the location of an active congestion (Master on-ramp) and second to modify all upstream control values of ALINEA. The correction of ALINEA control values can be done by adjusting a few parameters.
The aforementioned strategies have been applied over the period from the mid-September 2006, until the end of January 2007. By scrutinizing the collected data, days with major detector failures, uncommon traffic patterns, and significant incidents or accidents are discarded. It was reported that ALINEA in comparison with the no control case decreases the total time spent by 10%, decreases the total travel distance by 2%, and increases the mean speed by 5%. Further, VC_ALINEA decreases the travel time spent and total travel distance by 12% and 5%, respectively. In addition, the CORDIN strategy resulted to 12%, 0% and 11% decrease of travel time spent, total travel distance and mean speed, respectively. For environmental analysis, fuel consumption of vehicles during activation of each ramp metering method is studied. In comparison with the no control case, the changes of -8 %, -5%, -8 % were reported for ALINEA, VC_ALINEA and CORDIN, respectively. The emission indices are also reduced for all strategies. For safety analysis, a risk model based on the traffic measurements (occupancy and flow) is considered, which was calibrated and validated both on the ring road of Paris and on A6W. The obtained results reveal improvement of 20% for all other strategies compared with the no control case. The results of the cost benefit analysis, with respect to the investments and the maintenance cost of the ramp metering system, indicated a collective benefit of 2.4 M€, 2.44 M€ and 3.5 M€ per year for ALINEA, VC_ALINEA and CORDIN, respectively (Nearctis deliverable report 7, 2010).
2.3.3 Ramp Metering Status in the Netherlands
In 1989, the first ramp metering system in the Netherlands was installed on the A10 motorway, with reported positive evaluations. There are 50 ramp meters operating as of 2006, with the implementation costs of 150000 euros for a one-lane onramp controller and 175000 euros for a two-lane controller including outside equipment. The A10 motorway is the ring road around Amsterdam with connections to the nation-wide motorway system of The Netherlands. The A10 is a busy motorway with up to 93.000 vehicles per day in 1994 and frequent congestion occurrences. In June 1994, three new local ramp metering systems have become operational. Taale and van Velzen (1996) report the analyses of two metering strategies on A10: Rijkswaterstaat and ALINEA. The former is a feed-forward strategy assigning the remaining
14
capacity of motorway to the onramp traffic. The Rijkswaterstaat (RWS) strategy can be summarized as follows.
The ramp control system switches on when i) the flow on the motorway or on the on-ramp or the sum of both flows exceed certain predefined values, ii) the speed upstream or downstream the onramp drops below a certain value. Afterwards, the number of vehicles allowed to enter the motorway is:
𝑟𝑘= 𝐶 − 𝐼𝑘−1 Eq. 2-4
where rk is the number of vehicles allowed to enter at time interval k, C is the capacity of the motorway downstream the on-ramp, and Ik-1 is the measured flow upstream the on-ramp in the previous time interval. The cycle time of the metering system is then calculated:
𝑡 =𝑟𝑛
𝑘× 3600 Eq. 2-5
where t is the cycle time (second) and n is the number of lanes on the on-ramp.
The evaluation results show no significant difference in flows. However, ALINEA increases speeds considerably such that during the peak periods the average minimum speed has increased approximately from 30 km/h to 50 km/h. Moreover, with the introduction of ramp metering a 19% reduction of delays has been achieved for both the motorway and the on-ramps. For the Rijkswaterstaat strategy, however, traffic conditions in terms of delays and speed have worsened with respect to the no ramp metering situation.
Taale et al. (1996) examined filed implementation of 3 different ramp metering strategies (RWS, ALINEA, and Fuzzy) at The A12 motorway from The Hague to Utrecht. The output of fuzzy strategy is the cycle time and the inputs are: speed upstream the on-ramp, speed downstream the on-ramp, and the existence of a queue on the onramp. The input variables are divided into a number of fuzzy sets, e.g. very low, low, medium, high and very high. In the first step (fuzzification), the measurement of an input variable is transferred to degrees of membership for those sets. Depending on the degrees of membership, some fuzzy rules are triggered (fuzzy reasoning). These rules have the form:
IF speed upstream = medium AND speed downstream = low THEN cycle time = long.
The switching on of the fuzzy strategy is when the calculated cycle time exceeds a certain threshold and switching off is when the cycle time drops below another threshold. The results of the assessment show that the fuzzy ramp metering strategy was performing better than the other strategies: the capacity of the bottleneck increased (RWS=4048 (veh/h), ALINEA=4000 (veh/h), and Fuzzy=4256 (veh/h)), giving a better throughput, higher speeds, and shorter travel time (RWS=6.0 (min), ALINEA=6.2 (min), and Fuzzy=3.9 (min)). However, fuzzy strategy shows a safety problem that it switches on and off too often.
Taale and Middelham (2000) investigate the manner of driver traffic law compliance at onramps. They report that in case of bottleneck occurrence, about 6% of the drivers ignores the red light, whereas in case of no bottleneck this increases to about 15%. However, where a traffic camera is
15
installed; only about 3% of drivers risk ignoring the red traffic signal. In addition, they state that with ramp metering the percentage of rerouting from the onramps to other roads is noteworthy. 2.3.4 Ramp Metering Status in Germany
Ramp metering has been implemented in Rhine-Ruhr area, Munich and Hamburg, in Germany. Germany has noted that ramp metering prevents significant speed drops at merge locations and leads to a reduction in accidents (German Ministry of Transportation, 2005). Moreover, the number of congestions is reduced by around 50%, the number of severe accidents (person injured or severe damage) is reduced by 25%, and particularly the speed on the through lanes is increased by 10 %. At September 2012, there are around 100 on-ramps at motorways in NRW, Germany equipped with ramp metering control.
2.4
R
AMPM
ETERINGS
TATUS INA
USTRALIAA coordinated traffic responsive ramp control strategy, HERO (HEuristic Ramp metering coOrdination) (Papamichail and Papageorgiou, 2008), was implemented by VicRoads at 6 consecutive inbound on-ramps on the Monash freeway, in Melbourne, Australia. HERO objective is to target the critical occupancy for throughput maximization, which recent studies demonstrate that is more robust and effective than targeting a predefined capacity value. HERO adjusts local ramp metering rates computed by ALINEA based on real-time measurements of traffic conditions along the freeway stretch. HERO applies the coordination by appropriate setting of minimum ramp queue lengths that should be created and maintained at specific ramps. The principal methodology of HERO is summarized as follows:
i. HERO identifies potential active bottleneck of mainstream. The nearest ramp upstream of that bottleneck regarded as the master on-ramp.
ii. To delay or avoid the mainstream congestion and queue control of the master on-ramp, HERO increases the storage space by employing the upstream located slave on-ramps. iii. The formed cluster of on-ramps (master and several slaves) is dissolved when the master
on-ramp queue or the mainstream occupancy at the bottleneck become sufficiently low. The Monash freeway is a six-lane dual roadway carrying more than 160,000 vehicles per day and experiences long periods of congestion between 3 to 8 hours a day. The evaluation undertaken by VicRoads for the pilot project shows a 4.7% increase in average flow (on top of the previous system) and a 35% increase in average speed at morning peak, and a 8.4% increase in average flow and a 58.6% increase in average speed at afternoon peak. Evaluation study also indicates that results produced by HERO are better than local ramp metering strategies and are close to sophisticated optimal control schemes, which require demand prediction. It is worth to mention that HERO was also field-implemented in a 20-km stretch of the A6 freeway in the south of Paris, France, in 2006, although in a simplified form due to the lack of real-time on-ramp data. Nevertheless, results indicated a clear improvement over the uncoordinated ALINEA case.
16
3
P
REPARATION FOR THE FIELD DEPLOYMENT
3.1
I
MPLEMENTATION OF THEUMN
D
ENSITY ALGORITHM INIRIS
The UMN Density algorithm was developed as part of an earlier, RITA funded, project. A later, now completed project, funded by MnDOT, ported the algorithm from its original C++ implementation to a JAVA implementation and was integrated with the IRIS operations system. This effort was completed in 2011. Between the end of the aforementioned project and the initiation of this one IRIS underwent several changes and upgrades. Unfortunately the UMN algorithm was not maintained during these upgrades and it was rendered non-operational by the time this project was initiated. As part of this project effort was aimed in the re-integration of the UMN algorithm into IRIS.
This effort mainly took place during summer of 2012 with testing taking place early fall. Specifically, in order to efficiently perform the required work and to minimize disruption of RTMC operations, the development took place under simulated conditions through the AIMSUN microsimulation interface with IRIS. The AIMSUN-IRIS interface was a low priority project of the MTO. Given the need for this project, priorities were adjusted to complete the interface development, funded by MTO operations funds, on time for it to be used for this project.
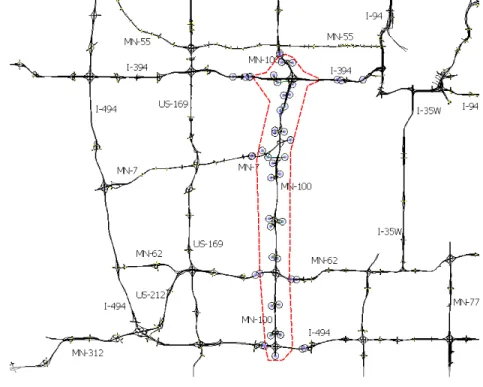
Figure 3-1. TH-100 simulated network for testing the UMN Density Algorithm. The AIMSUN-IRIS Interface allowed the research team to contact all development and experiments in the MTO utilizing an off-line version of IRIS fueled with data provided by the microsimulation application for TH-100. The TH-100 model was the product of an earlier RITA funded project that modeled the entire Twin Cities freeway network. In Figure 3-1 the section of TH-100 used in the Simulated IRIS experiments is surrounded by the red dashed line. It is
17
important to note that the objective of this effort was to re-integrate the UMN algorithm so it is compatible with IRIS and not to make functional changes or improvements. The tasks with the simulated IRIS confirmed the successful operation of the UMN algorithm as part of IRIS but did not conduct any evaluations of its effectiveness and performance. Specifically, the tests were conducted under the following assumptions:
• No changes were made to IRIS outside of the two files containing the UMN Density algorithm. As far as the system was concerned it was communicating with the field. • Time was manually changed in the IRIS server to match the time of the simulation. • A Time Server running on the IRIS server computer handled the synchronization between
the two machines.
• During the tests the afternoon period was implemented with ramp metering starting at 14:59:45 PM.
• Five ramps were tested from 50th Street to Minnetonka Blvd in the northbound direction. • Data provided for all detectors in the area indicated in Figure 3-1.
• Only 10 records per controller are maintained in a circular buffer. This invalidated the archival function of IRIS but it is unrelated to the operation of the ramp metering system. • Time to running the simulation did not cross 11:59 PM in the night. Longer period
simulations became unstable and fixing this problem for the purposes of this project was not necessary.
Finally, it is important to note that, considering it was tested in a simulated TH-100, the UMN Density algorithm was not thoroughly tested for its robustness in view of incomplete or erroneous data which are possible during real operations.
The code of the reintegrated UMN Density algorithm was transmitted to the RTMC in July 2012 and the tests took place between that time and End of September 2012. It was after the research team secured the successful operation of the algorithm that the field tests were scheduled.
Although, no actual documentation regarding the UMD KAdaptive ramp metering algorithm was ever received by the research team a basic understanding of its operation was developed through information found a final project report (Kwon and Park, 2012). We also performed a cursory inspection of the code in IRIS to complete our understanding and the changes between theory and implementation.
3.2
P
REPARATION OF THEMTO
T
RAFFICS
URVEILLANCE ANDD
ETECTIONS
TATIONSThe MTO traffic surveillance stations are modular machines and required modification in order to adapt to the chosen deployment locations on TH-100. The MTO surveillance stations were used to collect video of the freeway at multiple points along TH-100. This video was later processed to extract flow characteristics and specifically travel times. These locations of video collection will be augmented with 30-second loop detector data from existing MnDOT sensors.