ARTICLE
Genetic Control of Individual Differences
in Gene-Specific Methylation in Human Brain
Dandan Zhang,
1,4Lijun Cheng,
1,4Judith A. Badner,
1Chao Chen,
1Qi Chen,
1Wei Luo,
1David W. Craig,
3Margot Redman,
3Elliot S. Gershon,
1,2and Chunyu Liu
1,*
We have observed extensive interindividual differences in DNA methylation of 8590 CpG sites of 6229 genes in 153 human adult cere-bellum samples, enriched in CpG island ‘‘shores’’ and at further distances from CpG islands. To search for genetic factors that regulate this variation, we performed a genome-wide association study (GWAS) mapping of methylation quantitative trait loci (mQTLs) for the 8590 testable CpG sites.cisassociation refers to correlation of methylation with SNPs within 1 Mb of a CpG site. 736 CpG sites showed phenotype-wide significantcisassociation with 2878 SNPs (after permutation correction for all tested markers and methylation pheno-types). Intransanalysis of methylation, which tests for distant regulation effects, associations of 12 CpG sites and 38 SNPs remained significant after phenotype-wide correction. To examine the functional effects of mQTLs, we analyzed 85 genes that were with genet-ically regulated methylation we observed and for which we had quality gene expression data. Ten genes showed SNP-methylation-expression three-way associations—the same SNP simultaneously showed significant association with both DNA methylation and gene expression, while DNA methylation was significantly correlated with gene expression. Thus, we demonstrated that DNA methyl-ation is frequently a heritable continuous quantitatively variable trait in human brain. Unlike allele-specific methylmethyl-ation, genetic poly-morphisms mark bothcis- andtrans-regulatory genetic sites at measurable distances from their CpG sites. Some of the genetically regulated DNA methylation is directly connected with genetically regulated gene expression variation.
Introduction
Changes of DNA methylation at CpG dinucleotides are
heritable and play an important role in gene expression,
X chromosome inactivation, parental imprinting,
develop-ment, and complex disease.
1–3However, the regulation of
DNA methylation of specific genes is poorly understood.
A pilot study of the Human Epigenome Project (HEP)
showed that there is considerable interindividual
varia-tion in DNA methylavaria-tion, with ~50% of CpG sites having
greater than 50% variation across all samples.
4Several
other studies also documented individual CpG sites that
exhibit variation among individuals.
5–7A twin study showed that within the
H19
differentially
methylated region (DMR), the heritability of methylation
of individual CpG sites ranged from 20% to 74%. For the
Insulin-like growth factor 2 (
IGF2,
[MIM 147470]) DMR,
heritability among CpG sites varied between 57% and
97%.
6Bjornsson and colleagues observed that
intraindi-vidual DNA methylation changed over time and that
this variation over time may be under genetic control.
2Furthermore, there exists compelling evidence for several
associations between genetic variants and DNA
methyla-tion of specific genes. For example, SNP genotypes of the
IGF2
/
H19
locus, where degree of methylation is involved
in male infertility,
8were found to be significantly
associ-ated with methylation of the
IGF2
DMR.
6Allele-specific
methylation (ASM) was demonstrated in 16 SNPs from
a genome-wide study, meaning that one SNP allele was
associated with a complete or nearly complete
methyla-tion of a nearby CpG site, and the other allele was
associ-ated with the complete unmethylassoci-ated state, or the SNP
itself destroyed a CpG site by changing the C or G.
9All these findings led to the hypothesis that a
consider-able proportion of CpG sites may be quantitative traits
with regulation by specific genetic variants. Identification
of genetic variants that are associated with gene-specific
DNA methylation could open a new venue to the
under-standing of methylation regulation.
In order to test the feasibility of genetic mapping of
factors regulating DNA methylation, we performed a
genome-wide association study (GWAS) testing
associa-tions between SNP genotypes and DNA methylation of
individual CpG sites by treating methylation as a
quantita-tive trait. This search is not limited to SNPs close to the
CpG sites, which ASM normally targets. We include here
genetic variants that can be hundreds of thousands of
base pairs away or on a different chromosome. DNA
meth-ylation is controlled by various additional factors and can
be tissue specific. We elected to study methylation control
in cerebellum of human adult brain.
Material and Methods
We obtained 164 human cerebellum samples from the Stanley Medical Research Institute (SMRI). Of these, 153 individuals of European ancestry were included in the current analysis. The brains were autopsy specimens from patients with various psychi-atric disorders and normal controls. Diagnoses of patients and unaffected controls were based on structured interviews by a senior 1Department of Psychiatry and Behavioral Neuroscience, The University of Chicago, Chicago, IL 60637, USA;2Department of Human Genetics, The University of Chicago, Chicago, IL 60637, USA;3The Translational Genomic Research Institute, Phoenix, AZ 85004, USA
4These authors contributed equally to this work *Correspondence:[email protected]
psychiatrist with family member(s), to establish or rule out axis I diagnoses.10–12The diagnoses were made by two senior
psychia-trists, who used DSM-IV criteria.13All samples have age, gender, race, postmortem interval (PMI), brain pH, smoking and alcohol use, suicide status, and psychotic features data. The sample demo-graphic data and covariates are summarized inTable S1available online.
Genotyping Methods
Genomic DNA was extracted from frozen cerebellar tissues provided by the SMRI. A phenol/chloroform/isoamyl alcohol protocol was modified and followed. The DNA was resuspended in 0.1 mM EDTA TE buffer. Genomic DNA was evaluated by Nano-Drop ND-1000 spectrophotometer (NanoNano-Drop Technologies, Wil-mington, DE) for concentration and by 1% agarose gel to validate the DNA integrity. We used Affymetrix GeneChip Mapping 5.0K Array and Assay Kits (Affymetrix, Santa Clara, CA) for genotyping according to the Affymetrix protocol. Genotypes were called with the BRLMM-p algorithm (Affymetrix) with all arrays simulta-neously.
SNPs with call rates R 99%, Hardy-Weinberg equilibrium (HWE) p valuesR0.001, and minor allele frequencies (MAF)R 10% were included in the association tests. Of the genotypes obtained, 239,834 SNPs passed quality control and were used for subsequent analyses. Principal component analysis was applied to verify sample population homogeneity by running EIGEN-STRAT.14To examine the relatedness between samples, pair-wise identity-by-state was calculated with PLINK.15 The results
con-firmed that the 153 selected samples were unrelated and of Euro-pean ancestry (seeFigures S1–S3).
Methylation Assays
Genomic DNA was quantified by PicoGreen (Invitrogen, CA) and diluted to a final concentration of 50 ng/ml. DNA methylation was assessed at the Genomics Core Facility of Northwestern University (Chicago, IL) with Illumina Infinium HumanMethylation27 Bead-Chips (Illumina Inc., San Diego, CA). Technical details of this array are described elsewhere.16The BeadChip probes 27,578 CpG sites.
Of those, 20,007 sites (72.5%) are located in CpG islands and 7,571 (27.5%) are not. Almost all the sites (97.7%) are located in ‘‘promoter proxy’’ regions (less than 1500 bp from a transcription start site). The methylation level of each interrogated CpG site was calculated as the ratio of signal from a methylated probe relative to the sum of methylated and unmethylated probes. This value,b, ranges continuously from 0 (unmethylated) to 1 (fully methylated).
Pyrosequencing was used to validate DNA methylation data obtained from Beadchips. Genomic DNA was bisulfite converted according to the protocol in EpiTect 96 Bisulfite Kit (QIAGEN) and used as PCR template. Primers were designed with Pyrose-quencing Assay Design Software v1.0.6 (Biotage, Uppsala, Sweden). A full list of primer sequences can be found in
Table S2. PCR amplifications were performed with a standard protocol in 25 ml reactions, containing 20 ng of bilsulfite-con-verted DNA, 0.02 mM tagged Primer, 0.2mM primer, 0.18 mM universal biotin-labeled primer, 1.0 mM MgCl, 0.125 mM dNTP, 13PCR buffer, and 0.8U Hotstart Taq polymerase (QIAGEN). PCR cycling conditions are 95C 5 min, 50 cycles (95C 15 s, 60C 30 s, 72C 30 s), and 72C 5 min. PCR products were pro-cessed according to the manufacturer’s standard protocol (Biot-age). In brief, 3 ml of streptavidin-sepharose beads (Amersham
Biosciences, Piscataway, NJ) and 40ml of binding buffer (pH 7.6, 10 mM Tris-HCl, 1 mM EDTA, 2 M NaCl, 0.1% Tween 20) were mixed with 20ml of PCR product for 10 min at room temperature. The reaction mixture was immobilized onto streptavidin-coated beads. After application of the vacuum, the beads were treated with high-purity water for 30 s, 70% ethanol for 5 s, and a denatur-ation solution (0.2 M NaOH) for 5 s and washed for 5 s with washing buffer (10 mM Tris-acetate at pH 7.6). The beads were then suspended with 40 ml of annealing buffer (20 mM Tris-acetate, 2 mM Mg-acetate at pH 7.6) containing 0.5 mM of sequencing primer, prefilled in a PSQ 96 Plate (Biotage). The plate with samples was heated at 80C for 2 min and finally cooled to room temperature. Sequencing reactions were performed with a PSQ 96 SNP Reagent Kit (Biotage) according to the manufac-turer’s instructions. The percent methylation at each CpG site was calculated from the raw data with the Pyro-Q-CpG Software (Biotage).
Classification of CpG Sites
More than half of CpG sites assayed (54.3%) were hypomethylated (%20% DNA methylated; seeFigure S4). Studies of HEP data from three human chromosomes reported a similar pattern of methyla-tion distribumethyla-tion. CpG sites near promoters were more likely to be hypomethylated.17,18
A CpG site was studied for SNP association if it had fewer than 95% of individuals with only hypomethylation or only hyperme-thylation (R80% DNA methylated); 8590 CpG sites were thus included. Of those, 5097 were not within CpG islands. CpG sites within 2 kb of CpG islands were defined by Irizarry et al. as ‘‘CpG island shores.’’19We observed that as compared with CpG islands, CpG sites with greater variability were enriched both in ‘‘CpG island shores’’ (permutation p value<1.0E-7) and in more distant regions (>2 kb from CpG islands, permutation p value<
1.0E-7, seeTable S3).
Considering each CpG site for all samples, we generally observed unimodal (single-peak) distributions. The vast majority of the included CpG sites (92.7%) had a unimodally distribution, as observed previously,6,20lending support to a QTL approach to
genetic analysis rather than a qualitative (binary) locus approach (Figures S5 and S6).
Expression Data
Expression data from cerebellum for 45 of the same individuals is available from the SMRI Online Genomics Database. Oligonucleo-tide microarray chip (HGU95Av2) experiments reported in that database were carried out according to the manufacturer’s protocol (Affymetrix, Santa Clara, CA).10,12We performed RMA normaliza-tion with Partek Genomics Suite (Partek Inc., St. Louis, MO). There are technical replicates for every individual.10-12A total of 12,625
probe sets were assayed by HGU95Av2. We selected 4648 probes that were coded as ‘‘present’’ (called by the Affymetrix Microarray Suite [MAS] algorithm) inR80% of samples.
Expression and Methylation Data Preprocessing
COMBAT21was used to correct for batch effects within the
meth-ylation and expression array data, including 15 technical replicate pairs in the methylation data and 45 technical replicate pairs in the expression data. For later analysis of each technical replicate pair, the data were averaged for the replicated samples to obtain a single datum. In order to remove the effects of known and unknown covariates on the data, surrogate variable analysis
(SVA)22was applied and the identified surrogate variables were re-gressed out. We examined the effects of known variables on the methylation data pre- and post-COMBAT21 and SVA.22 In the regression analysis, quantitative and categorical covariates were used according to the data (details inTable S4). The methylation data before processing demonstrated strong batch effects (barcode of chips was a significant [p<0.05] covariate for 91% of probes). Batch effects were present in only 2% of the probes after correc-tion, which is close to our chance expectation (Table S4). For the expression data, brain pH and batch effects were significant (p<
0.05) in 41% and 10%, respectively, of the probes in the data prior to preprocessing but each is significant in only 1% of the probes in the corrected data.
QTL Analysis
To fit a normal distribution, quantile normalization was used for both expression and methylation residuals. Linear regression anal-ysis was performed to test for correlation between the normalized residuals and the number of minor alleles via an additive genetic model by PLINK.15 From this analysis, an asymptotic p value
from the Wald statistic was obtained as a measure of association of each SNP with methylation of any given CpG site.
Multiple Testing Correction
Three sets of permutations of phenotype were performed. Permu-tations for a CpG-SNP combination were calculated with the adap-tive perm option of PLINK (aperm), permuting up to 1 billion replicates (EMP p value). This corrects for possible nonnormality of the phenotype distribution. Permutations correcting for multiple testing within acisregion or whole-genome scan were also performed with the max (T) permutation (mperm) option of PLINK (region-wide p forcis; genome-wide p fortrans). For each phenotype, results were permuted 1000 times, with the same seed to maintain the correlation between phenotypes. To estimate phenotype-wide significance (in addition to region-wide signifi-cance), the best statistic per replicate for each phenotype was saved with the PLINK mperm-save option. Statbest, the statistic
from the most significant phenotype, was defined for each repli-cate. Phenotype-wide corrected p values were calculated as (Rþ1)/(Nþ1) where R is the number of times the statbestexceeded
the observed statistic and N is the number of permutations (1000).
cis
- and
trans
-Regulation of Methylation
Like the classification of gene expression regulators, the regulation of methylation traits can be roughly divided into two types: cis-acting regulation by DNA elements in or adjacent to each CpG site, and trans-acting regulation by factors from the genomic regions distant from the CpG sites, including from different chro-mosomes. We defined the SNPs within a region bounded by 1 Mb distance from both ends of each CpG site as candidates forcis anal-ysis. All the other SNPs were analyzed fortrans-acting associations for each CpG site.
Effect of mSNPs on Gene Expression
We tested the association of corresponding gene expression and mSNPs (SNPs showing phenotype-wide significant associations with DNA methylation of CpG sites in a given gene) by linear regression with PLINK. Region-wide significance was corrected for the number of SNPs analyzed for each expression probe (for details, see above QTL analysis). Note that there were only a small
number of individuals and genes with existing acceptable expres-sion data, as described above.
Correlation Analysis of DNA Methylation and Gene
Expression
We investigated the correlation between genetically determined DNA methylation, which showed phenotype-wide significant cis-mQTL association and expression of the corresponding genes. Pearson linear regression was applied to detect the correlation between DNA methylation and gene expression by R after prepro-cessing of expression and methylation data (see above). The multiple testing correction of p values was performed by positive false discovery rate (q value) implemented in Partek Genomics Suite.23
Results
mQTL Analysis
In the
cis
analysis, 12,117 SNP-CpG pairs, consisting of
9,448 SNPs and 2,046 CpG sites (of 1,795 genes), were
significantly correlated (region-wide permuted p
%
0.05)
(
Table S5
). The associations of 3,323 pairs (involving 736
CpG sites of 658 genes associated with 2,878 SNPs)
remained significant after correcting for the 8,590
methyl-ation phenotypes tested (phenotype-wide p value
%
0.05).
Among the 736 CpG sites with phenotype-wide significant
cis
associations, CpG sites within CGIs were more likely to
have phenotype-wide significant
cis
-mQTLs than in
non-CGI regions (permutation p value
¼
3.0E-4) (
Table S6
).
The
cis
associations with methylation showed effect
sizes (R
2) ranging from 0.17 to 0.73. The most significant
association for each of the CpG sites are shown in
Table 1
(top 10 probes with the smallest Wald p value)
and
Table S7
(highlighted in orange for the 736 CpG sites
with phenotype-wide significant
cis
-mQTL associations).
All SNPs that have region-wide significant associations
with DNA methylation are in
Table S5
. Closer inspection
on the positions of SNPs with phenotype-wide significant
cis
-mQTL associations (
Figure 1
) showed that most of the
associated SNPs were near the CpG sites, 95% within
a 149 kb range.
390 SNPs showed
cis
association (phenotype-wide p
%
0.05) with two or more CpG sites of 141 genes.
Interest-ingly, 163 SNPs’ and 85 genes’ CpG sites are clustered in
37 genomic regions (
Table S8
). In each cluster, multiple
SNPs are associated with multiple CpG sites of several
different genes. For example, a 186 Kb region on
chromo-some 1 contains 14 SNPs that are associated with three
CpG sites of three different genes (
LCE1D
[MIM 612606],
LCE2B
[MIM 612610], and
LCE3A
[MIM 612613]). Gene
families were frequently observed in these clusters,
including keratin-associated protein, claudin, killer cell
lec-tin-like receptor, proline-rich protein BstNI subfamily, late
cornified envelope protein, and other gene families. These
genes in one cluster are likely to be coregulated for their
DNA methylation.
In the
trans
analysis, 372 SNP-CpG pairs involving 368
SNPs and 246 CpG sites (of 240 genes) showed association
at
permutation
corrected
genome-wide
p
%
0.05
(
Table S9
). Thirty-eight SNP-CpG
trans
pairs (12 CpG sites
and 38 SNPs) were significant after further
phenotype-wide correction (corrected p
%
0.05, highlighted in orange
in
Table S9
).
Table 2
showed the strongest
trans
associa-tions of each CpG site. Ten of the
trans
associations have
SNPs from different chromosomes, while two are on the
same chromosomes but more than 1 Mb away from the
target CpG sites.
Validation
In order to validate the DNA methylation measurement
obtained from the microarray, we successfully designed
pyrosequencing assays for five randomly selected
cis
-mQTL CpG sites. Each CpG site was processed in one batch
for all samples, so no batch effect was involved. SVA is not
applicable to analysis of a few CpG sites. Linear regression
analysis was performed for the SNP that showed the best
signal with a given CpG site measured by pyrosequencing
without adjustment of covariates (see
Table S10
).
Corre-spondingly, the association was recalculated with residuals
of DNA methylation measured by Illumina Beadchips after
correction for batch effect by COMBAT but no further
pro-cessing of SVA. All five
cis
associations detected with
Illu-mina Beadchip were confirmed by data from
pyrosequenc-ing. One example is shown in
Figure 2
. Minor allele T of
rs10492813 significantly increased DNA methylation of
cg23815491 (gray boxplot). Pyrosequencing validated the
association predicted by the Beadchip data (white
box-plot). We also examined the genotype clusters for the five
SNPs associated with DNA methylation of the five
pyrose-quencing-validated CpG sites (see
Figure S7
). The genotype
clusters were all of good quality.
Functional Effects of SNPs and DNA Methylation
on Gene Expression
The known relationships between SNPs and DNA
methyl-ation and between DNA methylmethyl-ation and gene expression
raised the question of whether SNPs associated with
mQTLs might also be associated with expression of the
same genes. Therefore, we further analyzed the association
of mSNPs (phenotype-wide significantly associated with
DNA methylation in a
cis
manner mentioned above)
with gene expression of a given gene for which we had
existing data with acceptable quality. We identified 85
genes related to phenotype-wide significant
cis
-mQTL
and with an expression probe that met QC criteria (greater
than 80% present, see
Material and Methods
above). These
SNPs, methylation, and expression data make up 112
CpG-expression probe pairs (comprising101 CpG sites and 95
expression probes) and 550 mSNP-expression probe pairs
(comprising 447 mSNPs and 95 expression probes). We
looked at the relationships between these data pairs in
two ways: (1) association between genotypes of mSNPs
with gene expression and (2) correlation between
methyl-ation and gene expression.
Ninety-two of the 550 mSNP-expression probe pairs
(comprising 59 mSNPs and 19 expression probes of
17 genes) showed a region-wide significant association
between the mSNP genotypes and the expression of the
corresponding gene (
Table S12
).
Twenty of the 112 CpG-expression probe pairs
(com-prising 19 CpG sites and 18 expression probes of 17 genes)
showed
nominally significant
correlations. As expected,
DNA methylation negatively correlated with gene
expres-sion for 15 pairs, a majority of the pairs. Interestingly,
five pairs of four genes (
ZNF266
[MIM 604751],
FANCG
[MIM 607139],
DDT
[MIM 602750], and
FUT1
[MIM
Table 1. Ten CpG-SNP Pairs with the Most Significant Phenotype-wide CorrectedcisAssociations
CpG Gene Symbol Best Correlated SNP Chr SNP Position BETA R2 Wald p Value EMP p Value Region-wide p Value Phenotype-wide p Value
cg24920358 PPIE rs1046988 1 39991652 1.21 0.73 1.32E-44 <1.00E-09 <0.001 <0.001 cg22333868 SYT1 rs1880867 12 78121579 1.22 0.73 2.09E-44 <1.00E-09 <0.001 <0.001 cg13926569 PAPSS2 rs2180968 10 89408710 1.21 0.72 1.25E-43 <1.00E-09 <0.001 <0.001 cg17749961 LYCAT rs829584 2 30530779 1.37 0.71 5.79E-43 <1.00E-09 <0.001 <0.001 cg10106388 CD244 rs12036670 1 159099485 1.39 0.71 9.59E-43 <1.00E-09 <0.001 <0.001 cg06873352 LYK5 rs2044125 17 59216916 1.16 0.71 3.38E-42 <1.00E-09 <0.001 <0.001 cg13507326 FLJ25976 rs2284235 14 77233176 1.25 0.70 2.07E-41 <1.00E-09 <0.001 <0.001 cg01561916 HAAO rs7583085 2 42876472 1.33 0.70 4.02E-41 <1.00E-09 <0.001 <0.001 cg14141399 HAS1 rs11672222 19 56919728 1.26 0.69 1.12E-40 <1.00E-09 <0.001 <0.001 cg18294158 ORC5L rs4461829 7 103657263 1.32 0.69 2.13E-40 <1.00E-09 <0.001 <0.001
Abbreviations: CpG, the CpG site as named by Illumina; gene symbol, the gene contains the CpG site; best correlated SNP, the SNP that shows the most significant
cisassociation with this CpG site; chr, the chromosome where the SNP is located; BETA, regression coefficient; R2, Regression r-squared; Wald p value, Wald test asymptotic p value; EMP p value, empirical p value based on adaptive permutations, permuting up to 100 million replicates, in PLINK software. Region-wide p value, empirical p value based on 103permutations with correction for the number of SNPs tested forcisassociations at this CpG site. Phenotype-wide p value, empirical p value based on 103permutations, correcting for the number of SNPs tested forcisassociations of this CpG site and the number of CpG sites (pheno-types) studied.
211100]) showed that increased DNA methylation
upregu-lated the genes’ expression. Eleven of the 20 pairs (11 CpG
sites of 10 genes and 10 expression probes of 10 genes)
survive multiple test correction (FDR q value
%
0.05; see
Table 3
).
Putting the above two correlations with the mQTL data
together, we noticed that 10 genes (involving 10 CpG sites,
11 expression probes, and 29 SNPs) showed three-way
associations—the same SNP simultaneously showed a
significant association with DNA methylation and with
gene expression. At the same time, DNA methylation
significantly correlated with gene expression of the same
gene (
Table S13
). For example, minor allele C of SNP
rs2235375 was associated with the increased methylation
level of gene
IRF6
(MIM 607199) (CpG site cg23283495,
phenotype-wide p value
<
0.001). The C allele was also
associated with the reduced expression of
IRF6
with
region-wide significance (region-wide p
%
0.05). A
signifi-cant linear negative correlation between methylation and
expression of gene
IRF6
was observed. The box plot of
expression and methylation in gene
IRF6
with SNP
rs2235375 is presented in
Figure 3
. The other nine
‘‘three-way associations’’ are showed in
Figure S8
.
Discussion
We have observed that numerous CpG sites are regulated
by genetic variants in
cis
and/or
trans
manner. Our results
showed that CpG sites with extensive variability were
more enriched in non-CGI (CpG islands) regions than
within CGIs. Previous studies found that CpG sites in
CGI were largely unmethylated,
17,18whereas CpG sites in
non-CGI regions were moderately to highly methylated.
16Interestingly, CpG sites within CGIs were more likely to be
phenotype-wide significantly associated with
cis
regulators
than in non-CGI regions (permutation p value
¼
3.0E-4).
The fact that genetic variants regulate DNA methylation
of CGIs more than of CpG island shores and distant CpG
sites is intriguing in light of the report by Irizarry et al.
19They reported that CpG island shores are enriched for
tissue-specific methylation sites in a study comparing
different tissue types.
19Our findings are concordant with the findings of a
number of previous studies associating variation of
candi-date gene DNA methylation with SNPs in
cis
in human and
mice.
6,9,24Kerkel et al. carried out a pioneering
genome-wide survey of ASM sites.
9They found 16 sites with
ASM. Eight of the 16 sites (around
BCL2
[MIM 151430],
CYP2A7
[MIM 608054],
EFNB1
[MIM 300035],
GCNT3
[MIM 606836],
LTF
[MIM 150210],
PIM1
[MIM 164960],
VNN1
[MIM 603570], and
MAGEL2
[MIM 605283] genes)
reported by Kerkel et al. gave at least nominally significant
associations in our
cis
association study, even though the
Kerkel et al. group studied tissues other than brain. Only
the
LTF cis
association reached phenotype-wide
signifi-cance in our study. Differences between the two studies
might be attributable to tissue differences and to different
statistical criteria for significance.
Kerkel et al.’s findings were probably limited to SNPs
within 2 kb regions around the CpG sites, because their
detection relied on short amplicons after HpaII or MspI
digestion. Our association tests capture longer-distance
SNP-methylation correlations:
cis
associations extend to
SNPs within 1 Mb distance on each side of the CpG site.
Most of our
cis
phenotype-wide significant associations
(87.9%) are from regions more than 2 kb away from the
CpG sites. In a few cases, effects were observable over longer
distances, which were probably out of the range of linkage
disequilibrium (LD) because the average
r
2(r: correlation
coefficient between pairs of loci, a measure of LD) for SNP
pairs decreases to less than 0.1 when the distance interval
is 160 kb in Europeans.
25trans
association of DNA
methyl-ation largely came from different chromosomes.
DNA methylation of
IGF2/H19
, one of the
best-charac-terized genetically regulated loci, was previously reported
Figure 1. p Values and Distances between CpG Sites and SNPs cisSNPs are plotted by their relative distance from CpG sites on the horizontal axis and genotype-methylation association p values on the vertical axis. Theyaxis is -log10 transformed permutation p values of associations betweencisSNPs and DNA methylation (109 permutations). Red dots represent phenotype-wide
signifi-cantcisassociations and green triangles mean region-wide signif-icance. The box plot shows the summary statistics of distance at xaxis. For the box plot, the right end is the lowest point within 1.5 interquartile (distance between third and first quartile) from the lower quartile, and the left end is the highest point within 1.5 interquartile of the upper quartile, the top of the box is the upper or third quartile, the bottom of the box is lower or first quar-tile, the middle bar is median value, and the circles are possible outliers. The median value of distance between cis SNPs and CpG sites is 34.38 kb. Plot and box plot were created in R.
to be strongly determined by heritable factors and SNPs in
cis
.
6Our analysis confirmed
cis
association in
IGF2/H19
(region-wide p
<
0.05), although the SNP that showed
the most significant association in a previous study was
not included in this study and the association in this study
did not reach our strict phenotype-wide significance level.
Several known genes (such as
DNMT1
[MIM 126375],
DNMT3A
[MIM 602769],
DNMT3B
[MIM 602900],
MTHFR
[MIM 607093], etc.) are involved in general DNA
methyla-tion.
Dnmt3a
and
Dnmt3b
are required for de novo
meth-ylation of DNA in mammals.
26–28Dnmt1
is known to
have a high preference for hemimethylated CpG sites
and has an important role in maintenance of
methyla-tion.
29,30MTHFR
affects global DNA methylation.
31None of these genes contain SNPs significantly associated
with mQTLs in the present study. Heijmans and colleagues
also failed to detect an association of
MTHFR
with DNA
methylation of
IGF2/H19
.
6One possible reason is that
the polymorphisms in these genes are not completely
covered in our study and in Heijmans et al.’s study (for
list of SNPs tested in this study, see
Table S11
). Another
more likely explanation is that the current study identifies
gene-specific DNA methylation, which is different from
the global DNA methylation controlled by these known
methylation pathway genes. The current results may
even-tually contribute to an understanding of the mechanisms
of gene-specific DNA methylation.
By using available and acceptable quality gene
expres-sion data, we further found that about 13% (59/447) of
genetic variants regulating DNA methylation (mSNPs)
also affect gene expression. Around 18% (20/112) of
CpG-expression probe pairs showed nominally significant
correlations. Increased DNA methylation upregulated the
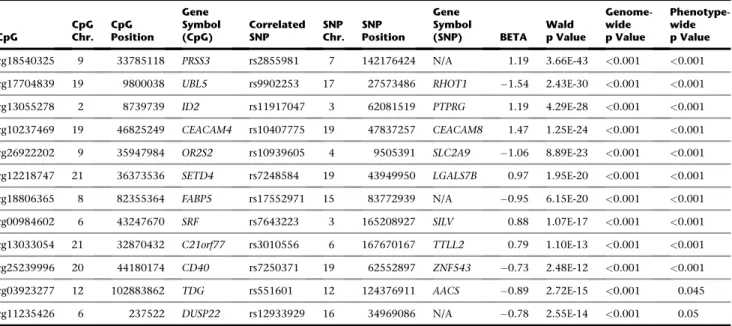
Table 2. Phenotype-wide SignificanttransAssociations Showing the Best Association for Each CpG Site
CpG CpG Chr. CpG Position Gene Symbol (CpG) Correlated SNP SNP Chr. SNP Position Gene Symbol (SNP) BETA Wald p Value Genome-wide p Value Phenotype-wide p Value cg18540325 9 33785118 PRSS3 rs2855981 7 142176424 N/A 1.19 3.66E-43 <0.001 <0.001 cg17704839 19 9800038 UBL5 rs9902253 17 27573486 RHOT1 1.54 2.43E-30 <0.001 <0.001 cg13055278 2 8739739 ID2 rs11917047 3 62081519 PTPRG 1.19 4.29E-28 <0.001 <0.001 cg10237469 19 46825249 CEACAM4 rs10407775 19 47837257 CEACAM8 1.47 1.25E-24 <0.001 <0.001 cg26922202 9 35947984 OR2S2 rs10939605 4 9505391 SLC2A9 1.06 8.89E-23 <0.001 <0.001 cg12218747 21 36373536 SETD4 rs7248584 19 43949950 LGALS7B 0.97 1.95E-20 <0.001 <0.001 cg18806365 8 82355364 FABP5 rs17552971 15 83772939 N/A 0.95 6.15E-20 <0.001 <0.001 cg00984602 6 43247670 SRF rs7643223 3 165208927 SILV 0.88 1.07E-17 <0.001 <0.001 cg13033054 21 32870432 C21orf77 rs3010556 6 167670167 TTLL2 0.79 1.10E-13 <0.001 <0.001 cg25239996 20 44180174 CD40 rs7250371 19 62552897 ZNF543 0.73 2.48E-12 <0.001 <0.001 cg03923277 12 102883862 TDG rs551601 12 124376911 AACS 0.89 2.72E-15 <0.001 0.045 cg11235426 6 237522 DUSP22 rs12933929 16 34969086 N/A 0.78 2.55E-14 <0.001 0.05
Abbreviations: CpG, the CpG site as named by Illumina; CpG Chr. and CpG position denote the physical location of each CpG site; gene symbol (CpG), the gene that contains the CpG site; best-correlated SNP, the SNP that shows the most significanttransassociation with methylation of the CpG; SNP Chr., the chromo-some where the SNP is located; gene symbol (SNP), the gene where thetrans-SNP locates; beta, regression coefficient; Wald p value, Wald test asymptotic p value; genome-wide p value, empirical p value based on 103permutations with correction for the number of SNPs tested fortransassociations of this CpG site. Pheno-type-wide p value, empirical p value based on 103permutations, correcting for the number of SNPs tested fortransassociations of this CpG site and the number of CpG sites (phenotypes) studied. N/A means that there is no known gene near this SNP.
Figure 2. Methylation of cg23815491 Measured by Pyrose-quencing and Beadchip Associated with SNP rs10492831 DNA methylation of cg23815491 measured by Illumina Beadchip (right) and pyrosequencing (left). DNA methylation was plotted against the genotypes of rs10492813. Thexaxis has three geno-types of rs10492813, andyaxis was the raw data measured DNA methylation by pyrosequening and Illumina Beadchips. Minor allele T of rs10492813 is significantly associated with high methyl-ation level of cg23825491 in acismanner assessed by Beadchip (Wald p value¼1.02E-46). The same trend was observed in pyro-sequencing data (Wald p value¼1.50E-56). The correlation coef-ficient between the two methods was r¼ 0.91. For each box plot, the top bar is the lowest point within 1.5 interquartile from the lower quartile, and the left end is the highest point within 1.5 interquartile of the upper quartile, the top of box is the upper or third quartile, the bottom of box is the lower or first quartile, the middle bar is the median value, and circles are possible outliers.
gene’s expression for five CpG-probe pairs of four genes.
Previous studies have also reported positive correlations
between DNA methylation of gene body and gene
expres-sion.
32–34Further studies are needed to explore the
mech-anism of hypomethylation and decreased gene expression.
Taking SNP, DNA methylation, and gene expression
together, we observed 10 genes that showed three-way
associations. In the case of rs2235375, the C allele was
simultaneously associated with increased methylation
and decreased expression of
IRF6
. SNP rs2235375 is an
in-tronic polymorphism located 14 kb away from the studied
promoter CpG site. This finding strongly implicates a
distant intronic variation affecting DNA methylation,
which may then impact expression of the gene itself.
Inter-estingly, the C allele of SNP rs2235375 has been associated
with nonsyndromic cleft lip with or without cleft palate.
35In addition,
Irf6
knockout mice developed abnormal skin,
limb, and craniofacial morphogenesis.
36DNA methylation
regulation disturbance and consequential reduction in
gene expression could be an explanation of the genetic
association detected in the cleft lip study.
These associations imply that mQTLs and eQTLs of
particular genes may be related but not identical. Similarly,
Kerkel et al.’s study reported that two out of four genes
tested showed both allelic expression and allelic
methyla-tion.
9Of course, many other factors are involved in
regu-lating gene expression besides DNA methylation and
SNPs. The contribution of genetic variants and DNA
meth-ylation to gene expression varies gene by gene. Studies of
Table 3. Most Significant Correlations of Methylation with Phenotype-wide SignificantcisRegulators and Expression
Probe CpG Gene Symbol r p value FDR q value Chr. Position Distance
32730_at cg00186701 TSPYL5 0.62 5.63E-06 3.00E-04 8 98359686 334
41619_at cg23283495 IRF6 0.61 8.88E-06 3.00E-04 1 208046402 300
39310_at cg24010952 BDKRB2 0.60 1.26E-05 3.00E-04 14 95740615 335
40936_at cg00850538 CRIM1 0.58 3.25E-05 5.80E-04 2 36435542 1359
1596_g_at cg09827833 TEK 0.54 1.12E-04 1.60E-03 9 27099492 51
34193_at cg00903242 CHL1 0.51 3.38E-04 4.02E-03 3 213161 489
37222_at cg24330042 GSTT1 0.48 8.28E-04 8.45E-03 22 22714159 72
1596_g_at cg04995717 TEK 0.47 1.25E-03 0.012 9 27099293 148
37902_at cg09142399 CRYZ 0.45 1.78E-03 0.014 1 74972682 1367
38241_at cg01269795 BTN3A3 0.39 7.73E-03 0.050 6 26548080 662
751_at cg08587864 PIGC 0.39 7.26E-03 0.050 1 170680235 382
374_f_at cg04394102 DDT 0.38 9.53E-03 0.056 22 22651863 156
40337_at cg13881341 FUT1 0.38 1.08E-02 0.059 19 53951027 568
33412_at cg19853760 LGALS1 0.37 1.26E-02 0.064 22 36401623 34
38241_at cg25193278 BTN3A3 0.36 1.66E-02 0.079 6 26548763 21
40578_s_at cg14414534 TMOD1 0.33 2.54E-02 0.11 9 99326304 46
41621_i_at cg21116314 ZNF266 0.31 3.64E-02 0.15 19 9407752 518
37584_at cg05293216 FANCG 0.31 4.10E-02 0.16 9 35070812 799
33689_s_at cg04394102 DDT 0.30 4.87E-02 0.16 22 22651863 156
Abbreviations: Probe, the probes of gene expression study; CpG, the CpG site as named by Illumina; r, Pearson correlation coefficient; p value, p value for linear regression; FDR q value, corrected for multiple tests by FDR; Chr., the chromosome where the gene and CpG site is located; Position, the location of CpG site; Distance, distance of CpG site to transcription start site. Gene symbol indicates the gene of the CpG site. Top 11 correlations have FDR q%0.05.
Figure 3. DNA Methylation and Gene Expression ofIRF6Plotted by Genotypes of rs2235375
DNA methylation (left) and gene expression (right) of IRF6 is correlated with genotypes of rs2235375. Thexaxis has three geno-types of rs2235375, andyaxis displays post-SVAþCOMBAT resid-uals representing DNA methylation and gene expression levels. Minor allele C of rs2235375 is significantly associated with high methylation level ofIRF6in acismanner and simultaneously asso-ciated with low gene expression ofIRF6.
both mQTLs and eQTLs can illuminate the potential
func-tional role of genetic variations in association studies of
complex disease.
Our results reveal numerous new instances of genetic
variability contributing to the variability of DNA
methyla-tion of specific genomic regions. In recent years,
genome-wide association has revealed many SNPs associated with
diseases or other phenotypes. In addition to effects on
protein coding, RNA splicing, and microRNA targeting,
the impact of genetic factors on DNA methylation is
clearly another important aspect to study in the evaluation
of SNP functional effects. The interactions between SNPs
and target CpG sites, particularly in those related to
trans
signals, may lead to identification of novel gene-gene
interactions. These findings could lead to the discovery
of novel mechanisms that determine gene-specific DNA
methylation, which has functional effects on phenotypes
including disease.
Supplemental Data
Supplemental Data include 16 figures and 13 tables and can be found with this article online athttp://www.cell.com/AJHG.
Acknowledgments
The authors thank the families of the individuals involved in this study. The Stanley Medical Research Institute and its Collabo-rators, Drs. Elashoff, Torrey, and Webster, generously gave us access to their sample collections. This work was supported by NARSAD Distinguished Investigator Awards (to E.S.G.), the Brain Research Foundation at the University of Chicago (to C.L.), NIH MH080425 (to C.L.), and NIH 5R01 MH61613 (to E.S.G.). Support from the Geraldi Norton Foundation and the Eklund Family is also gratefully acknowledged. We declare no conflict of interest. Received: August 21, 2009
Revised: December 18, 2009 Accepted: February 5, 2010 Published online: March 11, 2010
Web Resources
The URLs for data presented herein are as follows:
Online Mendelian Inheritance in Man (OMIM),http://www.ncbi. nlm.nih.gov/Omim/
R programming,http://www.r-project.org/
SMRI,http://www.stanleygenomics.org/stanley
References
1. Bird, A. (2002). DNA methylation patterns and epigenetic memory. Genes Dev.16, 6–21.
2. Bjornsson, H.T., Sigurdsson, M.I., Fallin, M.D., Irizarry, R.A., Aspelund, T., Cui, H., Yu, W., Rongione, M.A., Ekstro¨m, T.J., Harris, T.B., et al. (2008). Intra-individual change over time in DNA methylation with familial clustering. JAMA 299, 2877–2883.
3. Robertson, K.D. (2005). DNA methylation and human disease. Nat. Rev. Genet.6, 597–610.
4. Rakyan, V.K., Hildmann, T., Novik, K.L., Lewin, J., Tost, J., Cox, A.V., Andrews, T.D., Howe, K.L., Otto, T., Olek, A., et al. (2004). DNA methylation profiling of the human major histo-compatibility complex: A pilot study for the human epige-nome project. PLoS Biol.2, e405.
5. Chen, H., Taylor, N.P., Sotamaa, K.M., Mutch, D.G., Powell, M.A., Schmidt, A.P., Feng, S., Hampel, H.L., de la Chapelle, A., and Goodfellow, P.J. (2007). Evidence for heritable predis-position to epigenetic silencing of MLH1. Int. J. Cancer120, 1684–1688.
6. Heijmans, B.T., Kremer, D., Tobi, E.W., Boomsma, D.I., and Slagboom, P.E. (2007). Heritable rather than age-related envi-ronmental and stochastic factors dominate variation in DNA methylation of the human IGF2/H19 locus. Hum. Mol. Genet. 16, 547–554.
7. Oates, N.A., van Vliet, J., Duffy, D.L., Kroes, H.Y., Martin, N.G., Boomsma, D.I., Campbell, M., Coulthard, M.G., Whitelaw, E., and Chong, S. (2006). Increased DNA methylation at the AXIN1 gene in a monozygotic twin from a pair discordant for a caudal duplication anomaly. Am. J. Hum. Genet. 79, 155–162.
8. Boissonnas, C.C., Abdalaoui, H.E., Haelewyn, V., Fauque, P., Dupont, J.M., Gut, I., Vaiman, D., Jouannet, P., Tost, J., and Jammes, H. (2009). Specific epigenetic alterations of IGF2-H19 locus in spermatozoa from infertile men. Eur. J. Hum. Genet.18, 73–80.
9. Kerkel, K., Spadola, A., Yuan, E., Kosek, J., Jiang, L., Hod, E., Li, K., Murty, V.V., Schupf, N., Vilain, E., et al. (2008). Genomic surveys by methylation-sensitive SNP analysis identify sequence-dependent allele-specific DNA methylation. Nat. Genet.40, 904–908.
10. Knable, M.B., Barci, B.M., Webster, M.J., Meador-Woodruff, J., Torrey, E.F., and Stanley Neuropathology Consortium. (2004). Molecular abnormalities of the hippocampus in severe psychi-atric illness: Postmortem findings from the Stanley Neuropa-thology Consortium. Mol. Psychiatry9, 609–620, 544. 11. Torrey, E.F., Webster, M., Knable, M., Johnston, N., and Yolken,
R.H. (2000). The stanley foundation brain collection and neuropathology consortium. Schizophr. Res.44, 151–155. 12. Torrey, E.F., Barci, B.M., Webster, M.J., Bartko, J.J.,
Meador-Woodruff, J.H., and Knable, M.B. (2005). Neurochemical markers for schizophrenia, bipolar disorder, and major depres-sion in postmortem brains. Biol. Psychiatry57, 252–260. 13. American Psychiatric Association. (2000). DSM-IV. Diagnostic
and Statistical Manual of Mental Disorders, Fourth Edition (Washington, DC: American Psychiatric Association). 14. Price, A.L., Patterson, N.J., Plenge, R.M., Weinblatt, M.E.,
Shadick, N.A., and Reich, D. (2006). Principal components analysis corrects for stratification in genome-wide association studies. Nat. Genet.38, 904–909.
15. Purcell, S., Neale, B., Todd-Brown, K., Thomas, L., Ferreira, M.A., Bender, D., Maller, J., Sklar, P., de Bakker, P.I., Daly, M.J., and Sham, P.C. (2007). PLINK: A tool set for whole-genome association and population-based linkage analyses. Am. J. Hum. Genet.81, 559–575.
16. Bibikova, M., Le, J., Barnes, B., Saedinia-Melnyk, S., Zhou, L., Shen, R., and Gunderson, K.L. (2009). Genome-wide DNA methylation profiling using Infiniumassay. Epigenomics1, 177–200.
17. Eckhardt, F., Lewin, J., Cortese, R., Rakyan, V.K., Attwood, J., Burger, M., Burton, J., Cox, T.V., Davies, R., Down, T.A.,
et al. (2006). DNA methylation profiling of human chromo-somes 6, 20 and 22. Nat. Genet.38, 1378–1385.
18. Fan, S., and Zhang, X. (2009). CpG island methylation pattern in different human tissues and its correlation with gene expression. Biochem. Biophys. Res. Commun.383, 421–425. 19. Irizarry, R.A., Ladd-Acosta, C., Wen, B., Wu, Z., Montano, C., Onyango, P., Cui, H., Gabo, K., Rongione, M., Webster, M., et al. (2009). The human colon cancer methylome shows similar hypo- and hypermethylation at conserved tissue-specific CpG island shores. Nat. Genet.41, 178–186. 20. Ladd-Acosta, C., Pevsner, J., Sabunciyan, S., Yolken, R.H.,
Webster, M.J., Dinkins, T., Callinan, P.A., Fan, J.B., Potash, J.B., and Feinberg, A.P. (2007). DNA methylation signatures within the human brain. Am. J. Hum. Genet.81, 1304–1315. 21. Johnson, W.E., Li, C., and Rabinovic, A. (2007). Adjusting batch effects in microarray expression data using empirical Bayes methods. Biostatistics8, 118–127.
22. Leek, J.T., and Storey, J.D. (2007). Capturing heterogeneity in gene expression studies by surrogate variable analysis. PLoS Genet.3, 1724–1735.
23. Storey, J.D., and Tibshirani, R. (2003). Statistical methods for identifying differentially expressed genes in DNA microarrays. Methods Mol. Biol.224, 149–157.
24. Schilling, E., El Chartouni, C., and Rehli, M. (2009). Allele-specific DNA methylation in mouse strains is mainly deter-mined by cis-acting sequences. Genome Res.19, 2028–2035. 25. Shifman, S., Kuypers, J., Kokoris, M., Yakir, B., and Darvasi, A. (2003). Linkage disequilibrium patterns of the human genome across populations. Hum. Mol. Genet.12, 771–776. 26. Gowher, H., and Jeltsch, A. (2001). Enzymatic properties of
re-combinant Dnmt3a DNA methyltransferase from mouse: The enzyme modifies DNA in a non-processive manner and also methylates non-CpG [correction of non-CpA] sites. J. Mol. Biol.309, 1201–1208.
27. Okano, M., Xie, S., and Li, E. (1998). Cloning and characteriza-tion of a family of novel mammalian DNA (cytosine-5) meth-yltransferases. Nat. Genet.19, 219–220.
28. Okano, M., Bell, D.W., Haber, D.A., and Li, E. (1999). DNA methyltransferases Dnmt3a and Dnmt3b are essential for de
novo methylation and mammalian development. Cell 99, 247–257.
29. Fatemi, M., Hermann, A., Pradhan, S., and Jeltsch, A. (2001). The activity of the murine DNA methyltransferase Dnmt1 is controlled by interaction of the catalytic domain with the N-terminal part of the enzyme leading to an allosteric activa-tion of the enzyme after binding to methylated DNA. J. Mol. Biol.309, 1189–1199.
30. Li, E., Bestor, T.H., and Jaenisch, R. (1992). Targeted mutation of the DNA methyltransferase gene results in embryonic lethality. Cell69, 915–926.
31. Friso, S., Choi, S.W., Girelli, D., Mason, J.B., Dolnikowski, G.G., Bagley, P.J., Olivieri, O., Jacques, P.F., Rosenberg, I.H., Corrocher, R., and Selhub, J. (2002). A common mutation in the 5,10-methylenetetrahydrofolate reductase gene affects genomic DNA methylation through an interaction with folate status. Proc. Natl. Acad. Sci. USA99, 5606–5611.
32. Ball, M.P., Li, J.B., Gao, Y., Lee, J.H., LeProust, E.M., Park, I.H., Xie, B., Daley, G.Q., and Church, G.M. (2009). Targeted and genome-scale strategies reveal gene-body methylation signa-tures in human cells. Nat. Biotechnol.27, 361–368.
33. Movassagh, M., Choy, M.K., Goddard, M., Bennett, M.R., Down, T.A., and Foo, R.S. (2010). Differential DNA methyla-tion correlates with differential expression of angiogenic factors in human heart failure. PLoS ONE5, e8564.
34. Rauch, T.A., Wu, X., Zhong, X., Riggs, A.D., and Pfeifer, G.P. (2009). A human B cell methylome at 100-base pair resolu-tion. Proc. Natl. Acad. Sci. USA106, 671–678.
35. Scapoli, L., Palmieri, A., Martinelli, M., Pezzetti, F., Carinci, P., Tognon, M., and Carinci, F. (2005). Strong evidence of linkage disequilibrium between polymorphisms at the IRF6 locus and nonsyndromic cleft lip with or without cleft palate, in an Italian population. Am. J. Hum. Genet. 76, 180–183.
36. Ingraham, C.R., Kinoshita, A., Kondo, S., Yang, B., Sajan, S., Trout, K.J., Malik, M.I., Dunnwald, M., Goudy, S.L., Lovett, M., et al. (2006). Abnormal skin, limb and craniofacial morphogenesis in mice deficient for interferon regulatory factor 6 (Irf6). Nat. Genet.38, 1335–1340.