INFO- 2019 Primljeno / Received: 2010-01-15
UDK : 681.327:371.8:37 Izvorni znanstveni rad / Original Scientifi c Paper
E-LEARNING: PERCEPTIONS OF STUDENTS AT THE
JOSIP JURAJ STROSSMAYER UNIVERSITY OF OSIJEK
E-U
Č
ENJE: PERCEPCIJA STUDENATA
SVEU
Č
ILIŠTA JOSIPA JURJA STROSSMAYERA U OSIJEKU
Darko Duki
ć
Department of Physics, Josip Juraj Strossmayer University of Osijek, Osijek, Croatia Odjel za fi ziku, Sveučilište Josipa Jurja Strossmayera u Osijeku, Osijek, Hrvatska
Abstract
E-learning exhibits a growing presence at Croatian universities. Its implementation in the higher education system is part of the eff ort to improve the process of higher education and to make a signifi cant step forward in turning the Republic of Croatia into information and knowledge society. In these eff orts, one of the biggest problems is the unequal level of success in introducing e-learning, which is directly refl ected in its acceptance level among student population. Whereas certain higher education institutions, primarily those providing information and computer science programs, are already applying this modern learning and teaching concept to a high degree, the others have yet to start implementing its basic forms. Within the Croatian higher education system no adequate research has been carried out regarding student perception of e-learning, i.e. it has not been investigated to what extent it is accepted among the students. Without a comprehensive analysis of this aspect, it is impossible to take full advantage of all its potentials and properly formulate development strategies for the future. This paper seeks to fi ll this gap, at least to a certain degree. Adequate methods of descriptive and inferential statistics have been used in the analysis.
Sažetak
E-learning sve je zastupljeniji na hrvatskim sveučilištima. Njegovom implementacijom u sustavu visokog obrazovanja nastoji se unaprijediti proces studiranja te u tom segmentu napraviti značajniji iskorak Republike Hrvatske prema informacijskom društvu i društvu znanja. Pri tome jedan od najvećih problema predstavlja neujednačenost u dosezima uvođenja e-learninga, što se neposredno odražava na stupanj njegovog prihvaćanja među studentskom populacijom. Naime, dok pojedini fakulteti, poglavito oni koji izvode studije iz područja informacijskih i računalnih znanosti, već u velikoj mjeri primjenjuju taj suvremeni koncept učenja i poučavanja, na drugima tek započinju zaživljavati neke njegove osnovne forme. U sustavu hrvatskog visokog obrazovanja još uvijek nije na adekvatan način istraženo kako studenti percipiraju e-learning, odnosno koliko je on među njima akceptiran. Bez obuhvatne analize tog aspekta nije moguće u potpunosti iskoristiti sve njegove potencijale i pravilno oblikovati buduće razvojne strategije. Ovim radom nastojalo se barem u određenoj mjeri popuniti tu prazninu. U analizi su korištene odgovarajuće metode deskriptivne i inferencijalne statistike.
1. Introduction
For the past few years, Croatian higher education system has been going through a phase of complex reforms. They are intended to facilitate and expedite the involvement of Croatian research activities and higher education in the European integration processes. With this intention, the Bologna Declaration was signed in 2001, followed by the ratifi cation of the Lisbon Convention, which regulates the mutual recognition of higher education
qualifi cations within Europe /1/. The legislative framework for reforms was set out by amending the Scientifi c Activity and Higher Education Act. Owing to the complexity, sensitivity and scope of reforms, the relevant legislation was passed successively in the period between 2004 and 2007. Among other issues, the changes have covered the structure of institutions and bodies within research and higher education system, procedures for appointment to scientifi c/teaching grades and responsibilities of academic staff , evaluation of research institutions
and study programs, as well as the introduction of state grants as support measures for research and development /2/. In parallel with the legislative framework, the institutions required for successful implementation of reforms were established as well. This means there were several bodies in charge of monitoring the system of research work and higher education, and the Bologna process implementation. As a result of these activities, in 2005 a comprehensive restructuring of study programs was executed in line with the Bologna model, signifi cantly changing the previous character of higher education in the Republic of Croatia. At the same time, the procedure for recognizing foreign higher education qualifi cations was simplifi ed, and the quality assurance system initiated /3/. One of the basic strategic goals of the Republic of Croatia is becoming an information and knowledge society, which is closely linked with the higher education system and research /4/. Therefore, a special place in development strategies is reserved for the issues related to using information and communication technologies in this area /5/. Learning and teaching based on e-learning can be viewed as real-life application of such endeavors. The prerequisites for this in the form of equipment and know-how are provided for; however, the process of introducing e-learning into Croatian higher education is not
fl owing at a uniform rate. At the forefront of its implementation are those higher education institutions providing study programs in the area of information and computer sciences. They have been using diff erent modes of e-learning, which has improved the quality of education. On the other hand, a large number of institutions are only beginning with this process, using e-learning mostly as a simple support to traditional ways of teaching. The consequence of this situation is that too many students and teachers do not really understand the range of possibilities off ered by this modern concept of learning and teaching. The research presented in this paper is an att empt to quantify the att itudes of students at the Josip Juraj Strossmayer University of Osijek with regard to diff erent aspects of e-learning implementation. In this analysis, special att ention is given to the diff erences arising from the scientifi c
fi eld to which higher education institutions are devoted.
2. Literature Review
E-learning can be defi ned as a product of using networked information technology in teaching and learning /6/, or as a means of education that incorporates self-motivation, communication,
efficiency, and technology /7/. This modern teaching and learning concept, developed in order to improve traditional forms of education, has received much att ention in recent years through a number of studies. Some of those have analyzed students’ perceptions on e-learning. The opinions of students who had participated in e-learning-based programmes were examined in diff erent ways. In their research, K.L. Smart and J.J. Cappel /8/ focused on students’ perceptions of integrating online components in two undergraduate business courses. After applying t-tests and chi-square tests the authors concluded that participants in an elective course rated the online modules signifi cantly bett er than those in a required course. M.C. Rodriguez, A. Ooms and M. Montañez /9/ analyzed students’ perceptions of online-learning quality with a structural equation model. Their research yielded several conclusions. For students with online-learning experience, comfort with technology and motivation to acquire technology skills were related to satisfaction with online courses, which was related to perceived quality. For students with hybrid-learning experience, comfort was related to motivation and perceived quality, motivation was related to satisfaction, and satisfaction was related to perceived quality. For students with no online-learning experiences, comfort was related to motivation to acquire technology skills, but neither of these factors was related to perceived quality of online courses. In researching e-learning users’ att itudes, R. Elango, V.K. Gudep and M. Selvam /10/ applied factor analysis, which helped them to determine six factors refl ecting students’ perceptions of e-learning quality (relevance of course contents and delivery related factor, eff ectiveness of delivery mode related factor, instructor support and students’ commitment related factor, web-usage and online interaction related factor, course compliance and confi dence in the system related factor, and relevance of testing instruments and grading related factor). C. Keller and L. Cernerud /11/ categorized the advantages and disadvantages of e-learning in a qualitative content analysis. Their main conclusion was that the strategy of implementing the e-learning system at the university they had analyzed was more important in infl uencing students’ perceptions than the individual background variables. Within the Croatian higher education system, more att ention has been given recently to students’ att itudes regarding certain aspects of e-learning implementation. Ž. Požgaj and B. Knežević /12/ examined students’ interest in e-learning, and determined which advantages and disadvantages in comparison to traditional learning modes they
considered to be most important. After the analysis, the authors concluded that both groups were satisfi ed with this way of learning and teaching, and that communication between course convenors i.e. teachers and users should be encouraged.
3. Methods
Adequate methods of descriptive and inferential statistics were used for the analysis of the stated issues. In describing the respondent sample, both absolute and relative frequencies were established for each of the determined groups, and a two-way table was formed by grouping students by gender and scientifi c fi eld. Within research results, pertaining frequencies were also established for the variables defi ned as the modes of e-learning that students had encountered. For the research variables that represent students’ perceptions on various aspects of e-learning basic descriptive statistics were calculated and 95% confi dence intervals for the mean determined. Before the procedure of establishing the statistical signifi cance of diff erences, Kolmogorov-Smirnov and Shapiro-Wilk tests were used to test the
hypothesis that the data are normally distributed. Since the assumption that the samples come from normally distributed populations was discarded in almost all the cases, the signifi cance of diff erences was examined by the Kruskal-Wallis test, which belongs to a group of nonparametric tests. In our analysis, the diff erences confi rmed at the level p<0.05 were considered to be statistically signifi cant. The data analysis was performed with the support of the statistical packages SPSS and Statistica.
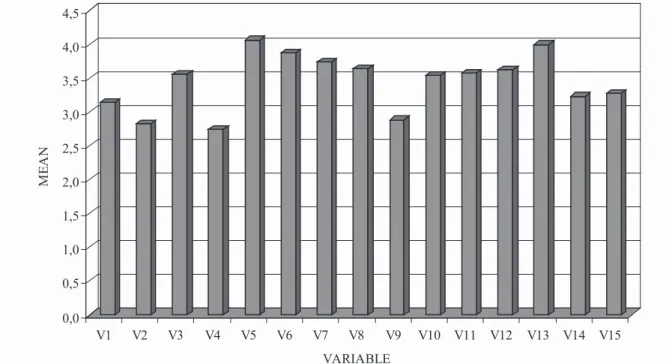
With the purpose of visualization, the bar chart of the means of the research variables is also presented.
4. Sample and variables
The research sample consisted of 215 respondents, all of them students at the Josip Juraj Strossmayer University in Osijek. The survey was conducted with 72 male students (33.49%) and 143 female students (66.51%).
Table 1 shows the distribution of the respondents according to the scientifi c fi eld covered by their respective faculties, i.e. the institutions they are enrolled in.
Table 1: Distribution of the respondents according to the scientifi c fi eld covered by their respective faculties
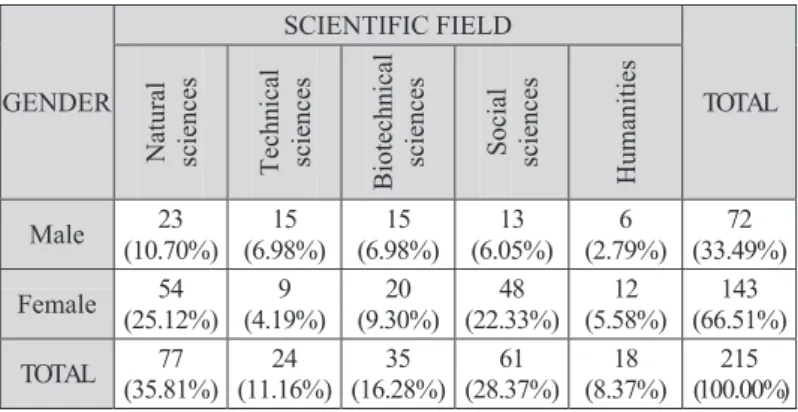
Table 2: Distribution of the respondents according to the gender and the scientifi c fi eld covered by their respective faculties
SCIENTIFIC FIELD NUMBER OF STUDENTS PERCENT Natural sciences 77 35.81 Technical sciences 24 11.16 Biotechnical sciences 35 16.28 Social sciences 61 28.37 Humanities 18 8.37 TOTAL 215 100.00 GENDER SCIENTIFIC FIELD TOTAL
Natural sciences Techn
ica l sciences Biotechn ical sciences So cial sciences Humaniti es Male (10.70%) 23 (6.98%) 15 (6.98%) 15 (6.05%) 13 (2.79%) 6 (33.49%) 72 Female (25.12%) 54 (4.19%) 9 (9.30%) 20 (22.33%) 48 (5.58%) 12 (66.51%) 143 TOTAL (35.81%) 77 (11.16%) 24 (16.28%) 35 (28.37%) 61 (8.37%) 18 (100.00%) 215
Simultaneous grouping of the features such as the respondents’ gender and the scientifi c fi eld
covered by their institution provides the data shown in Table 2.
To gain a bett er insight into the types of e-learning that Croatian students have been exposed to in the course of their studies up to that point, we determined the following research variables:
• Experience of downloading the course material from a teacher’s web site;
• Experience of using the Internet as an additional source of information;
• Experience of e-mail communication with the teacher;
• Experience of submitt ing their homework and/ or seminar papers by e-mail;
• Experience of taking tests and/or exams on a computer;
• Experience of using LMS, such as Moodle, WebCT and Sakai, in their education process; • Experience of participating in forum discussions
about the issues connected to their studies; • Experience of attending lectures available
through video conferencing technology. To establish the diff erences in e-learning perceptions in relation to the scientifi c fi eld covered by the faculties where our respondents are enrolled, the following 15 research variables were defi ned:
• Estimate of knowing about the possibilities of using e-learning in education (V1);
• Estimate of the level of e-learning development at the respondent’s faculty (V2);
• Estimate of the e-learning concept as such (V3); • Estimate of the possibility to study and graduate
by means of e-learning alone (V4)
• Estimate of the need for the traditional teaching to be supported by e-learning (V5);
• Estimate of the capability of e-learning to simplify the education process (V6);
• Estimate of the impact of e-learning on student creativity (V7);
• Estimate of the impact of motivation on e-learning effi ciency (V8);
• Estimate of grading objectivity when taking computer tests and exams (V9);
• Estimate of the possibility for e-learning to provide
fl exibility in choosing teaching times (V10); • Estimate of possibilities for “out-of-classroom”
education off ered by e-learning (V11);
• Estimate of the possibility to reduce the costs of higher education through e-learning (V12); • Estimate of the usefulness of e-learning for
people with limited mobility (V13);
• Estimate of lack of direct student-teacher contact as a drawback of e-learning (V14); • Estimate of lack of contact with fellow students
as a drawback of e-learning (V15).
The att itudes of the surveyed students were measured on the Likert scale comprising 5 grades, with 1 being the lowest, and 5 the highest grade of agreement with a particular statement.
5. Research results
In research sample, 208 students (96.74%) were downloading course materials from teachers’ web sites. Out of 215 respondents, 203 (94.42%) were using the Internet as an additional source of information. Student-teacher communication per e-mail was experienced by 165 respondents (76.74%), whereas 175 of them (81.4%) had the opportunity to submit their homework or seminar papers in this way. The survey showed that 113 students (52.56%) took tests or exams on a computer in the course of their studies. Only 47 students (21.86%) had the opportunity to use LMS, while 105 respondents (48.84%) stated that they participated in forum discussions related to their studies. The lowest number of students, only 41 (19.07%), had had the opportunity to hear a lecture in a video conference facility. All this indicates that advanced forms of e-learning were encountered by a relatively low number of students, mostly those enrolled in information and computer science programs.
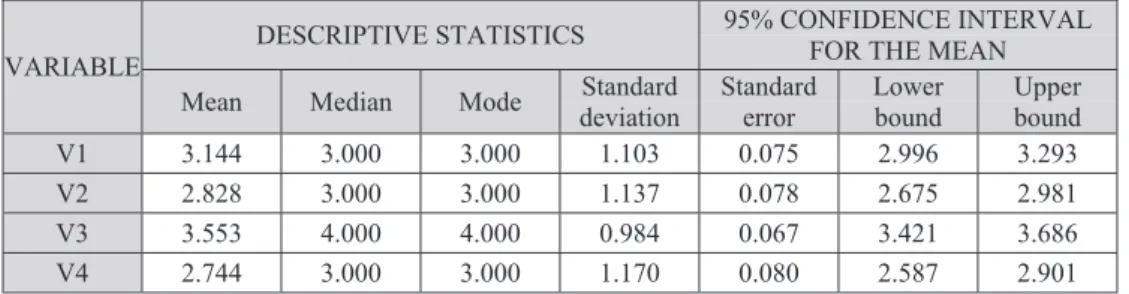
Table 3 contains the mean values and standard deviations calculated for the 15 research variables. Furthermore, the table shows 95% confi dence intervals for the mean.
VARIABLE
DESCRIPTIVE STATISTICS 95% CONFIDENCE INTERVAL FOR THE MEAN Mean Median Mode deviation Standard Standard error Lower bound Upper bound V1 3.144 3.000 3.000 1.103 0.075 2.996 3.293 V2 2.828 3.000 3.000 1.137 0.078 2.675 2.981 V3 3.553 4.000 4.000 0.984 0.067 3.421 3.686 V4 2.744 3.000 3.000 1.170 0.080 2.587 2.901
V5 4.060 4.000 5.000 1.064 0.073 3.917 4.203 V6 3.874 4.000 4.000 0.971 0.066 3.744 4.005 V7 3.740 4.000 4.000 1.026 0.070 3.602 3.878 V8 3.633 4.000 4.000 1.046 0.071 3.492 3.773 V9 2.884 3.000 2.000 1.144 0.078 2.730 3.038 V10 3.540 4.000 3.000 1.008 0.069 3.404 3.675 V11 3.572 4.000 3.000 1.052 0.072 3.431 3.713 V12 3.623 4.000 3.000 0.996 0.068 3.489 3.757 V13 3.995 5.000 5.000 1.202 0.082 3.834 4.157 V14 3.233 3.000 3.000 0.991 0.068 3.099 3.366 V15 3.274 3.000 3.000 1.125 0.077 3.123 3.426
On average, the respondents showed the greatest agreement with the statement that e-learning should be a supporting technique for traditional forms of teaching (V5). This was the only variable with the average grade over 4, followed by the usefulness of e-learning for people with limited
mobility (V13) and the estimate of the capability of e-learning to simplify the education process (V6). The lowest level of agreement received the possibility to study and graduate by means of e-learning alone (V4). The means of the analyzed variables are shown in Figure 1.
0,0 0,5 1,0 1,5 2,0 2,5 3,0 3,5 4,0 4,5 ME AN V1 V2 V3 V4 V5 V6 V7 V8 V9 V10 V11 V12 V13 V14 V15 VARIABLE
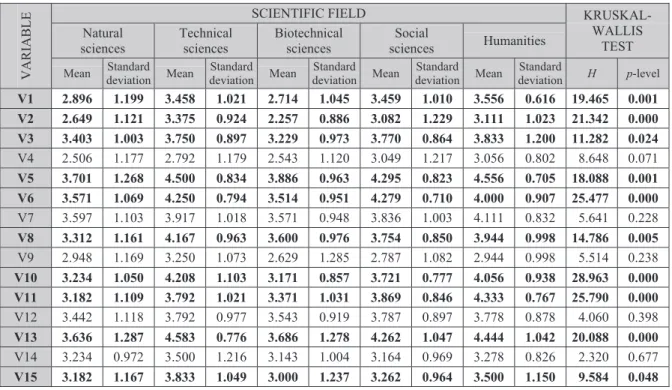
Figure 1. The means of the analyzed variables Table 4 contains the means and standard deviations
calculated for the analyzed research variables with regard to the scientifi c fi eld covered by a particular faculty where a student is enrolled, as well as the results of Kruskal-Wallis test, which was used to test the hypothesis that population medians are equal. The obtained results indicate that the most positive perceptions of e-learning are exhibited by students enrolled in technical sciences programs, whose curricula contain a number of courses incorporating
information and communication technologies. Students ranked second in positive perceptions are those studying at the Faculty of Philosophy in Osijek, which formally belongs to humanities. It should be noted here that this faculty runs a program of information sciences, where e-learning methods have been implemented to a signifi cant degree. On average, diff erent aspects of e-learning received the lowest grades from students enrolled in various programs of biotechnical and natural sciences.
VARIABLE
SCIENTIFIC FIELD
KRUSKAL-WALLIS TEST Natural sciences Technical sciences Biotechnical sciences Social sciences Humanities
Mean deviation Standard Mean deviation Standard Mean deviation Standard Mean deviation Standard Mean deviation Standard H p-level
V1 2.896 1.199 3.458 1.021 2.714 1.045 3.459 1.010 3.556 0.616 19.465 0.001 V2 2.649 1.121 3.375 0.924 2.257 0.886 3.082 1.229 3.111 1.023 21.342 0.000 V3 3.403 1.003 3.750 0.897 3.229 0.973 3.770 0.864 3.833 1.200 11.282 0.024 V4 2.506 1.177 2.792 1.179 2.543 1.120 3.049 1.217 3.056 0.802 8.648 0.071 V5 3.701 1.268 4.500 0.834 3.886 0.963 4.295 0.823 4.556 0.705 18.088 0.001 V6 3.571 1.069 4.250 0.794 3.514 0.951 4.279 0.710 4.000 0.907 25.477 0.000 V7 3.597 1.103 3.917 1.018 3.571 0.948 3.836 1.003 4.111 0.832 5.641 0.228 V8 3.312 1.161 4.167 0.963 3.600 0.976 3.754 0.850 3.944 0.998 14.786 0.005 V9 2.948 1.169 3.250 1.073 2.629 1.285 2.787 1.082 2.944 0.998 5.514 0.238 V10 3.234 1.050 4.208 1.103 3.171 0.857 3.721 0.777 4.056 0.938 28.963 0.000 V11 3.182 1.109 3.792 1.021 3.371 1.031 3.869 0.846 4.333 0.767 25.790 0.000 V12 3.442 1.118 3.792 0.977 3.543 0.919 3.787 0.897 3.778 0.878 4.060 0.398 V13 3.636 1.287 4.583 0.776 3.686 1.278 4.262 1.047 4.444 1.042 20.088 0.000 V14 3.234 0.972 3.500 1.216 3.143 1.004 3.164 0.969 3.278 0.826 2.320 0.677 V15 3.182 1.167 3.833 1.049 3.000 1.237 3.262 0.964 3.500 1.150 9.584 0.048
Table 4: Basic descriptive statistics with the results of the Kruskal-Wallis test
According to the results of Kruskal-Wallis test, the diff erences in the following student att itudes can be taken as statistically signifi cant: the estimate of knowing about the possibilities of using e-learning in education (V1), the estimate of the level of e-learning development at the respondent’s faculty (V2), the estimate of the e-learning concept as such (V3), the estimate of the need for the traditional teaching to be supported by e-learning (V5), the estimate of the capability of e-learning to simplify the education process (V6), the estimate of the impact of motivation on e-learning effi ciency (V8), the estimate of the possibility for e-learning to provide fl exibility in choosing teaching times (V10), the estimate of possibilities for “out-of-classroom” education off ered by e-learning (V11), the estimate of the usefulness of e-learning for people with limited mobility (V13) and the estimate of lack of contact with fellow students as a drawback of e-learning (V15). The results, which refer to these variables, are marked in the table. For another
fi ve research variables, defi ned as the estimate of the possibility to study and graduate by means of e-learning alone (V4), the estimate of the impact of e-learning on student creativity (V7), the estimate of grading objectivity when taking computer tests and exams (V9), the estimate of the possibility to reduce the costs of higher education through e-learning (V12) and the estimate of lack of direct student-teacher contact as a drawback of e-learning (V14), it was not confi rmed that there are statistically
signifi cant diff erences in perceptions of students as grouped in 5 determined groups.
6. Conclusion
Over the past few years, Croatian higher education has witnessed signifi cant advances in implementing e-learning. However, its application is for the most part limited to being a supporting tool to traditional forms of teaching and learning. Some of these e-learning forms are: using the computer to create multimedia presentations and do process simulations, downloading course materials from a teacher’s web site, using the Internet as the additional source of information, and submitt ing homework and/or seminar papers by e-mail. The results of our research indicate that the teaching staff at Croatian universities have also accepted e-mail as a means of communication with students, and are striving to adapt their classes and exam procedures to current trends. Without their support, the development of e-learning would not be possible.
Higher education institutions that have accepted and implemented e-learning to a signifi cant degree are mostly those providing information and computer science programs. Although they are still using the “traditional” classroom as a teaching venue, e-learning has changed its character in a relatively short time. Students at such faculties rely
heavily on using information and communication technologies. The result of these eff orts and tendencies is that virtually the whole education process, from teaching to exams, is based on an LMS platform. It is thus not surprising that students of information and computer sciences have the most positive att itudes towards e-learning and its possibilities. Statistical
signifi cance of diff erences in att itudes of students, who were grouped according to the scientifi c fi eld covered by their faculty, was confi rmed in 2/3 of the analyzed variables. It is to be expected that continued implementation of e-learning at Croatian universities would be refl ected in its increasing popularity among student population.
Notes
/1/ Rakić, V., Milanović Litre, I. (eds.): Education Sector Development Plan 2005 – 2010, Republic of Croatia - Ministry of Science, Education and Sports, Zagreb, 2005.
/2/ Primorac, D., Milanović Litre, I., Puljiz, I., Jurela-Jarak, I. (eds.): Pregled postignuća 2004.-2007., Drugo, dopunjeno izdanje, Ministarstvo znanosti, obrazovanja i športa Republike Hrvatske, Zagreb, 2007.
/3/ Ibidem
/4/ Barković, D., Dukić, G., Dukić, D.: Analysis of the Development of the University of Josip Juraj Strossmayer in Osijek and its Role in Building the Information Society, Fourth Interdisciplinary Symposium “Interdisciplinary Management Research IV”, Poreč, Croatia, June 1-3, 2007, In: Barković, D., Runzheimer, B. (eds.): Symposium Proceedings, University of Josip Juraj Strossmayer in Osijek - Faculty of Economics in Osijek / Pforzheim University of Applied Science - Pforzheim Graduate School, Osijek, 2008., pp. 488-504.
/5/ Šimić, D., Bošnjak, N., Vrankovečki Celegin, Ž., Vračić, T.: Operativni plan provedbe Programa e-Hrvatska 2007. s pregledom aktivnosti u 2007. godini, Središnji državni ured za e-Hrvatsku, Zagreb, 5/2007.
/6/ Naidu, S.: E-Learning - A Guidebook of Principles, Procedures and Practices, Second Revised Edition, CEMCA, New Delhi, 2006.
/7/ Berman, P. (ed.): E-Learning Concepts and Techniques, Institute for Interactive Technologies, Bloomsburg University of Pennsylvania, Bloomsburg, 2006.
/8/ Smart, K.L. Cappel, J.J.: Students’ Perceptions of Online Learning: A Comparative Study, Journal of Information Technology Education, Vol. 5, 2006, pp. 201-219.
/9/ Rodriguez, M.C., Ooms, A., Montañez, M.: Students’ Perceptions of Online-learning Quality given Comfort, Motivation, Satisfaction, and Experience, Journal of Interactive Online Learning, Vol. 7, No. 2, Summer 2008, pp. 105-125.
/10/ Elango, R., Gudep, V.K., Selvam, M.: Quality of E-Learning: An Analysis Based on E-Learners’ Perception of E-Learning, The Electronic Journal of e-Learning, Vol. 6, Issue 1, 2008, pp. 31-44., htt p://www.ejel.org/Volume-6/v6-i1/Elango_ et_al.pdf
/11/ Keller, C., Cernerud, L.: Student’s Perceptions of E-learning in University Education, Journal of Educational Media, Carfax Publishing (Taylor & Francis Group), Vol. 27, Nos. 1-2, 2002, pp. 55-67.
/12/ Požgaj, Ž., Knežević, B.: E-Learning: Survey on Students’ Opinions, 29th International Conference on Information Technology Interfaces, Cavtat/Dubrovnik, Croatia, June 25-28, 2007, In: Luzar-Stiffl er, V., Hljuz Dubric, V. (eds.): Proceedings of the ITI 2007, SRCE University Computing Centre, University of Zagreb, Zagreb, 2007, pp. 381-386.