University of Massachusetts Amherst University of Massachusetts Amherst
ScholarWorks@UMass Amherst
ScholarWorks@UMass Amherst
Doctoral Dissertations Dissertations and Theses
November 2016
Transit Preferential Treatments at Signalized Intersections:
Transit Preferential Treatments at Signalized Intersections:
Person-based Evaluation and Real-Time Signal Control
Person-based Evaluation and Real-Time Signal Control
Yashar Zeiynali FaridFollow this and additional works at: https://scholarworks.umass.edu/dissertations_2
Part of the Transportation Engineering Commons
Recommended Citation Recommended Citation
Zeiynali Farid, Yashar, "Transit Preferential Treatments at Signalized Intersections: Person-based Evaluation and Real-Time Signal Control" (2016). Doctoral Dissertations. 824.
https://scholarworks.umass.edu/dissertations_2/824
This Open Access Dissertation is brought to you for free and open access by the Dissertations and Theses at ScholarWorks@UMass Amherst. It has been accepted for inclusion in Doctoral Dissertations by an authorized administrator of ScholarWorks@UMass Amherst. For more information, please contact
TRANSIT PREFERENTIAL TREATMENTS AT
SIGNALIZED INTERSECTIONS: PERSON-BASED
EVALUATION AND REAL-TIME SIGNAL CONTROL
A Dissertation Presented by
YASHAR ZEINALI FARID
Submitted to the Graduate School of the
University of Massachusetts Amherst in partial fulfillment of the requirements for the degree of
DOCTOR OF PHILOSOPHY September, 2016
c
Copyright by Yashar Zeinali Farid 2016 All Rights Reserved
TRANSIT PREFERENTIAL TREATMENTS AT
SIGNALIZED INTERSECTIONS: PERSON-BASED
EVALUATION AND REAL-TIME SIGNAL CONTROL
A Dissertation Presented by
YASHAR ZEINALI FARID
Approved as to style and content by:
Eleni Christofa, Chair
John Collura, Member
Ahmed Ghoniem, Member
Richard N. Palmer, Department Head Civil and Environmental Engineering
ACKNOWLEDGMENTS
This work was partially funded by the US DOT through the New England Uni-versity Transportation Center.
ABSTRACT
TRANSIT PREFERENTIAL TREATMENTS AT
SIGNALIZED INTERSECTIONS: PERSON-BASED
EVALUATION AND REAL-TIME SIGNAL CONTROL
SEPTEMBER, 2016
YASHAR ZEINALI FARID B.S., URMIA UNIVERSITY
M.S., TARBIAT MODARES UNIVERSITY
Ph.D., UNIVERSITY OF MASSACHUSETTS AMHERST
Directed by: Professor Eleni Christofa
Efficient public transportation has the potential to relieve traffic congestion and improve overall transportation system performance. In order to improve transit ser-vices, Transit Preferential Treatments (TPT) are often deployed to give transit ve-hicles priority over other veve-hicles at an intersection or along a corridor. Examples of such treatments are exclusive bus lanes, queue jumper lanes, and signal prior-ity strategies. The objective of this study is threefold: 1) perform a person-based evaluation of alternative TPTs when considered individually and in combination, 2) develop a bus travel time prediction model along a signalized arterial, and 3) develop a real-time signal control system, which minimizes total person delay at an isolated intersection accounting for stochasticity in transit vehicle arrivals. This study first develops analytical models to estimate person delay and person discharge flow when
various spatial and time TPTs are present at signalized intersections with and with-out near-side bus stops. This part of the research has contributed to the modeling of traffic along signalized arterials by improving the previous models to evaluate various TPT strategies with and without nearside bus stops. Next, a robust method to pre-dict bus travel time along a signalized arterial is developed. This part of the research contributes to the bus travel time prediction models by estimating the status of traf-fic signals using automated vehicle location (AVL) data. The model decomposes bus travel time along signalized arterials and infers trajectories of the transit vehicles. Finally, the real-time signal control system is developed to provide priority to transit vehicles by assigning weights to transit vehicle delays based on their passenger oc-cupancies as part of the optimization objective function. The system optimizes the movements by minimizing total person delay at the intersection. The system esti-mates bus arrival time at the intersection stopline and uses the developed analyitical models in the first part of the research to evaluate the person delay measure. This part of the research contributes to the real-time signal control systems by providing a priority window to account for the stochasticity in bus arrival times.
TABLE OF CONTENTS
Page ACKNOWLEDGMENTS . . . .iv ABSTRACT. . . v LIST OF TABLES. . . x LIST OF FIGURES. . . .xi GLOSSARY . . . .xiv CHAPTER 1. INTRODUCTION . . . 1 1.1 Motivation . . . 1 1.2 Problem Statement . . . 2 1.3 Research Questions . . . 3 1.4 Research Contributions . . . 4 1.5 Dissertation Organization . . . 5 2. LITERATURE REVIEW . . . 62.1 Transit Preferential Treatments . . . 6
2.1.1 Space Transit Preferential Treatments . . . 6
2.1.1.1 Dedicated Bus Lanes (DBL) . . . 7
2.1.1.2 Queue Jumper Lanes (QJL) . . . 9
2.1.1.3 Intermittent Bus Lanes (IBL) . . . 12
2.1.1.4 Bus Lanes with Intermittent Priority (BLIP) . . . 16
2.1.2 Time Transit Preferential Treatments . . . 16
2.1.2.1 Passive Priority Strategies . . . 17
2.1.3 Impacts on Other Traffic . . . 25
2.1.4 Near-side Bus Stops Presence . . . 25
2.2 Bus Travel Time Prediction . . . 26
2.3 Real-time Signal Control Systems with Transit Priority . . . 30
2.4 Stochasticity in Transit Vehicle Arrivals . . . 38
2.5 Summary of the Literature . . . 41
3. TPT EVALUATION. . . 45
3.1 Transit Preferential Treatment Alternatives . . . 45
3.2 Analytical Model for Evaluation of the MOEs . . . 46
3.2.1 Auto Delay . . . 50
3.2.1.1 Base Case . . . 50
3.2.1.2 Effect of Near-side Bus Stop . . . 54
3.2.2 Bus Delay . . . 58
3.2.2.1 Mixed Traffic Lane . . . 58
3.2.2.2 Dedicated Bus Lane . . . 61
3.2.2.3 Queue Jumper Lane . . . 61
3.3 Evaluation . . . 63
3.3.1 Test Site . . . 64
3.3.2 Analytical Model Tests . . . 65
3.3.3 Microsimulation Tests . . . 65
3.3.4 Results . . . 67
3.3.4.1 Without Nearside Bus Stop . . . 67
3.3.4.2 With Nearside Bus Stop . . . 75
3.4 Summary of Findings . . . 81
4. BUS TRAVEL TIME PREDICTION . . . 84
4.1 Methodology . . . 84
4.1.1 Travel Time Decomposition . . . 85
4.1.2 Linear Regression . . . 89
4.1.3 MIQP Model . . . 89
4.1.4 Mathematical Program Formulation . . . 95
4.2.1 Test Site . . . 99
4.2.2 Data . . . 100
4.2.3 Results . . . 101
4.3 Summary of Findings . . . 107
5. REAL-TIME TRAFFIC SIGNAL CONTROL. . . 109
5.1 Methodology . . . 109
5.2 Mathematical Model . . . 110
5.2.1 Auto delay estimation . . . 113
5.2.2 Transit delay estimation . . . 117
5.2.2.1 Case TW . . . 117
5.2.2.2 Case TO . . . 122
5.2.3 Mathematical Program Formulation . . . 126
5.2.4 Objective Function . . . 126 5.2.5 Constraints . . . 127 5.3 Application . . . 129 5.3.1 Test Site . . . 130 5.3.2 Simulation Tests . . . 131 5.3.3 Results . . . 132 5.4 Summary of Findings . . . 134 6. CONCLUSION . . . 137 6.1 Summary of Findings . . . 137 6.1.1 TPT Evaluation . . . 137
6.1.2 Bus Arrival Prediction . . . 139
6.1.3 Real-time Traffic Signal Control Plan . . . 139
6.2 Research Contributions . . . 140
6.3 Future Work . . . 141
6.3.1 TPT Evaluation . . . 141
6.3.2 Bus Arrival Prediction . . . 141
6.3.3 Real-time Traffic Signal Control Plan . . . 141
LIST OF TABLES
Table Page
2.1 Field Studies on Transit Preferential Treatments . . . 43
2.2 Simulation Studies on Transit Preferential Treatments . . . 44
4.1 CPLEX Output of the MIQP Model . . . 101
4.2 MIQP Parameter Estimates . . . 102
4.3 Linear Regression Model Parameter Estimates. . . 103
4.4 Generalized Errors of the MIQP and Linear Regression Models. . . 103
5.1 Vehicle Delays . . . 133
LIST OF FIGURES
Figure Page
2.1 Dedicated bus lane (source: Wikipedia) . . . 7
2.2 Queue jumper lane - Type 1 . . . 10
2.3 Queue jumper lane - Type 2 . . . 10
2.4 Intermittent bus lane (source: Viegas et al. (2007)) . . . 13
2.5 Flashing lights of the intermittent bus lane in Melbourne, Australia (Currie and Lai, 2008) . . . 14
2.6 VMS of the intermittent bus lane in Melbourne, Australia (source: Currie and Lai (2008)) . . . 15
2.7 Example of passsive TSP: offset adjustment (source: Christofa (2012)) . . . 18
2.8 Phase advance and phase extension (Christofa, 2012) . . . 22
2.9 Phase insertion and phase rotation (source: Christofa (2012)) . . . 23
2.10 Simplified real-time signal control architecture . . . 30
2.11 TSP implementation in RHODES (source: Mirchandani and Lucas (2001)) . . . 34
2.12 Priority windows for TSP (source: Wen et al. (2012)) . . . 39
2.13 Prediction interval in TSP (source: Kim and Rilett (2005)) . . . 40
3.1 Vehicle delay estimation for platoon arrivals and transit vehicles . . . 48
3.2 Platoons formed at an intersection approach with a near-side bus stop . . . 55
3.3 Time-space diagrams for a bus not utilizing the queue jumper lane . . . 62 3.4 Time-space diagrams for a bus utilizing the queue jumper lane . . . 63 3.5 Test site for TPT evaluation . . . 66 3.6 Percent change in person delay for the northbound direction at the
intersection of San Pablo Avenue and Cedar Street with 30
passengers per bus (without bus stop) . . . 68 3.7 Discharge flow rate for the northbound direction at the intersection of
San Pablo Avenue and Cedar Street with 30 passengers per bus
(without bus stop) . . . 69 3.8 Percent change in person delay for the northbound direction at the
intersection of San Pablo Avenue and Gilman Street with 30
passengers per bus (without bus stop) . . . 70 3.9 Discharge flow rate for the northbound direction at the intersection of
San Pablo Avenue and Gilman Street with 30 passengers per bus
(without bus stop) . . . 71 3.10 Percent change in total person delay for cross-streets at the
intersection of San Pablo Avenue and Cedar Street (without bus
stop) . . . 74 3.11 Percent change in total person delay for cross streets at the
intersection of San Pablo Avenue and Gilman Street (without bus stop) . . . 75 3.12 Microsimulation results for the percent change in person delay of the
northbound direction at the intersection of San Pablo Avenue and Cedar Street with double bus frequency (without bus stop) . . . 76 3.13 Analytical model results for the percent change in person delay of the
northbound direction at the intersection of San Pablo Avenue and Cedar Street with double bus frequency (without bus stop) . . . 77 3.14 Percent change in person delay for the northbound direction at the
intersection of San Pablo Avenue and Cedar Street with 40
passengers per bus (without bus stop) . . . 78 3.15 Person delay results of the analytical model and simulation tests for
San Pablo Avenue northbound direction at the intersection with
3.16 Percent change in person delay results of the analytical model and simulation tests for San Pablo Avenue northbound direction at
the intersection with Cedar Street (with bus stop) . . . 79
3.17 Queue jumper length effect on person delay for San Pablo Avenue northbound direction at the intersection with Cedar Street (with bus stop) . . . 81
4.1 Urban arterial layout . . . 88
4.2 Cases of bus arrival times at the intersection stop line. . . 92
4.3 Intersection delay cases . . . 93
4.4 Test site . . . 100
4.5 Intersection delay for the morning, midday, and afternoon periods . . . 105
4.6 Estimated trajectories of two sample buses . . . 106
5.1 Auto delay cases . . . 114
5.2 Transit delay cases: transit vehicle traveling within the platoon . . . 118
5.3 Transit delay cases: transit vehicle traveling outside the auto platoon . . . 124
5.4 Test Site: Lane Groups, Phasing, and Green Times . . . 131
5.5 Percent change in person delay without priority window . . . 134
5.6 Percent change in person delay with priority window . . . 135
5.7 Percent change in person delay with vehicle-based optimization . . . 135
GLOSSARY
Chapter 3
C: cycle length [sec];
Dj,T: total delay of autos in lane group j during cycle T [veh-sec];
dj,T: delay of a single vehicle in the platoon in lane groupj during a cycle T [sec]; db,T: delay of a single bus b during a cycle T [sec];
db,f: bus dwell time at bus stop f for bus b [sec];
Gej: effective green time for the phase that serves lane group j [sec];
j: lane group index (movement);
Kj: jam density [veh/ft];
Nj,Ti −1: case i residual queue size of lane groupj at the end of the previous cycle
T -1 [veh];
nb,T : position of busb in the platoon during cycleT [veh]; Pj,T: total platoon size of lane group j during cycle T; Pj,Ti : case i platoon size of lane group j during cycle T;
Qj,T: auto vehicle discharge flow during cycleT [vph];
R(1)j : component of the red time from the beginning of the cycle until the start of the green time for lane group j [sec];
R(1)j ,N ext: Rj(1) of the next cycle [sec];
R(2)j : component of the red time from the end of the green until end of the cycle for lane group j [sec];
sj: total saturation flow of lane group j [vpm]; si
j: saturation flow for the vehicles in lane group j that belong to case i [vpm]; T: signal cycle index;
tb,q: time it takes to serve the vehicles that are in queue in front of bus b [sec]; tj,T: platoon arrival time at the intersection of lane group j during cycle T [sec]; tb,T: arrival time of bus b at the intersection during cycle T if the bus does not
dwell at a bus stop [sec];
tD
b,T: arrival time of busb at the intersection during cycle T if the bus dwells at a
bus stop [sec];
tl,T: waiting time before a lane change occurs for vehicles that change lanes during
cycleT [sec];
Xb: bus position from the stopline when it arrives in queue [ft]; Xf: distance of bus stop f from the stopline [ft];
Xqj: queue jumper lane length [ft]; αp: the portion of lanes serving vehicles
Chapter 4
IN ={1,2, .., N}: Set of network intersections,
IB ={1,2, .., B}: Set of buses traveling through the arterial segment, IA={1,2, .., i}: Set of ordered AVL records,
IK ={1,2, , K}: Set of bus stops,
INi,j is a subset of IN that includes the signalized intersections between AVL
records iand j,
Ib is a subset of IA that includes the AVL records for bus b ∈ IB,
IKi,j is a subset of IK that includes the bus stops between AVL recordsi and j,
¯
p: Average bus pace along a segment (sec/mile), ¯
v: Average bus speed along a segment (miles/sec),
tngr: Beginning of the green signal indication for the direction of interest at inter-section n as measured from the beginning of the cycle (sec),
tn
b: Bus b arrival time at intersection n as measured from the beginning of the
cycle (sec),
ttu,nb : Busbtravel time from the AVL record reported upstream of the intersection
n to the intersection n stop line (sec), ˆ
ttb,i,j : Bus b travel time from AVL record i toj,
¯
wk: Average dwell time at bus stop k (sec/bus), Dn
b,1, Db,n2, Dnb,3,Db,n4: Delay of bus b at intersection n for different cases (sec),
¯
Dn: Average bus delay at intersection n (sec),
Dn
b: Delay of busb at intersectionn (sec),
¯
an: Average lost time at intersectionn (sec),
¯
ad: Average acceleration/deceleration lost time (sec),
xn
b,1, xnb,2, xb,n3, xnb,4: Binary variables indicating the delay case that bus b at
inter-section n belongs to,
yb,n1,yb,n2: Binary variables indicating the bus arrival time case that busb at inter-section n belongs to,
tb,i: Busb AVL record itime stamp (sec),
tu,nb : Bus b most recent time stamp upstream of intersection n (sec) as measured from the beginning of a cycle (sec),
lb,i,j: distance traveled by bus b between recordsi and j (miles),
lu,nb : distance between most recent record of bus b upstream of intersection n and intersection n stop line (miles),
ADb,i,j: Number of acceleration/deceleration events from AVL record i to j for
bus b,M: Big number,
Cn: Signal cycle length of intersectionn (sec),
rn: Signal red phase duration for the direction of interest at intersection n (sec), gn: Signal green phase duration for the direction of interest at intersectionn(sec).
Chapter 5
Ma ={1,2, ..,6}: Set of auto delay cases, Mb ={1,2, ..,16}: Set of transit delay cases,
J ={1,2, .., j}: Set of lane groups,
I ={1,2, .., i}: Set of signal phases,
B ={1,2, .., b}: Set of total transit vehicles during cycle T,
Bj = {1,2, .., bj}Set of the transit vehicles traveling on the lane group j during
cycleT,
Gej: effective green time for the phase that serves lane group j (sec),
zam
j : variable introduced to defeat bilinearity in determining delay of autos
trav-eling in lane group j for case m,
zbmj,b: variable introduced to defeat bilinearity in determining delay of transit vehicle b traveling in lane group j for case m,
xm
j : Binary variable indicating the delay case that autos in lane group j belong
to,
yj,bm: Binary variable indicating the transit vehicle sub-case that transit vehicle b
in lane group j belongs to,
Eb1, Eb2, and Eb3: Binary variable indicating the transit vehicle case (i.e., within, ahead, or behind the platoon) that transit vehicle b in lane group j belongs to,
C: cycle length (sec),
Nj,T−1: residual queue size of lane group j at the end of the previous cycle T -1
(veh),
Pj,T: total platoon size of lane group j during cycle T, sj: total saturation flow of lane group j (vpm),
tbb,T: arrival time of transit vehicle b at the intersection during cycle T (sec), tj,T: platoon arrival time at the intersection of lane group j during cycle T (sec), tT: beginning of the cycle (sec),
¯
oa average auto occupancy (passenger/car),
¯
ob average transit vehicle occupancy (passenger/transit vehicle),
Zα/2 = the value from the standard normal distribution for the confidence level
(1−α)%,
σ = standard deviation of transit arrival time predictions,
Daj,T: total delay of autos in lane group j during cycle T (veh-sec),
Dasmj, T: delay of autos in lane group j during cycle T for delay casem m∈Ma
(veh-sec),
Dbj,T: total delay of transit vehicles in lane group j during cycle T (veh-sec), Dbmj,T: delay of transit vehicles in lane group j during cycle T for delay case m m∈Mb (veh-sec),
R(1)j : component of the red time from the beginning of the cycle until the start of the green time for lane group j (sec),
R(2)j : component of the red time from end of the green until end of the cycle for lane group j (sec),
CHAPTER 1
INTRODUCTION
1.1
Motivation
Public transportation helps improve quality of life and is a crucial part of solutions to address economic, energy, and environmental challenges in urban areas. High quality public transportation improves mobility for people especially the ones that are unable to drive (elderly, teenagers, and the disabled), provides access to activity areas (e.g. work, school, and shopping centers), improves environmental and ecological sustain-ability, and reduces traffic congestion and fuel consumption. Improvements in transit performance provide additional incentives for travelers to switch modes and could potentially reduce traffic congestion. According to the Texas A&M Transportation Institute report (Schrank et al., 2012), if public transportation were not available in the urban areas that were studied, congestion related costs would have risen by nearly $21 billion for 2011.
Public transportation system performance can be improved by giving transit ve-hicles, which have higher passenger occupancy than cars, priority at the intersections or along corridors. These strategies may significantly increase the person through-put of the system. Thus, in recent years, urban traffic management policies have increasingly differentiated between transit vehicles and cars by providing priority to the transit vehicles.
In order to provide priority to transit vehicles, transit preferential treatments (TPTs) are deployed. TPTs give transit vehicles priority over other vehicles at an intersection or along a corridor. The primary objective of TPTs is to reduce transit
travel times by shortening or eliminating the time spent by transit vehicles waiting for a queue clearance or a green signal indication. Substantial delay reductions can further lead to improved transit operations and service reliability and consequently increased transit ridership.
Transit signal priority (TSP) is a TPT strategy which adjusts signal timings to favor transit vehicles approaching a signalized intersection. TSP strategies as well as other applications of intelligent transportation systems (ITS) including advanced traveler information systems (ATIS) rely on short-term travel time predictions. Accu-rate predictions can improve bus service reliability and traffic signal control efficiency while providing TSP.
Real-time signal control systems is an effective way of providing TSP. Real-time signal control systems with TSP are responsive to transit requests as well as the current traffic conditions in real-time. These systems provide priority while optimizing given traffic performance criteria such as vehicle delay, person delay, and transit delay. In general, real-time signal control systems with TSP require traffic detection (both transit and non-transit vehicles) and communication systems, estimation of appropriate performance measures, estimation of traffic demand and bus arrival time to stopline, and a decision system.
1.2
Problem Statement
The need for efficient and sustainable management of transportation systems is steadily increasing due to growing demand in urban networks. Urban congestion, higher fuel consumption and emissions are major problems of large urban areas, but can be mitigated by efficient transit systems. Transit preferential treatments are promising strategies for reducing transit delay and improving transit performance. Some treat-ments modify roadway segtreat-ments (space priority strategies) such as dedicated bus
lanes, queue jumper lanes, and intermittent bus lanes while other treatments provide priority by adjusting signal timing settings (time priority strategies).
Implementing priority strategies are often expensive, especially space priority strategies. Pre-evaluation of these strategies would help planners and decision makers in assessing the advantages and disadvantages of the plans before their deployment. Currently, most of the agencies evaluate TPT plans using micro-simulation software packages which require considerable time and money. Accurate and reliable analytical models could be used for such assessments without the need for expensive simulations. The analytical models can also be used in real-time signal control systems to evaluate various performance measures.
Among various transit signal priority strategies, real-time TSP systems can po-tentially handle traffic movements through an intersection more efficiently, since they can adjust signal timing plans based on real-time data. Various real-time TSP models have been developed in recent years. These models often rely on predictions of bus arrival time. Accurate prediction of bus arrival time at an intersection stopline can improve the efficiency of the real-time TSP systems. Transit vehicle travel time is subject to traffic conditions as well as driver behavior. Also, bus dwell times at bus stops vary due to different factors such as the number of passengers boarding and alighting, the fare collection system as well as the bus and bus stop design. Variabil-ity in transit arrival times may affect the qualVariabil-ity of priorVariabil-ity timings, which in turn affects the effectiveness of the TSP system. Accurate bus travel time prediction as well as the stochasticity of bus arrival times and its impact on the real-time TSP systems require further investigation.
1.3
Research Questions
• What are the impacts of implementing individual or combined TPTs on person delay and person discharge flows along signalized arterials?
• How bus arrival time at intersection stopline can be estimated more accurately?
• How should real-time signal control systems be designed to minimize person delay while accounting for stochasticity in bus arrivals?
1.4
Research Contributions
The objective of this study is threefold: First, this study performs a person-based eval-uation of alternative TPTs when considered individually and in combination. This study develops analytical models based on kinematic wave theory as well as simu-lation models in order to perform a person-based evaluation of various spatial and time TPTs when near-side bus stops are present at signalized intersections. Second, a robust model to predict bus travel time using low resolution Automated Vehicle Lo-cation (AVL) data is presented. Finally, this study proposes a real-time signal control system which minimizes total person delay at an isolated intersection accounting for stochasticity in transit vehicle arrivals to provide priority to them. The contributions of this dissertation are as follows:
• Development of analytical models to evaluate various space (e.g., queue jumper lane and dedicated bus lane) and time (e.g., transit signal priority) priority strategies along signalized arterials with and without nearside bus stops. The analytical models evaluate person-based performance measures including per-son delay and perper-son discharge flow using Kinematic Wave Theory. Vehicles approaching the signalized intersection are considered to travel within platoons. • Development of a bus travel time prediction model using data obtained from AVL systems. The proposed model estimates traffic signal status using the AVL records of buses and provides more accurate predictions in comparison to
a simple linear regression model. The proposed model decomposes bus travel time into its components including running travel time, dwell times at bus stops, and delays at intersections. Unlike other studies, the developed model in this research estimates intersection delay for individual buses rather than estimating an average delay over all buses thus, improves prediction accuracy.
• Development of a real-time traffic signal control with TSP which takes into account stochasticity in bus arrivals and provides a priority window for buses. The control system minimizes total person delay at an intersection. The per-son delay measures are determined using the analytical models developed for the TPT evaluation. This study is unique since the developed control system provides a priority window to make sure that buses can pass the intersection (if arriving during the green phase) considering a certain confidence level to overcome the randomness in the bus arrival time predictions.
1.5
Dissertation Organization
The rest of the dissertation is organized as follows: In Chapter 2 previous studies on TPT evaluation, bus travel time prediction, and real-time signal control systems are reviewed. Chapter 3 presents the formulation of the analytical models for estimating different person-based measures of various TPT strategies and the model application. In Chapter 4, the development of the bus travel time prediction model using low res-olution AVL data as well as the application of the model are presented. In Chapter 5, a real-time signal control plan development and its application are discussed. Finally, Chapter 6 includes a summary of the key findings, the dissertation’s contribution, and future research directions.
CHAPTER 2
LITERATURE REVIEW
This chapter reviews previous studies on transit preferential treatments, bus travel time prediction, real-time signal control with TSP systems, and stoachasticity in transit vehicle arrivals. It concludes with the summary of the literature review that provides insights to motivate research.
2.1
Transit Preferential Treatments
TPTs can be categorized in space and time priority strategies. The impact of both space and time TPTs on traffic and transit operations has been extensively investi-gated through field, simulation, and analytical studies. In the field studies, before and after impacts associated with TPT deployment have been assessed. In the field stud-ies, typically different measures of effectiveness (MOEs) are used to assess impacts associated with preferential treatment deployment. These MOEs commonly include travel time, number of stops, transit delay, schedule adherence, average person delay, and cross-street delays. Use of simulation models, including VISSIM, INTEGRA-TION, AIMSUN, and PARAMICS, is the most common TPT evaluation method. There are only a few studies that have utilized analytical models for TPT evaluation purposes.
2.1.1 Space Transit Preferential Treatments
Space priority considers special facilities such as dedicated bus lanes (DBL), queue jumper lanes (QJL), or intermittent bus lanes (IBL) for public transit vehicles that
allow them to bypass standing traffic queues. Delay due to congestion can be reduced by mitigating congestion and/or implementing space preferential treatments through the creation of dedicated space for transit vehicles. These treatments allow transit vehicles to bypass standing traffic queues, thereby reducing their travel times. Space priority strategies are often effective in reducing delays due to congestion, however these solutions can be expensive or even infeasible, especially in dense urban areas, due to inadequate or expensive urban space.
2.1.1.1 Dedicated Bus Lanes (DBL)
DBLs (also known as exclusive bus lanes, reserved bus lanes or just bus lanes) provide exclusive right-of-way to buses ensuring that they are not delayed by other traffic (Fig-ure 2.1). The effectiveness of DBLs in increasing transit speed and improving transit reliability in arterials has been thoroughly investigated in the literature. However, in areas with intense commercial and residential developments, allocating a bus lane per direction could often be very expensive and in some cases infeasible due to space limitations. Thus, single reversible DBLs are often introduced to reduce deployment costs and increase in delays.
Field Studies
Surprenant-Legault and El-Geneidy (2011) analyzed a DBL that was implemented on Boulevard Saint-Michelusing, Montreal, Canada. The analysis of real-world data showed that the DBL had a substantial positive effect on the running time, reliability and on-time performance of the bus routes. Total running time for the buses decreased by 1.3% to 2.2%, and schedule adherence improved by 65%.
Sakamoto et al. (2007) evaluated the effects of a bus rapid transit (BRT) line implemented in Shizuoka City, Japan. The BRT line included a 3 km long DBL and a bus priority signal system. Before and after analysis indicated that the mean total bus travel time on the two studied lines dropped by 6.2% and schedule adherence improved by 17% to 58%.
Reserved lanes have also been implemented for rail transit systems such as trams. Currie et al. (2013) evaluated the effect of a dedicated transit way on tram perfor-mance in Melbourne, Australia. In this study regression models were developed using Automatic Vehicle Monitoring (AVM) data to measure the effect of implementing the dedicated transit way as well as transit signal priority. Before and after analysis indi-cate that the dediindi-cated transit way deployment reduced tram run time by 1.6% and run time variability by 10.2%.
Simulation Studies
Iswalt et al. (2011) developed a micro-simulation model to evaluate a proposed single reversible DBL implementation on Stevens Creek Boulevard, San Jose, California, using the VISSIM micro-simulation software. Results of the study show that a single reversible DBL led to travel time savings of over 10%.
Arasan et al. (2010) analyzed the impact of DBL under highly heterogeneous traffic condition using the HETEROSIM simulation software. In this study the im-pact of the volume-to-capacity ratio on the non-transit vehicles level of service (LOS)
was analyzed. This study also estimated the probability of switching from a personal vehicle to transit when DBLs are provided.
Analytical Studies
Li et al. (2009) developed an analytical model to evaluate the impacts of a single DBL versus double DBLs implemented as part of a BRT system. In a single DBL, one lane is dedicated to buses in both directions. The study presented an optimization model to minimize the weighted sum of the dwell time and travel time of the buses in the BRT system. A case study analysis concluded that total travel time of the single DBL system is similar to that of a BRT system with double DBL when the headway is longer than 20 minutes. Shorter headways increase bus travel time for the single DBL system due to higher intersection delays.
2.1.1.2 Queue Jumper Lanes (QJL)
QJLs are intersection-specific treatments that allow buses that operate in mixed-traffic lanes to bypass the queue at a signalized intersection. This treatment is a short right-turn lane or a separate bypass lane implemented at the intersection approach. Two types of queue jumper lanes can be implemented depending on whether or not an extra bus signal phase is provided. In Type 1 QJLs (Figure 2.2), an advanced green phase is provided for the buses to pull ahead of through traffic before the signal phase for the rest of the through vehicles is activated. This type of QJL does not require an auxiliary lane for acceleration downstream, but it may lead to increases of through traffic delay. Type 2 QJLs (Figure 2.3), an auxiliary lane on the far-side of the intersection is available to allow buses to merge with the through traffic downstream of the intersection. In this case, a separate signal phase is not provided. Type 2 QJLs are also called queue bypass lanes.
Figure 2.2: Queue jumper lane - Type 1
Figure 2.3: Queue jumper lane - Type 2
Field Studies
Reductions of 5% to 15% in bus travel time associated with the implementation of QJLs at intersections have been reported (Danaher et al., 2007) in the following case studies:
• Lincoln Street at 13th Avenue in Denver, 7- 10 second reduction in bus inter-section delay;
• NE 45th Street route in Seattle, WA, 27-second, 12-second and 6-second re-duction in bus travel time along the corridor during the morning peak, and afternoon peak periods, and across an entire day respectively.
The City of Portland and the Tri-County Metropolitan Transportation District of Oregon (Tri-Met) conducted the Powell Boulevard Bus priority Pilot Project (Kloos
et al., 1994). The test was designed to evaluate the application of TSP strategies as well as a QJL. The QJL was implemented on the 26th Avenue for the eastbound
(EB) buses. It included an advanced green phase to enable the bus to pull in front of the eastbound through queued traffic (Type 1 QJL). The buses received a short advanced green phase when they were at the bus stop during a normal eastbound through red phase. Results indicated that generally bus travel times decreased by 5% for the inbound morning peak and decreased by 7.8% for the outbound evening peak directions. Total bus person delay decreased by 12.3%, however, total person delay did not change significantly. The method used in the study resulted in higher delays for the through traffic, especially the westbound one.
Simulation Studies
Several studies have investigated the effect of QJLs combined with TSP on transit performance using micro-simulation software packages. Zlatkovic et al. (2013) used a VISSIM micro-simulation model to evaluate individual and combined effects of queue jumper lanes and TSP on traffic performance of a BRT system in West Valley City, Utah. A QJL was modeled along with an exclusive 8 seconds signal phase at intersections (Type 2 QJL). The results of the study showed that the QJL combined with TSP reduced bus travel time by 13%-22% and increased bus speed by 22%. However, the strategy increased average delay for cross-street traffic by 15%. The individual QJL scenario reduced bus travel time by 6%-15% and increased cross-street traffic delay by 8%. The implementation of individual TSP reduced bus travel times by 9%-11% and increased cross-street traffic delay by 8%.
Lahon (2011) studied the effects of QJL combined with TSP using VISSIM. A QJL was modeled along with a special signal phase (type 2 QJL). Results indicated that the QJL with TSP reduced transit travel time by 30%. The author did not
report the impact of the TPTs on cross street traffic performance.
Anallytical Studies
To the extend of the author’s knowledge, there is no study to-date investigating the impact of QJLs on person delays using analytical models.
2.1.1.3 Intermittent Bus Lanes (IBL)
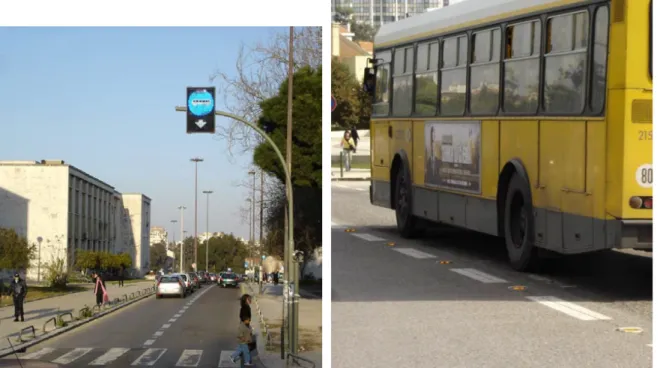
Intermittent bus lanes reduce bus delay by temporarily clearing auto vehicle traffic from a lane for a section under consideration ahead of a bus. When a bus approaches a section where an IBL is implemented, the subject lane becomes a bus lane, and after the bus leaves that section, it becomes a mixed traffic lane again (Viegas and Lu, 2004). An example of IBL implemented in Lisbon, Portugal, is shown in Figure 2.4. The impact of intermittent bus lanes, bus lanes with intermittent priority and other strategies for sharing a lane between cars and buses on traffic operations has also been analyzed through field tests and the development of analytical and simulation models (Eichler and Daganzo, 2006, Viegas and Lu, 2004, Guler and Cassidy, 2012).
Field Studies
Viegas et al. (2007) studied a trial IBL treatment in Lisbon, Portugal (Figure 2.4), for a period of 6 months starting in September 2005. The study showed that the IBL treatment increased bus average speed by 20% with very limited impacts on general traffic operations.
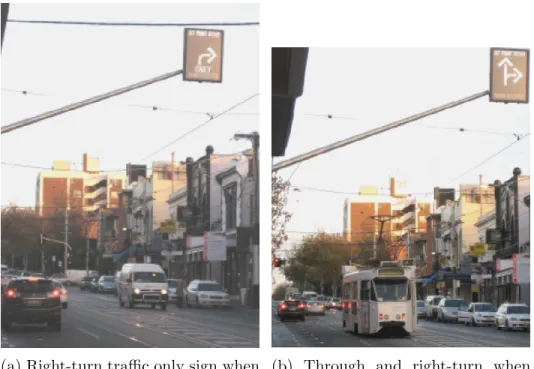
Currie and Lai (2008) reviewed the performance of dynamic fairway (DF), a vari-ation on the IBL concept, implemented in Melbourne, Australia. The system, which was initiated in 2001, is shown in Figures 2.5 and 2.6. When a tram approaches, the pavement lights start flashing and the variable message sign (VMS) changes to right-turn traffic only sign. When the tram passes, the pavement lights turn off and
(a) Vertical signalization- Variable Message Sign
(b) Horizontal signalization- LED’s on the pavement
Figure 2.5: Flashing lights of the intermittent bus lane in Melbourne, Australia (Cur-rie and Lai, 2008)
the VMS reverts to through and right-turn traffic sign. The right turn movements are allowed to use the IBL unless congestion occurs. The results of the study indicated that the IBL increased transit speed between 1% and 10%.
Simulation Studies
Zyryanov and Mironchuk (2012) developed a simulation model to evaluate IBL treat-ment using the AIMSUN micro-simulation software. The study case was Scheboldaev Street, in Rostov-on-Don, Russia. Results indicate that IBL with TSP increases bus speed by 8%-10%.
Analytical Studies
Zhu (2010) proposed a two-lane traffic model with an IBL using the cellular automaton traffic flow model. DBLs strategy, IBLs and ordinary two-lane traffic alternatives were considered and comparisons were made by numerical simulation. The results indicated that the IBL strategy is more efficient in improving the bus flow than the ordinary two-lane traffic alternatives. In the IBL case, bus speed is more than the ordinary two-lane traffic when density is more than 0.2 veh/site.
(a) Right-turn traffic only sign when tram is approaching
(b) Through and right-turn when tram enters
(c) No through or right turn when congestion occurs
(d) Right-turn traffic only when tram is approaching
Figure 2.6: VMS of the intermittent bus lane in Melbourne, Australia (source: Currie and Lai (2008))
2.1.1.4 Bus Lanes with Intermittent Priority (BLIP)
BLIPs are similar to IBLs, but they force vehicles already in the bus lane to leave the lane. In the IBL case, vehicles already in the bus lane are not requested to leave the lane.
Simulation Studies
Carey et al. (2009) studied potential benefits and disadvantages of the BLIP and compared BLIP to other TPTs such as no-build, transit signal priority, and exclusive bus lanes using VISSIM. The study corridor was in Eugene, Oregon. The results indi-cated that bus travel time decreased by 14% and bus reliability improved by 28%. The BLIP alternative also showed minimal impact on overall delay and minimal change to the conflicting movements.
Analytical Studies
Eichler and Daganzo (2006) developed an analytical model using kinematic wave the-ory to study the feasibility, costs and benefits of BLIPs. In particular they developed analytical models to evaluate the auto capacity of BLIP systems, and to estimate the travel time savings of both the auto and bus occupants of an under-saturated BLIP system. The study has shown that BLIPs can reduce bus travel time, and can also reduce random fluctuations in travel and arrival times.
Chiabaut et al. (2012) studied the effects of BLIPs using kinematic wave theory. The study indicated that BLIP activation decreases capacity and increases bus travel time. The authors argue that the lane drop due to BLIP activation, reduces the capacity which negatively affects autos and consequently increases bus travel time.
2.1.2 Time Transit Preferential Treatments
In time priority strategies, signal timings can be set to favor approaches with pub-lic transit. Delay due to traffic signals can potentially decrease if time priority is
given to buses at intersections through Transit Signal Priority (TSP). TSP strategies dynamically adjust signal timings to prioritize the movement of transit vehicles and can be categorized as passive, active, or real-time (i.e., adaptive, traffic-responsive) strategies (Smith et al., 2005). Real-time signal control systems can be very effec-tive in providing priority to transit vehicles while minimizing the impact on the rest of the traffic. TSP strategies often need negligible space for installing the required equipment and control system but might require signal controller upgrades.
Several studies have evaluated the effects of time priority strategies on the perfor-mance of different bus and light rail transit modes (Wahlstedt, 2013, Vlachou et al., 2010). Transit signal priority (TSP) strategies fall into the category of time prefer-ential treatment and can be further classified in passive, active, and real-time.
2.1.2.1 Passive Priority Strategies
Passive priority strategies are developed based on historical data and do not require a transit detection system (Smith et al., 2005). Signal settings such as offsets, splits, and cycle lengths are modified to favor transit vehicles by considering traffic oper-ations and geometric conditions. Passive priority strategies include adjustment of offsets, additional green time for the phases serving transit vehicles, and reduction in cycle length. These strategies can potentially reduce transit travel time with low im-plementation costs. However, the strategies may negatively affect cross-street traffic and allocate excessive green time to priority movements. Examples of such strategies include offset adjustment, longer cycle lengths and etc. Figure 2.7 shows an exam-ple of offset adjustment for TSP using time-space diagrams of vehicle trajectories traveling through two signalized intersections.
(a) Initial signal settings
(b) Adjusted offset
Field Studies
Oliveira-Neto et al. (2009) studied active and passive bus priority strategies in mixed traffic arterials. The study evaluated the operational performance of several scenar-ios with and without priority, during peak and off-peak traffic periods. The 13 de Maio Avenue in Fortaleza, Brazil, was selected as the case study. A field study of the various scenarios indicated that passive priority strategies have low effectiveness either under fixed- or real-time control, on heavy mixed traffic bus corridors. Passive bus priority under fixed-time scenario changed the mean stopped delay in seconds per vehicle and per traffic direction by -3.7% to 9.4% in comparison to the well-adjusted fixed-time scenario.
Simulation Studies
Skabardonis (2000) developed passive priority strategies and determined optimal sig-nal timings by minimizing a weighted combination of delays and stops offline. Weight-ing factors accounted for passenger loads and as a result the system favored the buses. A 6.7 km (4.2 mi) long segment of San Pablo Avenue, in the San Francisco Bay Area, which includes 21 signalized intersections, was selected as the test site for evaluation of the proposed strategies. The study site was modeled in TRANSYT and CORSIM. The optimal signal settings in the passive priority strategy resulted in a 14% decrease in bus delay without significant negative effect on the rest of the traffic.
Oliveira-Neto et al. (2009) tested passive and active signal priority strategies on a 1.5 mile long segment of the 13 de Maio Avenue arterial in Fortaleza, Brazil, that included 10 signalized intersections. The passive TSP strategy was modeled in TRANSYT. The results of the study did not favor the adoption of the passive priority techniques for this specific case study. The authors also tested the SCOOT adaptive control on the same site.
Analytical Studies
There are no models analyticaly evaluating the impact of passive TSP strategies, however, analytical evaluation can be performed with existing models that evaluate delay when fixed-time signal control is in place. In the Highway Capacity Manual (HCM, 2010), the average delay per vehicle for a lane group is given as the sum of the uniform delay, random delay, and initial queue delay. Since vehicles are not detected in real-time to provide passive priority, the method for analytically evaluating MOEs is the same as for fixed-time signals. The MOEs can be calculated simply by replacing the calculated signal phases duration with the ones designed for the passive TSP strategies.
2.1.2.2 Active Priority Strategies
Active priority strategies provide priority to a transit vehicle based on real-time infor-mation of traffic conditions and transit arrivals. These strategies may change regular traffic signal settings in response to detection of a transit vehicle. Active TSP strate-gies use real-time transit vehicle information and consequently are more effective than passive strategies in improving transit performance. In addition they may cause fewer negative effect on cross street traffic operations. However, active TSP strategies may negatively affect signal coordination and require vehicle detection and communication systems, which are often expensive. Different types of active priority strategies are as follows:
• Phase extension (green extension): when a transit vehicle is detected to be approaching an intersection, a phase extension strategy extends the green time for the phase that serves the transit vehicle to provide the right-of-way to the transit vehicle as soon as possible (Figure 2.8).
• Phase advance (red truncation): when the signal is red for an approaching transit vehicle, this strategy may expedite the return to green for the transit
phase by shortening the non-transit green phases and therefore truncating the red for the subject transit phase (Figure 2.8).
• Phase insertion: when a transit vehicle is detected, a special phase may be inserted (Figure 2.9).
• Phase rotation: the order of the signal phases may be rotated to prioritize transit vehicle movement (Figure 2.9).
Field Studies
The City of Portland and the Tri-County Metropolitan Transportation District of Oregon (Tri-Met) conducted the Powell Boulevard Bus priority Pilot Project (Kloos et al., 1994). The test was designed to evaluate the application of phase extension and phase advance TSP strategies. A 2-mile four-intersection segment of SE Powell Boulevard between Milwaukie and 50th Avenues in southeast Portland was selected as the test site. The amount of green extension or early green allowed was up to 10 seconds per cycle during off-peak periods and up to 20 seconds during peak periods. Overall, the TSP strategy decreased delay for bus passengers by more than 12% and decreased bus travel times by 5%-8% during the peak period. However, the change in total intersection person delay was insignificant during the peak periods, although the person delay did increase slightly in the off-peak period. The TSP’s effect on total vehicle delay was insignificant.
In Northern Virginia (Rakha and Ahn, 2006) an 8.06 miles long corridor from Fairfax County Parkway to North King/Shields intersection including 27 signalized intersections was analyzed. A 10-second green extension resulted in 3% to 6% re-duction of the overall bus travel time. During peak periods, intersection bus delays decreased between 9.26% and 23%. Bus delay reduction during off peak hours was 10.17%, while a 13.3% reduction was observed during the entire morning analysis
(a) Initial signal settings
(a) Initial signal settings
(b) Phase insertion/phase rotation
period.
Simulation Studies
Kamdar (2004) used VISSIM to evaluate the impacts of TSP at twenty-six signalized intersections along U.S. 1 corridor in Northern Virginia during the morning peak pe-riod. The MOEs used were transit travel time, bus control delay, and queue length on side streets. The results showed that on the priority approach bus travel time de-creased by 0.8%-4%, bus control delay dede-creased by 5%-16% and total queue length on the side streets increased by about 1.23%.
Analytical Studies
A thorough literature review indicates that very few studies have used analytical models to evaluate TSPs. Jacobson and Sheffi (1981) developed an approximate stochastic analytical model to evaluate the bus priority impact on person delay at a signalized intersection. For simplicity, an isolated intersection with a one-way main street and a one-way cross-street, where the buses operated only on the main street, was considered. Both phase extension and phase advance strategies were applied. Based on the probability density functions and an expression for the mean vehicle delay, impacts of the priority strategies on the total person delay were estimated.
Liu et al. (2008) developed a model to estimate the impact of the phase exten-sion and phase advance priority strategies on vehicle delay at an intersection. In this study it was assumed that TSP implementation does not significantly affect the randomness of the traffic flow arrivals to the intersection; consequently, the random delay was assumed to remain unchanged before and after the implementation of the TSP strategies. Therefore, the impact of TSP was evaluated by assuming determin-istic arrivals and service rates considering a D/D/1 queuing system. Vehicle arrival
and departure rates were assumed to be constant. The analytical model results were compared to the simulation models results obtained using VISSIM.
Abdy and Hellinga (2011) developed an analytical model to evaluate the impacts of phase extension and phase advance priority strategies on vehicle delay. The model is applicable to individual intersections. It was assumed that the intersection can be modeled as a D/D/1 queuing system with constant arrival rates. The results obtained from the analytical model closely matched those obtained from the micro-simulation analysis for volume-to-capacity ratios up to 0.8. VISSIM was used for the micro-simulation modeling analysis.
Overall previous analytical studies did not perform a comprehensive analysis the impact of TPT alternatives on person delay and person discharge flow when im-plemented individually or in combination. Also, previous analytical models did not capture the effect of platooned vehicle arrivals at intersections.
2.1.3 Impacts on Other Traffic
Previous studies have confirmed that TSP implementation will increase the delay for vehicles traveling on conflicting phases. TSP with IBL implementation increased cross-street delay by 17% to 58% (2007). Almost all real-time signal control with TSP studies have considered TSP impacts on other than the priority vehicles in their mathematical formulations. These formulations mainly consider vehicle delays for the conflicting approaches. Although delays for traffic on the conflicting phases will increase, appropriate TSP design may reduce total person-delay of the system.
2.1.4 Near-side Bus Stops Presence
In addition to the implementation of TPTs, the presence of bus stops can play a very important role in traffic and transit performance. The most common type of bus stop is the curbside stop where buses block a travel lane while stopping (Fitzpatrick and Nowlin, 1997). These stops are often located at a short distance from the stop line of
signalized intersections (so called near-side stops) to eliminate the spillback effect that occurs when a bus stops at the far side of the intersection and to provide convenient crosswalk access for passengers (Fitzpatrick et al., 1996). However, buses dwelling at near-side bus stops may block the through and right-turn lane on the intersection approach, reducing intersection capacity and potentially disrupting traffic flow.
Several studies have investigated the impact of bus stops on the performance of signalized intersections. Wong et al. (1998) developed a microscopic simulation model to investigate the delay at a signalized intersection for near-side bus stops based on factors such as the distance between the bus stop and the stop line, car and bus flows, bus dwell time, and signal settings. Furth and San Clemente (Furth and SanClemente, 2006) modeled the influence of bus stop location and roadway grade on bus delay based on vehicle characteristics such as acceleration and bus dwell time. Other studies investigated the effect of bus stops on the capacity of signalized intersections. Zhao et al. (2007) used a two-lane cellular automaton (CA) model to evaluate roadway capacity based on factors such as stop location, signal timing and bus dwell time. Most recently, Gu et al. (2013) investigated the impacts of near-side bus stops on residual queue length and car delays using kinematic wave theory. While several studies have examined the impact of bus stops on vehicle delay and capacity of signalized intersections, there is a gap in determining how the presence of bus stops affects the performance of TPTs with regard to person-based measures of effectiveness (MOEs).
2.2
Bus Travel Time Prediction
Short-term travel time predictions include prediction of travel times after a few seconds to possibly a few hours using current and past traffic information (Vlahogianni et al., 2014). Several applications of intelligent transportation systems (ITS) rely on short-term travel time predictions including advanced traveler information systems
(ATIS) and transit signal priority (TSP) strategies. ATIS provides information to travelers to decide on their destination and reach them quickly and safely (Noonan and Shearer, 1998). Inaccurate transit travel time prediction can increase traveler waiting times at bus stops and therefore, reduce system reliability. When active and real-time TSP strategies are implemented, the system detects the presence of a bus approaching the intersection and places a priority request to the traffic signal controller. By predicting the bus arrival time at the intersection stop line, the signal controller decides whether to provide priority or not and at what time. Since a few seconds of green extension or red truncation are provided (e.g., 5 or 10 seconds), the predicted arrival time at an intersection stop line must be accurate and within a required strict level of tolerance (e.g., within a 5-second error bound). Inaccurate bus arrival predictions can restrict real-time signal control systems with TSP from realizing their full potential in improving car and transit operations (Christofa et al., 2016).
Automated vehicle location (AVL) systems have been widely adopted by transit operators since they allow bus tracking and gathering of vehicle location and time data that can be used for scheduling and management purposes. AVL data sampling can be categorized in distance/location-based, time-based, and event-based sampling (Jenelius and Koutsopoulos, 2012). In location-based sampling, data are polled at fixed locations such as bus stops or intersections while in distance-based sampling data are sampled at specific distances from the previous record. In time-based polling, data are stored at fixed-time intervals (e.g. every 1 second or every 60 seconds) and in the event-based sampling data are polled when specific events occur (e.g., when a stop is requested).
While AVL systems offer an abundance of information to be used for improved transit operations and management, they have a number of limitations. Low reso-lution data sampling often caused by communication constraints, is one of the most
important challenges when using AVL data. In this case the actual bus trajecto-ries are not available and should be inferred from sparse data. Inferring trajectotrajecto-ries can be challenging specially in signalized urban arterials due to heterogeneous traffic conditions.
The literature on travel time prediction models is extensive. Existing models can be broadly categorized into parametric and non-parametric models. Parametric mod-els include an assumption about their functional form and unknown parameters are estimated by fitting the model to the training dataset (James et al., 2013). Func-tional forms are often determined based on certain theories and then, unobserved variables are estimated by various techniques including norm approximation such as least-squares method (Tan et al., 2006), maximum likelihood (Hellinga et al., 2008, Jenelius and Koutsopoulos, 2013) and Bayesian estimation (Hofleitner et al., 2012). Parametric models investigated in previous studies include linear regression (Nikovski et al., 2005, Tan et al., 2006), Kalman filtering (Cathey and Dailey, 2003, Hans et al., 2014, Kumar et al., 2015, Liu et al., 2012), auto regressive integrated moving aver-age (ARIMA) models (Ma et al., 2015), and accelerated failure-time survival models (Gayah et al., 2016).
Non-parametric models have also been used for short-term travel time prediction. Non-parametric models do not make assumptions about the functional form of the model, but they try to estimate a functional form that fits the data points as well as possible (James et al., 2013). Various machine learning techniques have been used with this type of models including support vector regression (SVR) with non-linear kernel (Yu et al., 2011, 2012, Hu et al., 2016) artificial neural network (ANN) (Chien et al., 2002, Jeong and Rilett, 2005, Khosravi et al., 2011, Mazloumi et al., 2011, Jeong and Rilett, 2004, Ma et al., 2015), k-nearest neighbors (KNN) (Myung et al., 2011, Baptista et al., 2012, Tak et al., 2014), additive model (Kormaksson et al., 2014), Gaussian process regression (Id´e and Kato, 2009), and ensembles (van
Hinsbergen et al., 2009, Zhang and Haghani, 2015). Non-parametric models are powerful tools in predicting bus travel times to specific locations when AVL records are available at those locations; however, these models might result in inaccurate travel time predictions of locations where AVL records are not available to train the model. That is because for such locations in-between records, assumptions need to be made to estimate arrival times (e.g., travel time is a linear function of traveled distance). Parametric models can be used to decompose travel time into its components and provide estimates for each component. As a result, parametric models provide a more powerful tool for inferring vehicle trajectories between two specific locations for which AVL records are not available.
The vast majority of previous studies have investigated bus travel time between fixed locations (e.g., bus stops) with the use of both parametric and non-parametric models (Jeong and Rilett, 2004, Chen et al., 2005, Lin et al., 2013, Hernandez, 2014). In the absence of data for a specific location, interpolation is performed to infer travel time to that point (Sinn et al., 2012). Interpolation is reasonable for relatively high-resolution data polling; however, reduction in the sampling frequency can significantly reduce prediction accuracy and precision.
Since the main factors affecting bus travel time uncertainty are dwell times at bus stops and intersection delays, improvements in the dwell time and intersection delay estimates can enhance prediction accuracy (Baptista et al., 2012). While most studies consider bus dwell times in estimating bus arrival time, few studies have taken into account the intersection delay component. For instance, Bie et al. (Bie et al., 2011) developed analytical models to estimate bus arrival time at the intersection stop line, which can be used to estimate bus delay at the intersection. Bus stops were not taken into account and the model required detailed data on speed and signal settings. Average intersection delay has been estimated in previous studies (Tan et al., 2006, Gibson et al., 2015, Farid et al., 2016); however, expected intersection
delay values over all buses in the training data set were estimated instead of individual bus intersection delay. Modeling intersection delay by an average value can reduce accuracy of the models in predicting bus travel time sufficiently accurately for use in TSP systems.
2.3
Real-time Signal Control Systems with Transit Priority
Real-time signal control systems with transit priority are responsive to transit re-quests as well as the current traffic conditions in real-time. Real-time signal control systems with TSP provide priority while optimizing given traffic performance criteria such as vehicle delay, person delay, and transit delay. In general, real-time signal control systems with TSP require traffic detection (both transit and non-transit vehi-cles) and communication systems, estimation of appropriate performance measures, estimation of traffic demand and bus arrival time to stopline, and a decision system as shown in Figure 2.10.
Figure 2.10: Simplified real-time signal control architecture
Vehicle detection can be performed at the local level or at the network level. At the local level, vehicles may be detected approaching an intersection through the use of various sensing technologies (e.g. inductive loops, active infrared sensors, etc.) that do not look beyond a certain distance from the intersection (a few hundred feet).
De-tection at the network level is accomplished through automatic vehicle location (AVL) system, where vehicles communicate their position to a centralized transit or traffic management center through the use of Global Positioning System (GPS) or other automated vehicle location technologies. The communication system is responsible for linking the detection system to the traffic signal control system.
Macroscopic, mesoscopic, or microscopic models are used to estimate the current state of traffic conditions based on raw data obtained from the detectors. Vehicle arrival times at intersections are estimated as well. Finally, optimal values for the decision variables (green phases, and cycle times) are calculated by optimizing selected performance measure(s) such as total vehicle delay.
Real-time traffic signal control systems that have incorporated TSP are as follows:
• SCOOT
Split Cycle Offset Optimization Technique (SCOOT) was originally developed in England (Hunt et al., 1982). SCOOT is a centralized traffic signal control system which works both on arterials and grid networks and automatically responds to variations in traffic demand. The performance of SCOOT relies on traffic flow data obtained from detectors. The system needs a large number of detectors which should be located at pre-determined upstream locations on every link (usually at the upstream end of the link). Downstream detectors are used to determine left turning movements and optimize left turning phase. The SCOOT algorithm estimates vehicle delays and number of stops on each link and determines the system’s performance index (PI). The PI is typically the sum of the average delay and the number of stops at all approaches in the network. SCOOT incrementally adjusts signal control parameters such as phase durations, cycle lengths, and offsets of pre-timed signal plans based on the actual traffic flow fluctuations (Bretherton et al., 2002). The Split optimizer
equalizes saturation and congestion, offset optimizer minimizes delay, number of stops and congestion, and cycle optimizer minimizes delay.
Transit signal priority is provided through phase extension or phase advance. In SCOOT 4.4, different priority levels between 0 and 6 can be provided for buses based on some mechanisms outside SCOOT. When an AVL system is present, the priority level can be determined based on the bus headway or timetable (Bretherton et al., 2002).
In London, SCOOT operation began in early 1984. An assessment of bus pri-ority field trials in the areas of Camden Town and Edgware Road in London in 1996 showed that SCOOT reduced bus delay by 1% to 71% depending on the selected strategy (e.g. central extensions, local extensions, etc.) and saturation ratio (SCOOT, 2015).
• SCATS
The Sydney Coordinated Adaptive Traffic System (SCATS) was developed by the Roads and Traffic Authority of New South Wales, Australia (Sims and Dobinson, 1980). SCATS adjusts phase duration and offsets in response to variations in traffic flow and system capacity, using some predefined plans. For each intersection, SCATS distributes its computations between the field con-troller and a regional computer at the operations center. The computer makes incremental adjustments to traffic signal timings based on minute by minute changes in traffic flow at each intersection. SCATS divides the network into smaller sub-networks and designs signal settings for each of them independently. Data is obtained by detectors which are located at the intersection stop lines. SCATS has three control levels: central, regional, and local. The central com-puter is responsible for communications and the database function while the
regional computer and local traffic controllers handle the strategic and tactical controls respectively.
In the strategic control, the algorithm selects suitable signal timings on a cycle by cycle basis for the target area and sub-areas based on average prevailing traffic conditions. The algorithm uses car equivalent flow, degree of saturation and signal phase timings information. The tactical control, may modify the plan provided by the strategic control taking into account the demand.
Slavin et al. (2013) conducted a before and after study of SCATS implemen-tation with TSP along Powell Boulevard, Portland, Oregon. The study reports both negative and positive effects of the SCATS implementation on travel speed. Four tests were conducted at two intersections for both east and west bound approaches. One of the tests indicated a 22% increase in general traffic travel speed, however, on the other three tests, general traffic travel speed was reduced by 7% to 21%. During peak periods, transit travel time in the eastbound direc-tion was improved, however, in the westbound direcdirec-tion transit travel time did not improve.
• RHODES
The Real-Time, Hierarchical, Optimized, Distributed, and Effective System for traffic control (RHODES) was developed at the University of Arizona (Mirchan-dani and Head, 2001). Using a dynamic programming approach, this system finds the optimum signal phasing and timing for an intersection while taking into account delay, number of stops, and queue lengths. RHODES was de-veloped to estimate arrival of vehicles on all approaches and optimize phase durations based on the user-defined objectives, such as minimizing average de-lay or number of stops.
The intersection control strategy of RHODES treats each vehicle alike by as-signing an identical weight to it. To predict future arrivals at the intersection, RHODES uses data obtained from detectors on the approach of each upstream intersection, and takes into account the traffic state and signal phase timings of the upstream signals.
RHODES control was studied in a field-test in the City of Tempe, Arizona (Mir-chandani and Lucas, 2001). The results indicated that RHODES performed as well as Tempe´s existing finely-tuned semi-actuated coordinated control system. In this study, TSP strategies were not implemented, however, it has been men-tioned that RHODES can be expanded to include TSP as shown in Figure 2.11.
Figure 2.11: TSP implementation in RHODES (source: Mirchandani and Lucas (2001))
In RHODES each detected vehicle is treated equally and consequently buses can not get priority over other vehicles. Mirchandani and Lucas (2004) presented Categorized Arrivals-based Phase Reoptimization at Intersections (CAPRI) which integrated TSP and rail/emergency preemption with RHODES. In
RHODES-CAPRI TSP is provided either by giving each bus a variable weight which depends on how late the bus is and on the bus passenger occupancy, or by providing a constraint to set signal phase to a desirable phase at a specified or scheduled time. A simulation test using CORSIM along an arterial was con-ducted and the RHODES control was implemented at a single intersection. In comparison to standard semi-actuated control (SAC), for low cross-street vol-umes (550 vehicles per hour per direction), RHODES without TSP reduced bus delay and cross-street delay by 0.23% and 43.69% respectively. RHODES with TSP (RHODES-BP) decreased bus delay and cross-street traffic delays by 0.66% and 39.77% respectively. For high cross-street volumes (1100 vehicles per hour per direction), RHODES-BP reduced bus delay by 4.46% and increased cross-street traffic delay by 4.8%.
• UTOPIA
The Urban Traffic Optimization by Integrated Automation system (UTOPIA) is an adaptive signal control system that was first developed and implemented in Italy in 1985. The objective of the system was to integrate real-time traffic control with transit priority needs. The controllers determine the signal con-trol settings based on local traffic demands, transit priority, and coordination requirements (Shepherd, 1992).
UTOPIA can provide absolute, weighted, and selective priority to buses and trams at signalized intersections and also can be extended to emergency and very important person (VIP) vehicles. UTOPIA needs detectors only on the intersection approaches with significant traffic volumes and where traffic fluc-tuates significantly. UTOPIA was first implemented in a large area in Turin, Italy (Donati et al., 1984). Field results indicated that both private and public vehicles’ travel times reduced on the order by about 9%-15%.