Technological University Dublin Technological University Dublin
ARROW@TU Dublin
ARROW@TU Dublin
Dissertations School of Computing
2015-03-10
Can Passive Mobile Application Traffic be Identified using
Can Passive Mobile Application Traffic be Identified using
Machine Learning Techniques
Machine Learning Techniques
Peter HollandTechnological University Dublin
Follow this and additional works at: https://arrow.tudublin.ie/scschcomdis
Part of the Computer Engineering Commons
Recommended Citation Recommended Citation
Holland, P. (2015) Can passive mobile application traffic be identified using machine learning techniques, Masters Dissertation, Technological University Dublin.
This Theses, Masters is brought to you for free and open access by the School of Computing at ARROW@TU Dublin. It has been accepted for inclusion in Dissertations by an authorized administrator of ARROW@TU Dublin. For more information, please contact
Can passive mobile application traffic be
identified using machine learning
techniques?
Peter Holland
D99991048
A dissertation submitted in partial fulfilment of the requirements of
Dublin Institute of Technology for the degree of
M.Sc. in Computing (Data Analytics)
I certify that this dissertation which I now submit for examination for the award of MSc in Computing (Knowledge Management), is entirely my own work and has not been taken from the work of others save and to the extent that such work has been cited and acknowledged within the test of my work.
This dissertation was prepared according to the regulations for postgraduate study of the Dublin Institute of Technology and has not been submitted in whole or part for an award in any other Institute or University.
The work reported on in this dissertation conforms to the principles and requirements of the Institute’s guidelines for ethics in research.
Signed: _________________________________
ABSTRACT
Mobile phone applications (apps) can generate background traffic when the end-user is not actively using the app. If this background traffic could be accurately identified, network operators could de-prioritise this traffic and free up network bandwidth for priority network traffic. The background app traffic should have IP packet features that could be utilised by a machine learning algorithm to identify app-generated (passive) traffic as opposed to user-generated (active) traffic.
Previous research in the area of IP traffic classification focused on classifying high level network traffic types originating on a PC device. This research was concerned with classifying low level app traffic originating on mobile phone device.
An innovative experiment setup was designed in order to answer the research question. A mobile phone running Android OS was configured to capture app network data. Three specific data trace procedures where then designed to comprehensively capture sample active and passive app traffic data. Feature generation in previous research recommend computing new features based on IP packet data. This research proposes a different approach. Feature generation was enabled by exposing inherent IP packet attributes as opposed to computing new features. Specific evaluation metrics were also designed in order to quantify the accuracy of the machine learning models at classifying active and passive app traffic.
Three decision tree models were implemented; C5.0, C&R tree and CHAID tree. Each model was built using a standard implementation and with boosting. The findings indicate that passive app network traffic can be classified with an accuracy up to 84.8% using a CHAID decision tree algorithm with model boosting enabled. The finding also suggested that features derived from the inherent IP packet attributes, such as time frame delta and bytes in flight, had significant predictive value.
Key words: Internet Traffic classification, IP Traffic Classification, Internet Traffic Categorisation, Internet protocol, Machine Learning.
ACKNOWLEDGEMENTS
I would like to thank my dissertation supervisor, Luca Longo, for his expert advice throughout the dissertation process. I would also like to thank the members of the IBM Now Factory team that helped me to define the research proposal and patiently answered numerous questions throughout the last 4 months.
TABLE OF CONTENTS
ABSTRACT ... 3 ACKNOWLEDGEMENTS ... 4 TABLE OF CONTENTS ... 5 TABLE OF FIGURES ... 8 1 INTRODUCTION ... 101.1 OVERVIEW OF PROJECT AREA ... 10
1.2 BACKGROUND ... 11
1.2.1 Limitations of Current Approaches ... 12
1.2.2 Research Gap in Current Knowledge Base ... 12
1.3 RESEARCH PROJECT ... 13
1.4 RESEARCH OBJECTIVES ... 14
1.5 RESEARCH METHODOLOGY ... 14
1.6 SCOPE AND LIMITATIONS ... 15
1.7 DOCUMENT OUTLINE ... 16
2 LITERATURE REVIEW ... 17
2.1 INTRODUCTION ... 17
2.1.1 Evolution of Approaches for IP Traffic Classification ... 17
2.1.2 Port Number Based Analysis ... 17
2.1.3 IP Packet Payload Based Analysis ... 18
2.1.4 Full TCP Flow Based Analysis ... 18
2.1.5 IP Packet Based Analysis ... 19
2.1.6 History of Machine Learning in IP Traffic Classification ... 19
2.1.7 Feature Selection ... 20
2.1.8 Feature Subset Search Techniques ... 21
2.1.9 Feature Reduction Algorithms ... 22
2.1.10 Evaluation Metrics... 22
2.2 TRAFFIC CLASSIFICATION PAPERS... 23
2.4 FEATURE SELECTION PAPER ... 27 2.5 DISCUSSION ... 28 2.6 CONCLUSION ... 28 3 DESIGN METHODOLOGY ... 29 3.1 INTRODUCTION ... 29 3.2 SOLUTION APPROACH ... 29
3.2.1 Step 1 - Data Capture ... 31
3.2.2 Step 2 - Feature Generation ... 34
3.2.3 Step 3 – Machine Learning Modelling ... 37
3.2.4 Step 4 - Model Evaluation ... 40
3.3 EXPECTED RESULTS ... 41
3.4 CONCLUSION ... 41
4 EXPERIMENT IMPLEMENTATION ... 42
4.1 INTRODUCTION ... 42
4.2 SOLUTION APPROACH ... 42
4.2.1 Step 1 - Data Capture ... 42
4.2.2 Step 2 - Feature Generation ... 45
4.2.3 Step 3 - Machine Learning Modelling ... 51
4.2.4 Step 4 - Model Evaluation ... 58
4.3 STRENGTH AND LIMITATIONS OF EXPERIMENT APPROACH ... 59
4.4 EXPECTED RESULTS ... 60
4.5 CONCLUSION ... 60
5 EVALUATION AND DISCUSSION ... 61
5.1 INTRODUCTION ... 61
5.1.1 Evaluation Criteria ... 61
5.1.2 Machine Learning Models Considered ... 63
5.2 EVALUATION OF RESULTS ... 63
5.2.1 Evaluation Criteria Results and Comparison ... 64
5.2.2 Round 1 – Standard Model Implementation ... 64
5.2.3 Round 2 – Boosting Model Implementation ... 67
5.2.4 Real Time Evaluation Criteria ... 72
5.4 STRENGTHS AND LIMITATION OF RESULTS ... 73
5.5 CONCLUSION ... 74
6 CONCLUSION ... 76
6.1 INTRODUCTION ... 76
6.2 PROBLEM DEFINITION &RESEARCH OVERVIEW ... 76
6.2.1 The Research Problem ... 77
6.2.2 The Research Gap... 77
6.2.3 The Research Question ... 78
6.2.4 Summary of the Experiment Design ... 78
6.2.5 Summary of the Experiment Implementation ... 78
6.2.6 Summary of Findings and Conclusions ... 79
6.3 CONTRIBUTIONS TO THE BODY OF KNOWLEDGE ... 80
6.4 EXPERIMENTATION,EVALUATION AND LIMITATION ... 81
6.5 FUTURE WORK &RESEARCH ... 82
6.6 CONCLUSION ... 83
BIBLIOGRAPHY ... 84
APPENDIX A – LITERATURE REVIEW SUMMARY TABLE ... 86
APPENDIX B – DATA DICTIONARY ... 87
APPENDIX C - SPSS STREAM ... 90
APPENDIX D – C5.0 TREE MODEL SETUP ... 91
APPENDIX E – C&R TREE MODEL SETUP ... 95
APPENDIX F – CHAID TREE MODEL SETUP ... 99
TABLE OF FIGURES
FIGURE 3-1:EXPERIMENT PROCESS DIAGRAM ... 30
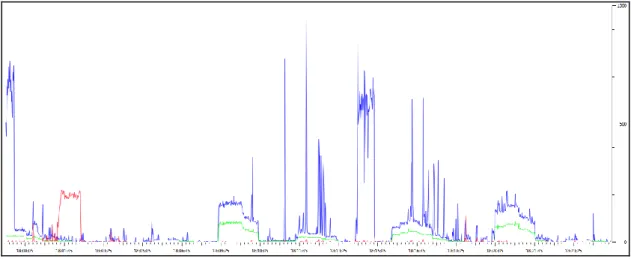
FIGURE 4-1:IOGRAPH 1-ACTIVE DATA TRACE (SCALE 0-1000) ... 48
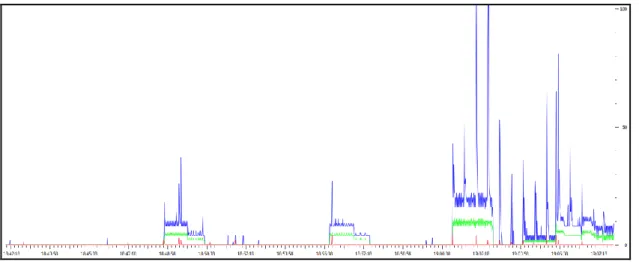
FIGURE 4-2:IOGRAPH 2-PASSIVE DATA TRACE 1(SCALE 0-1000) ... 48
FIGURE 4-3:IOGRAPH 3-PASSIVE DATA TRACE 1(SCALE 0-100) ... 49
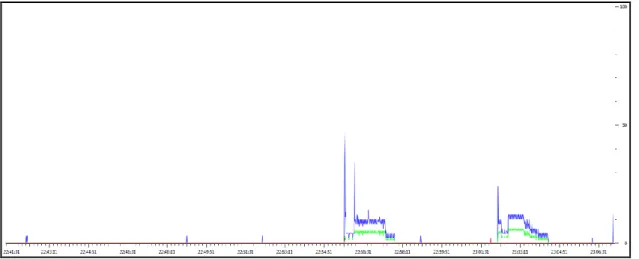
FIGURE 4-4:IOGRAPH 4-PASSIVE DATA TRACE 2(SCALE 0-1000) ... 49
FIGURE 4-5:IOGRAPH 5-PASSIVE DATA TRACE 2(SCALE 0-100) ... 50
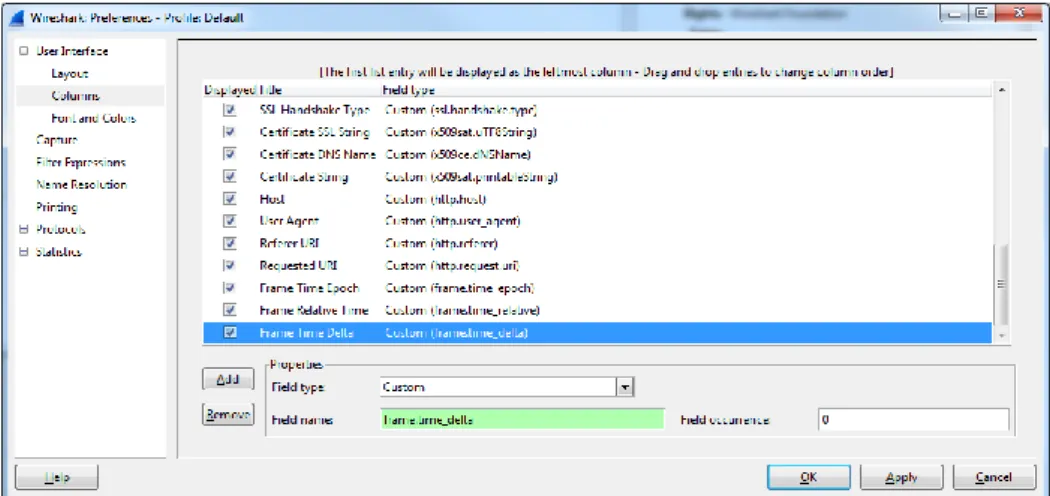
FIGURE 4-6:WIRESHARK PREFERENCE MENU ... 51
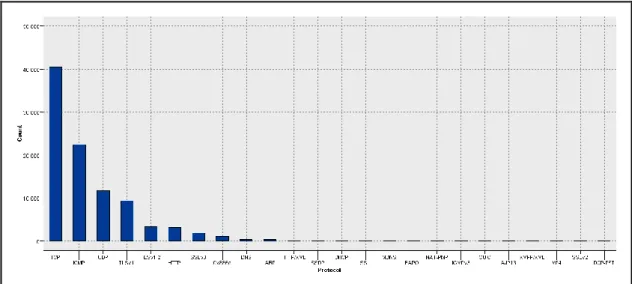
FIGURE 4-7:BAR CHART OF TOTAL PACKETS BY PROTOCOL ... 52
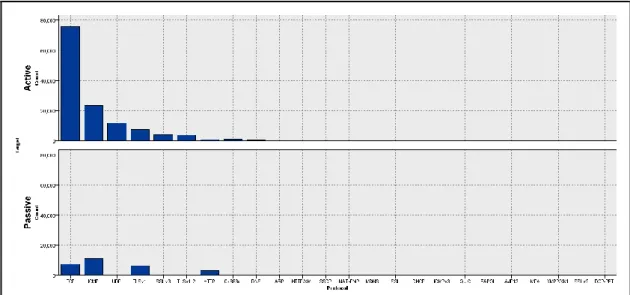
FIGURE 4-8:ACTIVE VERSUS PASSIVE -BAR CHART OF TOTAL PACKETS BY PROTOCOL ... 53
FIGURE 4-9:BAR CHART OF TOTAL PACKETS BY DESTINATION IPADDRESS ... 54
FIGURE 4-10:DISTRIBUTION OF THE TIME FRAME DELTA FEATURE VALUES ... 55
FIGURE 4-11:DISTRIBUTION OF THE BYTES TOTAL FEATURE VALUES ... 55
FIGURE 5-1:FEATURE PREDICTOR IMPORTANCE ... 65
FIGURE 5-2C&RTREE MODEL WITH BOOSTING –ACCURACY COMPARISON ... 68
FIGURE 5-3:C&RTREE FEATURES AND FREQUENCY ... 69
FIGURE 5-4:CHAIDMODEL WITH BOOSTING –ACCURACY COMPARISON ... 70
FIGURE 5-5:C&RTREE FEATURES AND FREQUENCY ... 71
FIGURE 6-1:RESEARCH PROCESS STEPS -SUMMARY DIAGRAM ... 76
FIGURE 6-2:CHAIDTREE GAIN CHART ... 103
FIGURE 6-3:C&RTREE GAIN CHART... 103
TABLE OF TABLES
TABLE 3-1:MACHINE LEARNING TECHNIQUES IN SCOPE ... 40
TABLE 4-1:DATA TRACES RECORD SUMMARY ... 46
TABLE 4-2:NETWORK FLOW RECONSTRUCTION ANALYSIS ... 46
TABLE 4-3:END POINT IP ADDRESS ANALYSIS ... 47
TABLE 4-4:BREAKDOWN OF TOP 10PROTOCOLS ... 53
TABLE 5-1:CONFUSION MATRIX EXAMPLE ... 62
TABLE 5-2:EVALUATION CRITERIA CALCULATIONS ... 62
TABLE 5-3:PASSIVE AND ACTIVE PREDICTIVE PRECISION METRICS ... 62
TABLE 5-4:REAL TIME EVALUATION CRITERIA ... 63
TABLE 5-6:RESULTS -EVALUATION METRICS ... 64
TABLE 5-7:ROUND 1–OVERALL MODEL ACCURACY ... 66
1
INTRODUCTION
1.1 Over vi ew of Pr oject Area
Mobile phone applications (apps) can generate background traffic when the end-user is not using the application. Even if an app has not been opened by the end-user, the app could still generate traffic on the network. This background network traffic should have Internet Protocol (IP) packet statistical features that will make it identifiable as app-generated as opposed to user-generated traffic.
The main reasons mobile apps create passive network traffic is to have content ready for the end-user when the app is opened, such as syncing emails or loading profile feeds from social network apps. “Pre-caching” is a well-established technique where mobile apps and web browser software uses machine learning techniques to guess what content an end-user will click on next and pre-cache the content (Klein and Chung, 2006). Pre-caching is implemented to improve the user experience.
By examine IP packets captured from a mobile device, it should be possible to derive distinct statistical packet features that can be used as input to a machine learning model. The machine learning model could then be used to correctly identify active versus passive traffic.
It is important for network operators to know what type of traffic is flowing through their network. IP traffic categorisation underpins a number of important network management tasks, such as: 1) Understanding the traffic load on the network 2) Automated intrusion detection such as Denial of Service (Dos) attack 3) Reallocation of network resources such as traffic shaping 4) Quality of Service (QoS) management. Prioritising traffic for high value customers or for particular services 6) Identify customer use of the network resource that in some way contravenes the operators terms of service 7) Legal obligation for lawful interception of IP traffic for persons of interest to law enforcement agencies 8) Evolution of the type of traffic on a network is important for long term capacity planning on the network
1.2 Backgroun d
Early research in IP traffic classification focused on port number based approaches. In port number based packet inspection, port numbers are captured from the IP packet headers. A packet is classified based on a lookup of the port number against IANA reserved ports. The classification accuracy for port-based approaches is reported to be between 50% and 70%.
Researchers then proposed analysis of IP packet payloads. This technique involves inspecting the payload of each IP packet for features that can be used to classify the traffic.
Some research suggests using features derived from the full TCP flows. TCP is a connection-orientated protocol. The TCP protocol sets up a connection between source and destination points. All packets with the same source address/port and destination address/port within a time period, or until the connection is terminated, are considered as one flow. The approach must wait until a flow completes or times-out before generating features about the statistical characteristics of the flow and packets in the flow. Examples of flow features include; average flow duration and average packet size per flow.
A number of papers have investigated IP traffic classification based on packet header statistical features. The majority of packet based analysis take the position that any practical IP traffic classification system must be capable of running in real-time on a live network. To achieve real-time traffic classification a Machine Learning (ML) system must be lean, for example, the system must meet the following requirements; use a small feature set, have a fast model training time, have a fast classification time, low memory requirements and low processing requirements.
The idea of using ML techniques for IP traffic classification was first introduced in the context of intrusion detection. A machine learning algorithm automatically builds a classifier by learning the inherent structure of a dataset based on the characteristic features. ML techniques for real-time and offline analysis have demonstrated high classification accuracy of up to 99% for a various types of Internet applications traffic.
1.2.1 Li mi tations of Cu rrent App roach es
There are a number of limitations with the extent of the current body of knowledge in network traffic categorisation.
The research has primarily focused on personal computer based traffic. There is only a small body of knowledge, starting in the last 2 years, concerning mobile generating traffic.
Previous network traffic categorisation research is concerned with identifying types of network traffic at a very high level. For example, TCP, FTP, Telnet, Web. These traffic types are too broad. There is a lack of research on specific traffic from individual services such as Google maps or Apple iTunes. Specific service information is more valuable to network operators.
Previous research has also focussed on payload based inspection. However, payload inspection is not practical due to large processing overheads of inspecting all the data in each IP packet. Also, the increasing amount of encrypted traffic make this task impossible. Data protection laws may also be a barrier to this type of analysis due to the potentially sensitive personal information contained in payload data.
Finally, existing research does not appear to utilise the massive amount of IP packet features available. IP packets have over 100,000 inherent features available that can be exposed using IP packet analysis software. Some of these features may not be distinctive or may be unpopulated. However, IP packet features require no processing to generate and may be very valuable to a machine learning algorithm.
1.2.2 Research Gap in Cu rren t Kn owledge B ase
Based on a review of the body of knowledge on network traffic categorisation, a number of research gaps have been identified:
To the best of this author’s knowledge, there is no research into classifying user generated (active) versus app generated (passive) traffic.
The vast majority of research is based on a fixed network IP traffic generated by personal computers.
This research is based on mobile device originating network traffic which is an important area of research
Previous research does not take advantage of the large amount of inherent IP packet features. Instead, previous research had added extra steps, complexity and processing calculating new features.
This project will leverage the large amount of inherent IP packets features to allow a machine learning algorithm to successful identify user generated or app generated traffic
1.3 Res ear ch Proj ect
This project will conduct empirical research on network traffic categorisation based on mobile phone app data. Specifically, this project will build a supervised machine learning model to distinguish app traffic that is generated by an end-user actively using a mobile phone application, as opposed to traffic that is generated by the application in the background without any end-user initiation.
By examine IP packets captured from an Android device, this project will derive important statistical packet features and then build a classification model to identify user-generated versus app-generated traffic. Because of the very high number of features that can be generated, feature selection and reduction will be important parts of this research.
Being able to distinguish user-generated, also known as active traffic, versus the app-generated traffic, also known as passive traffic, would have two valuable uses for mobile phone network operators:
1. Network operators could optimise their networks and improve the customer experience by prioritising known user-generated traffic. Conversely, the app-generate or background traffic could be deprioritised because the end-user is unaware of this traffic and has no experience of it.
2. Network operators need to be able to accurately count the number of active users of an app. Many apps come pre-loaded on mobile devices and can
generate background traffic. Without knowing how to identify this traffic a network operator may significantly over count the number of active app users.
Based on the gaps identified in the current body of knowledge on network traffic categorisation, the research question is stated as follows:
“Can passive mobile app traffic be identified using machine learning techniques?”
1.4 Res ear ch Obj ecti ves
Guided by the research question, the project objectives are:
1. Gain knowledge in the research domain of network traffic classification 2. Design research question experiment solution
3. Implement the experiment solution and capture results 4. Evaluate outcomes from experiment implementation
1.5 Res ear ch Meth odology
This research will use quantitative research methods based on the numerical analysis of network traffic data collected from a mobile phone. The data will be based on network data traces. The first data trace will collect non-user generated traffic. The second data trace will collect user generated traffic. The quantitative research designs will be descriptive and will aim to establish the associations between variables.
This research will be based on empirical research methods. Empirical data will be produced by experiment and conclusions will be based on evaluation of the experimental data.
The project research methodologies to achieve the project objections are: 1. Complete a literature review of knowledge base
2. Methodical experiment design that is practical and implementable 3. Quantitative research methodology
a. Capture IP data from mobile phone b. Generate features
c. Select and reduce features
4. Critical analysis of results
a. Evaluate accuracy of built models
b. Critically analyse results and report conclusion and future work
1.6 Scope and Lim itations
This project will have the following scope limitations:
An Android OS device is used, specifically a HTC One S running Android 4.1.1. An Android OS device was chosen because special software needs to be installed on the mobile device to capture network traffic. It is much easier to install this software on an Android device compart to and Apple device running IOS.
A limited number of mobile apps are considered. 11 specific apps were chosen. This limitation was introduced for two reasons. Firstly, the 11 apps chosen are the most commonly downloaded and used apps in the world. Hench using these apps will cover most traffic scene on a network. The second reason for limitation the number of apps considered is to control the scope of the research.
Each data trace will cover a 30 minute period. This is to manage the size of the test data. Packet capture (pcap) files can be very large, for example, the 30 minute data traces are expected to create approximately 200,000 records.
This project will not cover any IP packet payload inspection. This project will look to find distinctive packet features rather than directly inspect payload inspection. Also, payload inspection is complex and in the case of encrypted content, it is not possible to inspect packet payloads.
This project will not reconstruct of end-to-end TCP flows. This project will look at low level packet detail not higher level flow detail.
Real time processing is not in scope because testing a real time deployment would be technically very difficult. However, real-time classification will be considerations will
be important evaluation metrics. Such as performance in terms of the trade-off between the model accuracy and processing overhead.
1.7 Docum ent Out line
The remainder of this document is organised as follows:
Chapter 2 reviews the literature relating to network traffic categorisation. The evolution of network traffic categorisation research is outlined. The limitations in the research area are identified and discussed. Other important considerations are also discussed such as the important network issues that relate to this paper.
Chapter 3 outlines the experiment design. This chapter outlines the step by step experiment process from running data traces on a mobile device, exposing packet features, the ML techniques to be used and finally, the evaluation criteria for the ML model.
Chapter 4 documents how the experiment design was implemented. Details of the data trace process is clearly presented. Analysis of the data packets and feature generation are also presented. Details of the ML modelling training set up are also discussed.
Chapter 5 reports on the findings from the empirical study, as implemented in Chapter 4. The machine learning models are evaluated against the evaluation criteria. Weaknesses and limitations are also discussed.
Chapter 6 will providing a clear summary of thesis and contribution to the body of knowledge. Future work and recommendations are presented to highlight how the project can be clearly extended and enhanced
2
LITERATURE REVIEW
2.1 Introdu cti on
This chapter surveys and reviews the literature relating to the network traffic classification. A history of different approaches to the problem is presented. Different classification techniques are discussed and assessed. Finally, performance measures and evaluation criteria used in network traffic classification research are grouped and explored.
2.1.1 Evolution of App roach es for I P T raffi c Classification
This section will highlight the important evolution of the approaches to IP traffic classification, including the recommended best-in-class techniques based on current knowledge.
2.1.2 Port Nu mber B as ed Anal ysis
Early research in IP traffic classification focused on port number based approaches. In port number based packet inspection, port numbers are captured from the IP packet headers. IANA (Internet Assigned Numbers Authority) recommend reserve specific port numbers for specific application e.g. port number 80 is reserved for web based applications. A packet is classified based on a lookup of the port number against IANA reserved ports. The classification accuracy for port-based approaches is reported to be between 50% and 70% (Moore and Papagiannaki, 2005). Port number based classification has a number of limitations:
Port based method are deceive by a simple change of ports used by an application.
A server port can serve multiple services. For example, a VoIP application, a chat messaging system and a web page browsing request could use the same port (Li and Moore, 2007).
Emerging applications often avoid the use of standard ports (Moore and Papagiannaki, 2005)
Web applications such as passive FTP or video/voice communication can use dynamic ports unknowable in advance (Zander et al., 2005).
The proportion of network traffic that is encrypted is increasing. The port numbers may not be visible.
2.1.3 I P Pack et Payl oad Based Analysi s
Some research then proposed analysis of IP packet payloads (Moore and Papagiannaki, 2005). This technique involves inspecting the payload of each IP packet for features that can be used to classify the traffic. However, there are also major limitations with this approach;
Payload analysis tools cannot classify encrypted packets (Bernaille et al., 2006)
Payload-based schemes have large processing overheads and are very time-consuming as the process involves inspecting all the data in each IP packet.
Due to the time-consuming nature of full packet payload inspection it cannot realistically be considered for real-time in high-speed links
There are legal and privacy concerns when inspecting packets
2.1.4 Ful l T CP Flow Based Anal ysis
Some research suggests using features derived from the full TCP flows (Erman et al., 2006; Williams et al., 2006; Zander et al., 2005; Zuev and Moore, 2005). TCP is a connection-orientated protocol. The TCP protocol sets up a connection between source and destination points. TCP provides reliable, ordered and error-checked delivery of a stream of packets. All packets with the same source address/port and destination address/port within a time period, or until the connection is terminated, are considered as one flow. The approach must wait until a flow completes or times-out before generating features about the statistical characteristics of the flow and packets in the flow. Examples of flow features include; average flow duration and average packet size per flow.
The flow based analysis approach is useful for offline analysis but could never be utilised in a real network due to the below limitations;
TCP flows can have variable time duration. IP Traffic is generally made of a large majority of flows with a short time period and a small number of flows with a very long time period (Bernaille et al., 2006). A flow must complete before it can be analysed. This can take a number of minutes.
Flow based analysis has large processing and memory requirements in order to reconstruct flows
Approaches relaying on summarise flow information are sensitive to simple alterations of packet size and inter-arrival times using evasion techniques
2.1.5 I P Pack et B ased An alysis
A number of papers have investigated IP traffic classification based on packet header statistical features (Auld et al., 2007; Bernaille et al., 2006; Kim et al., 2008; Li and Moore, 2007; Singh et al., 2013).
The majority of packet based analysis take the position that any practical IP traffic classification system must be capable of running in real-time on a live network. To achieve real-time traffic classification the ML system must be lean, for example, the system must meet the following requirements; use a small feature set, have a fast model training time, have a fast classification time, low memory requirements and low processing requirements. Singh et al. (2013) investigated near-real time classification techniques. Bernaille et al. (2006) developed a classifier that only considers the first five packets of each flow. Karagiannis et al. (2005) proposed a novel method for IP traffic classification. The authors developed a model that operates “in the dark”, by this they mean the classification model has no access to packet payload, no knowledge of port numbers and no additional information other than the packets captured.
Using the statistical features of packets to generate candidate features for a ML model is the current best practice approach for building ML IP traffic classifiers. The ML algorithm should be able to classify the IP network traffic using the minimum number of features possible. This is due to the constraints of practical real-time IP traffic classification.
2.1.6 History of Machin e Learning in I P T raf fic Cl assifi cation
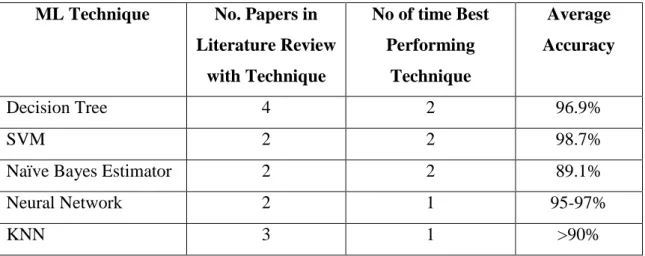
The idea of using ML techniques for IP traffic classification was first introduced in the context of intrusion detection (Frank, 1994). A machine learning algorithm automatically builds a classifier by learning the inherent structure of a dataset based on the characteristic features. ML techniques for real-time and offline analysis have demonstrated high classification accuracy of up to 99% for a various types of Internet applications traffic (Nguyen and Armitage, 2008). Refer to Appendix 1 for a full summary of the classification accuracy of the various ML algorithms used in the papers reviewed in the Project Summary section above.
Numerous different ML techniques has been extensively applied to the problem of IP traffic classification. Below is a summary of the ML techniques used in the papers reviewed in the Project Summary section above.
Supervised ML techniques
Decision Tree
o Decision Tree (4 papers)
o Naïve Bayes Tree
Neural Network
o Neural Net (2 papers)
o Multilayer Perceptron (MLP)
o Radial Basis Function Neural Network (RBF)
o Bayesian trained neural network
K-Nearest Neighbour
o k-NN (3 papers)
Support Vector Machine
o SVM (2 papers)
Various Naïve Bayes techniques
o Naïve Bayes Algorithm (2 papers)
o Naïve Bayes Estimator (2 papers)
o Bayes Net Algorithm
o Bayesian Network
o Naïve Bayesian classifier
o Naïve Bayes Discretisation
o Naïve Bayes Kernel density estimation
Unsupervised ML techniques
AutoClass (2 papers)
K-Means
DBSCAN
2.1.7 Featu re S election
Feature selection is highlighted as a critical step in IP traffic categorisation process, especially in real-time systems (Fahad et al., 2013; Singh et al., 2013; Williams et al., 2006; Yuan et al., 2010; Zander et al., 2005). This section will summarise the key feature selection techniques proposed in the relevant literature.
The goal of feature selection is to reduce the amount of information required to make good predictions, and to improve the error rate of classifiers. The ability to eliminate
features in order to improve the classification accuracy as well as to reduce the computational complexity related to the construction of the classifier (Fahad et al., 2013). Zhang et al. (2013a) demonstrated that a Naïve Bayes classifier with feature discretization demonstrates not only significantly higher accuracy but also much faster classification speed.
(Fahad et al., 2013) analysed six well-known feature selection techniques to identify the best features for network traffic based on the following evaluation criteria: information, dependence, consistency, distance, and transformation. The six feature selection techniques are
Information Gain (for information-based criteria),
Gain Ratio (for information-based criteria),
Principal Component Analysis (PCA) (for transformation- based criteria),
Correlation-based Feature Selection (CBF) (for dependence-based criteria),
Chisquare (for statistical criteria)
Consistency-based Search (CBC) (for consistency-based criteria).
The Authors propose a LOA (Local Optimisation Approach) feature selection technique that combines the five well-known feature selection techniques. This combined technique can compensate for some of the limitations of the individual techniques. The experimental results also showed that LOA performs significantly better than any individual technique.
2.1.8 Featu re Subs et Search T echn iques
Williams et al. (2006) created a feature subsets using two subset search techniques. The Best First and Greedy search methods were used in the forward and backward directions.
Greedy search examines changes to the current feature subset through the addition or removal of features. For a given ‘parent’ feature set, all possible ‘child’ subsets are tested through either the addition or removal of features. The child subset that shows the highest improvement (goodness measure) replaces the parent subset. The process is repeated until no more improvement can be made.
Best First search is similar to greedy search. The process creates new subsets based on the addition or removal of features. However, this technique has the ability to backtrack if the current path no longer shows improvement. A limit is placed on the number of non-improving subsets that are considered to prevent the search from backtracking through all possibilities in the feature space
2.1.9 Featu re Redu ction Algori th ms
Williams et al. (2006)then passed the feature subset generated from the subset search process to two different algorithms, to create reduced feature sets. These algorithms evaluate different combinations of features to identify an optimal subset:
Consistency-based feature subset search searches for the optimal feature subset, which is the smallest subset of features that can identify instances of a class as consistently as the complete feature set.
Correlation-based feature subset search uses an evaluation heuristic. The heuristic is used to examine the usefulness of individual features along with the level of inter-correlation among the features. The goal is to find feature subsets containing attributes that are highly correlated with the class and have low inter-correlation with each other.
2.1.10 Evaluation Metri cs
There are a four main of evaluation metrics proposed in the IP traffic classification literature for supervised ML algorithms:
Accuracy: Overall accuracy is the percentage of the sum of all correctly classified packets/flows over the sum of all testing packets/flows. This metric is used to measure the accuracy of a classifier on all testing data
Recall: recall is the ratio of correctly classified packets/flows over all ground truth data in a class
Precision: precision is the ratio of correctly classified packets/flows over all predicted packets/flows in a class
F-measure: Measure is used to evaluate the per-class performance. F-measure is calculated by
There are additional evaluating criteria proposed in the literature for real-time IP traffic classifiers.
Model build time (Erman et al., 2006)
Classification time (Singh et al., 2013)
System Throughput: (Li and Moore, 2007) defined custom evaluation metrics for real time classifiers. System throughput is a measure of the computational complexity in calculating features.
System Latency: (Li and Moore, 2007) also define latency as the ability to identify a flow as quickly as possible.
2.2 Traffi c Class ifi cation P aper s
This section will summarise the existing research in the area of IP traffic classification that most closely relate to this project.
Frank (1994) introduced the idea of using Machine Learning (ML) techniques for TCP flow classification in the context of intrusion detection. This research reviewed supervised ML techniques; neural network, decision tree, and unsupervised clustering techniques; k-nearest neighbour (k-NN). The research investigated using feature selection to improve the classification of network connections. The k-NN model was found to have a classification accuracy of 95%.
Karagiannis et al. (2005) defined a fundamentally different approach to classifying traffic flows by identifying patterns of host behaviour at the transport layer. This research focused on identifying the unique fingerprint of the connection between the application and the server. The research found that each internet applications/services has a unique connection fingerprint. The results showed that the research was able to classify 80%- 90% of the traffic with more than 95% accuracy by identifying connection patterns.
Moore and Papagiannaki (2005) demonstrated that using port numbers to classify internet traffic is no longer reliable. This research investigate the inaccuracies in port-based classification and identified the types of errors that may result. The research also quantifies the errors encountered. The research devises a Naïve Bayes estimator classification methodology that relies on the full packet payload inspection. The classifier has an accuracy approach 100% but proves to be a labour-intensive process due to the full packet payload inspection.
Moore and Zuev (2005) applied a supervised Naïve Bayes estimator to categorize traffic by service type. The authors used a hand classified dataset. The results indicated a 65% accuracy on per-flow classification using the simplest of Naive Bayes estimator. The research presents two refinement of Naive Bayes method that improves the overall accuracy to better than 95%. Firstly using kernel density estimation theory. Secondly using a method of feature selection and redundancy reduction, Fast Correlation-Based Filter (FCBF).
Zander et al. (2005) used the AutoClass unsupervised Bayesian classifier to learn the natural classes or clusters within network traffic. Each class represents a network traffic type. Network flows are classified based on statistical characteristics generated from packet header data. The authors used feature selection to find an optimal feature set and determine the influence of different features. The authors defined an accuracy metric termed intra-class homogeneity. The accuracy of the Auto Class classifier was found to be 86.5%.
Zuev and Moore (2005) created a hand-classified network dataset that was used as input to a supervised Bayes estimator. The classifier developed requires only the network protocol headers of unknown traffic for a successful classification. Most research looks at per flow or per packet accuracy. This research looked at per byte accuracy. The research demonstrated an accuracy of better than 66% of flows and better than 83% for packets and bytes.
Bernaille et al. (2006) used a Simple K-Means clustering algorithm to perform classification using only the first five packets of the flow. This research focused on classifying packets before the end of a TCP flow. The authors reported a 84.2% to 96.92% classification accuracy by service type. This research specifically considered real time classification of traffic in terms of memory and processing requirements
Erman et al. (2006) evaluated three unsupervised ML techniques for traffic classification. The authors compared K-Means and DBSCAN algorithms with previously used AutoClass technique. Although the authors found that the AutoClass algorithm produces the best overall accuracy at 97.6% there were positive findings from the other two clustering techniques. The DBSCAN algorithm placed the majority of the connections in a small subset of the clusters which can lead to a high predictive power of a single category of traffic. The K-Means algorithm had an overall accuracy that was only marginally lower than that of the AutoClass algorithm but may be more suitable for traffic classification due to its much faster model building time.
Williams et al. (2006) conducted a comparison of five supervised ML algorithms for practical traffic Classification, namely Naïve Bayes Discretisation, Naïve Bayes
Tree. When evaluating each algorithm, the authors specifically considered computational performance metrics such as build time and classification speed rather than classification accuracy alone. The authors concluded that classification accuracy between the algorithms is similar but computational performance differs significantly. When comparing the classification speed, the authors found that C4.5 is able to identify network flows faster than the remaining algorithms. The C4.5 algorithm had the best overall classification accuracy percentage at 94.13%, just ahead of the Bayes Net algorithm. This research also has extensive investigation into the use of feature reduction techniques to reduce the feature space.
Auld et al. (2007) designed a network traffic classifier that could achieve a high accuracy across a range of internet application types based on IP packet header-derived statistics.The ML technique used was a Bayesian trained neural network that produced a classification accuracy of up to 99%.
Li and Moore (2007) presented a ML approach to classify live network traffic. The authors created 12 features based on the packets at the start of each flow, without inspecting the packet payload, and used a C4.5 decision tree to classify the traffic. The method could identify different types of applications on live network traffic with 99.8% total accuracy. The research was not exclusively focused on classification accuracy, the latency and throughput of the classification system were investigated as highly important considerations.
Kim et al. (2008) conducted an evaluation of three ML traffic classification techniques, namely Support Vector Machine (SVM), neural network and k-NN. The feature space was based on transport layer ports, host behaviour, and flow statistical features. The results showed that SVM consistently achieved the highest classification accuracy at 99.42%.
Yuan et al. (2010) proposed a ML internet traffic classification method based on SVM. The research pays particular attention to real-time traffic classification considerations such as computation and storage requirements. This research actively tries to reduce the feature space to a small number of features that can be generated in real time from the packet headers. The SVM model achieves a classification accuracy of 99.42%.
Singh et al. (2013) focused on real time considerations of traffic classification using machine learning techniques. Five ML techniques were investigated, namely Multilayer Perceptron (MLP), Radial Basis Function Neural Network (RBF), C 4.5 Decision Tree Algorithm, Bayes Net Algorithm and Naïve Bayes Algorithm. The results showed that the Bayes Net classifier had the highest classification accuracy at 88.12%. However this technique has a long training time which does not meet the criteria for real-time traffic classification. The number of features was then reduced using Correlation based Feature Selection (FS) Algorithms, and Consistency based FS Algorithm was also tested. Using the new dataset the Bayes Net classifier gave the highest classification accuracy at 91.87% with the real time processing constraints.
Zhang et al. (2013a) investigated improving traffic classification using a limited amount of training data is available. Traffic flows were described using the discretized statistical features and flow correlation information modelled by bag-of-flow (BoF). The authors demonstrate that feature discretization can improve the Naïve Bayes model classification accuracy by approximately 5 percent when only 10 training samples are available for each traffic class. The overall classification accuracy of the Naïve Bayes classifier was 89.00%.
Zhang et al. (2013b) propose a framework based on Traffic Classification using Correlation (TCC) information. The approach is designed to address the problem of very few training samples. The research demonstrates that the TCC approach can be used on a small number of training samples to effectively improve the classification accuracy. The nearest neighbour (NN)-based method was found to have the highest classification accuracy of over 90%.
2.3 Survey Papers
Nguyen and Armitage (2008) reviewed 18 significant works that cover the period from 2004 to early 2007. The survey paper looks at emerging research into the application of ML techniques in IP traffic classification. This survey paper charts the move away from port based traffic classification techniques to the emerging techniques that use of statistical traffic characteristics. The paper also covers the more recent work on ML-based real-time IP traffic classification in operational networks.
The paper compiles a list of all the ML algorithms used in each of the papers review. The paper also contains a full list of statistical packet features generated in each paper reviewed and information about the level of classification. The paper concludes that a number of different ML algorithms such as AutoClass, Expectation Maximisation, Decision Tree, Naïve Bayes have demonstrated high classification accuracy of up to 99% for a range of Internet applications traffic.
Callado et al. (2009) explain the main techniques and problems known in the field of IP traffic classification. Packet-based and flow-based classification approaches are investigated. The advantages and problems for each approach is summarised. The paper summarises the many ML techniques used is key papers along with the evaluation of the accuracy of each technique. The paper also covers open research topics in the area of traffic classification. The paper concludes that there is no definitive best technique for IP traffic classification.
2.4 Featur e S el ection P aper
Feature selection, particularly reducing the feature space is an essential step in the traffic categorisation process. Fahad et al. (2013) focuses on feature selection for internet traffic classification. The paper introduces three new metrics, namely goodness, similarity and stability. These metrics can be used to compare feature selection techniques as well as to compare the quality of their outputs. The experimental results show that no existing feature selection technique performs well on all the three metrics. The paper conclude that identifying the best and most robust features, in terms of similarity, from the large feature space is critical importance for IP traffic classification. The results derived from real network traffic data shows that the Local Optimisation Approach (LOA) has the ability to identify the best features for traffic classification.
Appendix 1 contains a table that summarises the key points of the above reviewed research.
2.5 Dis cussi on
Network traffic classification is a key element in a number of important network management tasks. Research is the area of Network traffic classification has firmly focused on network traffic generated from personal computers. Research is the area has also focused on identifying high level classes or types of data such as web service or email.
This research will focus on network traffic generated on a mobile device. The continuing proliferation of mobile devices, the increase in mobile phone network traffic and mobile devices becoming the primary internet access device means that research into mobile device traffic classification is very relevant.
Network traffic generated on mobile devices is fundamentally different to network traffic generated by a personal computer. Users on mobile devices primarily use mobile apps to access a service as opposed to a web browser on a personal computer. This research will investigate mobile app traffic generate on a mobile device.
Mobile apps present a further unique problem regarding network traffic. Mobile apps can be designed to generated background network traffic that was not initiated by a user. This type of traffic can include checking for new messages, downloading new content, sending phone location updates etc. There is no existing research into classifying user generated versus app generated network traffic.
Based on the gaps identified in the current body of knowledge on network traffic categorisation, the research question is stated as follows:
“Can passive mobile app traffic be identified using machine learning techniques?”
2.6 Conclusi on
This chapter has presented a literature review of the existing knowledge base. Research gaps have been identified and the research question had been clearly stated. The research question and the literature review will serve as the foundations for the experiment design and implementation.
3
DESIGN METHODOLOGY
3.1 Introdu cti on
This chapter outlines the experiment design, including the experimental methodology and introduces the key considerations of this experiment. This project will propose and innovative experiment design in order to capture and analyse active and passive mobile phone app network traffic. Important experiment setup decisions, including the data capture process and machine learning techniques consider are discussed and justified.
This chapter starts by describing the overall solution approach. Then the hardware and software requirements will be outlined. Next the data collection process is presented. Followed by feature creation process, feature reduction and machine learning techniques for modelling. Finally the model evaluation set up is explained. For clarity and completeness, Chapter 4 (Experiment Implementation) will follow the same heading structure as this chapter.
3.2 Solution A ppr oach
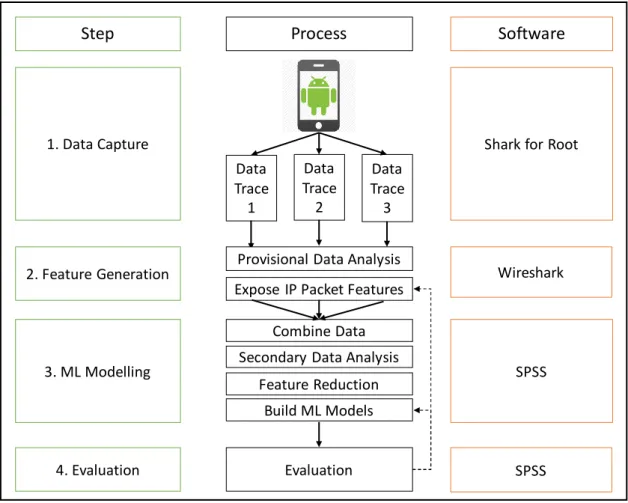
This research project will follow a five step solution approach outlined in Figure 3-1 below.
Data Trace 1 Data Trace 2 Data Trace 3
Expose IP Packet Features
Shark for Root
Wireshark Combine Data SPSS Evaluation Software Step Process SPSS 1. Data Capture 2. Feature Generation 3. ML Modelling 4. Evaluation
Secondary Data Analysis Feature Reduction
Build ML Models Provisional Data Analysis
Figure 3-1 : Experiment Process Diagram
The experiment processes starts by collecting network traffic data generated by apps on an Android OS mobile phone device. The captured network traffic data will then be examined and features will be created based on the properties of the IP packets. The output files containing all the relevant IP packet features will then be passed to statistical modelling software.
Multiple machine learning techniques are applied to the data. The performance of each machine learning model will be evaluated based on the evaluation criteria. If the models are evaluated to have a poor performance, the model evaluation phase may lead back to the feature selection/generation phase or to another round of model building in order to improve model accuracy. New IP packet features can be generated and the models can be re-evaluated.
The sections below outlines the high level process for each of the steps in the experiment:
3.2.1 Step 1 - Data Cap tu re
The data collection phase requires mobile phone hardware and software as well as personal computer based software. The full data capture process will be performed once which will result in a total of 3 data traces.
3.2.1.1 Hardware: Android devi ce
The first step in the data collection process was to set up the mobile phone device. The collection task, also known as a data trace, was performed using on an Android device. The specific device used to capture the data traces was a HTC One S running Android OS version 4.1.1.
The mobile phone device requires IP packet capture software to be install in order to capture app network traffic data. The IP packet capture software is non-standard Android OS software and therefore cannot be installed on a standard Android OS device. In order to install the necessary packet capture software the Android device needs to be “rooted”.
Rooting is the process that allows users of devices running the Android mobile operating system to attain privileged control, also known as "root access" to the Android OS sub-system. Once the Android OS device has been rooted, users can run specialized apps that require administrator-level permissions1.
3.2.1.2 Soft ware: Shark for Root
Once the device is rooted the IP packet capture software is installed on the mobile device. This project uses Shark for Root software available from the Google Play Android Store2. The Shark for Root software will be used to capture all IP packets created by the mobile apps during the data collection events outlined below.
1http://en.wikipedia.org/wiki/Rooting_%28Android_OS%29 Date Accessed 20/11/2014 2https://play.google.com/store/apps/details?id=lv.n3o.shark Date Accessed 01/10/2014
3.2.1.3 Apps : Appli cations considered
A specific set of eleven apps were chosen to be used during the data trace process. These apps have been chosen for two reasons, they are either the most downloaded apps from the Google Play Store or they are the most used apps on mobile networks34. By limiting the experiment to these apps, the experiment will cover the apps that take up the most network bandwidth. This increases the relevance and value of the project.
Limiting the number of apps also allows the scope of the project to be clearly defined. The limited number of apps will also help during the analysis phase when captured packets can be attributed to a specific app if required. The list of eleven apps in scope for this project are:
1. Facebook 2. Facebook Messenger 3. YouTube 4. Gmail 5. Instagram 6. Snapchat 7. Twitter 8. WhatsApp 9. Viber 10.Skype 11.Angry Birds
3.2.1.4 Process: Data Traces
The data traces will capture network IP packets generated by apps running on the mobile device. In order to get samples of active and passive app network traffic data, three separate data traces have been designed. Each trace will capture a specific type of active or passive app network data.
3
http://www.comscore.com/Insights/Presentations-and-Whitepapers/2014/The-US-Mobile-App-Report Date Accessed 01/02/2015
4http://en.wikipedia.org/wiki/List_of_most_downloaded_Android_applications Date Accessed
Data trace 1 will capture active app network traffic data. This data trace will capture active, user-generated traffic over a period of 30 minutes directly from the mobile device. During the data trace capture period, each of the eleven apps will be opened and specific actions will be performed on each app. The app actions will include opening the app, opening content, streaming videos, VoIP calls, sending message and receiving message.
In order to fully capture passive app network data, two separate data traces have been deigned.
Data trace 2 is designed to capture passive app network traffic. Specifically, data trace 2 is designed to capture passive app network data when the specified apps are known to be open on the phone but the apps are not actively being used by the end-user.
Data trace 2 will be undertaken following on from data trace 1 with a 5 minute gap after the end of data trace 1. The mobile phone device will then be left idle for a period of 30 minutes. No actions at all will be performed on the mobile phone device during the idle time to allow passive app network traffic to be isolated using this data trace set up.
Data trace 3 is designed to capture passive app network traffic when no apps have specifically been opened by the end-user. For this data traces, the mobile phone will be restarted. There will be a five minute wait so that phone and the apps are in steady state post start-up. The device will then be left idle for a period of 30 minutes. Similarly to data trace 2, no actions at all will be performed on the mobile phone device during the idle time to allow passive app network traffic to be isolated using this data trace set up.
It is important to distinguish between the two different situations captured in data trace 2 and data trace 3. The two different data traces will allow this project to capture the network traffic generated by an app that has been opened but is no longer in use, and an app that has never been opened but is sending background data.
3.2.1.5 Dat a P reparati on
After the data is collected, the data in each data trace needs to be tagged in preparation for the modelling phase of the project. Each record in data trace 1 will be tagged as “active”. Each record in data trace 2 and 3 will be tagged as “passive”. These datasets will form the basis of the training and testing data for the machine learning algorithms. The data traces are then exported from the mobile device to a PC for analysis and prepared for the modelling phase.
3.2.2 Step 2 - Featu re G enerati on
3.2.2.1 Soft ware: Wi reshark
Personal computer based packet analysis software is required as part of this project. Wireshark software5 was chosen for this task. Wireshark software is a fully featured, open source network packet analysis software6. The system specification of the personal computer used in this research is as follows:
OS – Windows 7 Professional Service Pack 1
Processor – Intel Core i5 – 3320m CPU @ 2.60GHz
RAM – 16.0GB
The Wireshark software enables two key tasks in this project: 1) Inspect and analyse the network packets. For example
Review the data and check the data properties such as data volumes for each protocol or packet size distributions.
Build visualisation such as input/output (IO) graphs of network data over time.
Reconstruct TCP flows from network packet 2) Build data record features for machine learning stage
Using Wireshark software, IP packet attributes can be exposed. By default Wireshark only shows approx. 20 general IP packet attributes such as IP address and port numbers. Other packet attributes need to be specifically added to the Wireshark view using specific commands.
5www.wireshark.org Date Accessed 12/02/2015
For a full list of available packet name attributes please see the Wireshark Display Filter Reference Index web page7.
3.2.2.2 Provi sional Dat a Anal ysis
The provisional data analysis task is focused on examining the network properties of the data using the in-built tools in the Wireshark software. The in-build analysis tools are specially designed to allow network data to be reconstructed and viewed from a network level. The in-built analysis tools allow the data to be examined in a way that would not be possible within statistical analysis software.
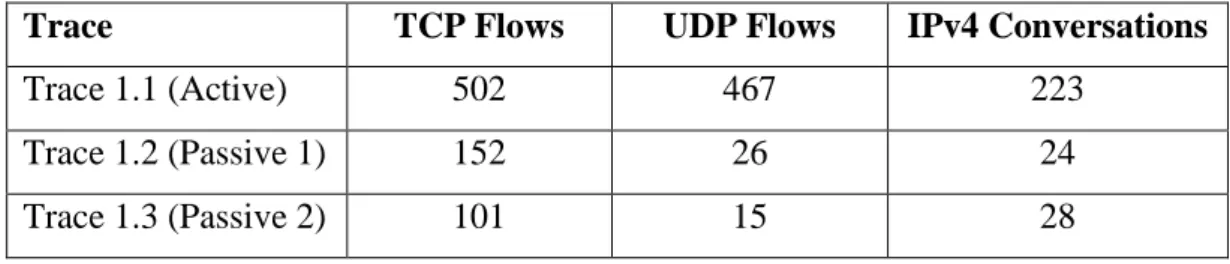
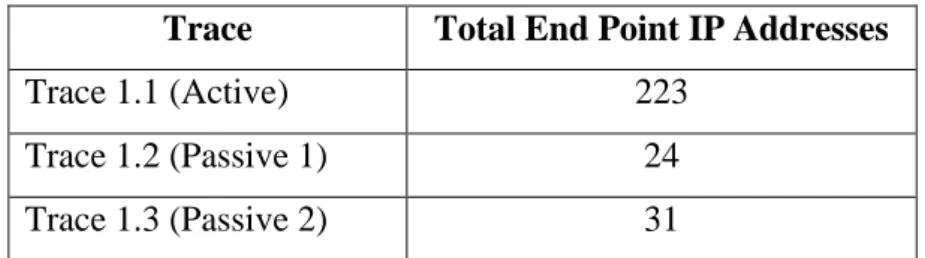
It is anticipated that the three sub-tasks will be undertaken during this task. 1) Data record exploration to understand the high level characteristics of the dataset 2) TCP/UDP flow reconstruction to show how may flows were created within each data trace 3) Network input/output (IO) graphs to help visualise the traffic flow on the network and potentially highlight any differences between the active and the passive traces.
3.2.2.3 Expose IP Packet Features
Network IP packets have hundreds of potential features available. In Wireshark the packet attributes are called display filters. For example, the TCP protocol part of the IP packet has 207 display filters8. Wireshark's most powerful feature is its vast array of display filters (over 174000 fields in 1000 protocols as of version 1.12.3)9. Some display filters may not be populated for an IP packet because not all the attribute are populated within and IP packet. Also encrypted network packets will have a reduced set of display filters available because attributes can’t be identified due to the encryption.
There are a large amount of features recommended in the literature. Nguyen and Armitage (2008) presented a list of features previously used in 18 key papers in the
7https://www.wireshark.org/docs/dfref/Date Accessed 12/02/2015
8https://www.wireshark.org/docs/dfref/t/tcp.htmlDate Accessed 12/02/2015
area of IP traffic classification. A summary of the key features are presented below. The number of papers that the feature appears in is shown in square brackets.
Packet features
o Packet length [5]
o Packet length statistics (min, max, mean, std dev.) [4]
o Inter-Packet lengths statistics (min, max, mean, std dev.) [1]
o Average inter packet gap [1]
o Packet Inter-arrival time (minimum, mean, maximum and standard deviation) [5]
o Packet arrival order [1]
Protocol features
o Size of TCP/IP control fields [1]
o Protocol [2]
o Numerous TCP-specific values derived from TCP trace (e.g. total payload bytes transmitted, total number of PUSHED packets, total number of ACK packets carrying SACK information etc.) [1]
Bytes features
o Payload size [2]
o mean payload length excluding headers [2]
o Number of bytes transferred (in each direction and combined) [1]
o Number of bytes transferred [1]
o Message size (the length of the message encapsulated into the transport layer protocol segment) [1]
Flow features
o Flow volume in bytes and packets [1]
o Flow metrics (duration, packet-count, total bytes) [1]
o Flow duration [3]
o Total packets in each direction and total for bi-directional flow [1]
Similar to previous research this project will be based on packet level analysis, as opposed to flow based analysis. This project will take a different approach to previous literature when it comes to feature generation.
Previous research has tried to compute packet or flow features such as “Mean payload length excluding headers”. Computing packet or flow features can have significant processing overheads. Also, waiting for a flow to complete could mean storing all contents of the flow, possible in memory for a considerable period of time. There will also be a very large number of flows active on a network at any point in time. Storing all flows until completion is not possible in real world networks.
This project will look at inherent packet features only. Inherent IP packet features are available to a classification algorithm as soon as the packet is presented. No feature computation will be considered. This approach is taken for two reasons 1) to allow for real time deployment where fast classification of packets is required as each packet arrives 2) to test if feature computation is necessary or inherent packet features alone can be used by a machine learning algorithm to classify active versus passive network traffic with an equivalent level of accuracy as previous research.
This project will also look to identify new features, not previously considered in research that could be beneficial during the machine learning modelling phase. Identifying new features is especially important for this project of the approached taken not to compute new features. A propriety set of features will be required. The new feature generation process will be enabled by the large number of inherent IP packet attributes available. It is anticipated that the feature generation will be an iterative process.
3.2.3 Step 3 – Machine L earning Modell ing
Supervised learning techniques are the predominant ML classification used in research in IP traffic classification. This research will also investigate supervised learning techniques to try to identify user-generated versus app-generated traffic. Please refer to Section 2.1.6 for an overview of ML techniques previously used in the area of IP
traffic classification. These ML techniques will form the starting point for this phase of the project. Other techniques may be used if deemed appropriate.
3.2.3.1 Soft ware: SPSS
This project requires machine learning software to build the end to end machine learning models. The software is also used to evaluate the performance of the machine learning techniques. IBM SPSS Software was chosen as the software to build and test the machine learning algorithms (IBM SPSS Modeler 15.0). IBM SPSS software was chosen for the below reasons:
Industry leading statistical analysis software.
Fully featured statistical analysis tool
Full suite of ML algorithms available, including ML techniques considered in this research
Access – software is available for this research for free
Experience and expertise in using this software
3.2.3.2 Combine Data
Each of the individual data trace files will be passed to the SPSS software as csv files. The files will then be combined to create a single dataset that can be used in the ML model building process.
3.2.3.3 Secondar y Dat a anal ysis
Using SPSS the final dataset is analysed. This is an important data understanding phase. The analysis is broken out by the active and passive indicator to allow for analysis of features that may be distinctive between the active and passive datasets and therefore have high importance factors for machine learning algorithms. During this step the final data preparation tasks will take place such as filtering non distinctive or null value features.
3.2.3.4 Feature Reduction
This project will attempt to find the best features to use to detect user-generated versus app-generated IP traffic. The best features to use will vary based on the data mining technique and the data being analysed. The task at this step is to identify the optimal
set of features that minimizes the processing cost, while maximizing the classification accuracy.
3.2.3.5 Bui ld Machi ne Learning Model s
The literature review section outlined the numerous different ML techniques that have been extensively applied to the problem of IP traffic classification. Supervised ML techniques are much more prevalent in the literature. Below is a summary of the ML techniques used in the papers section above.
Supervised ML techniques
Decision Tree
o Decision Tree [4 papers]
o Naïve Bayes Tree
Neural Network
o Neural Net [2 papers]
o Multilayer Perceptron (MLP)
o Radial Basis Function Neural Network (RBF)
o Bayesian trained neural network
K-Nearest Neighbour
o k-NN [3 papers]
Support Vector Machine
o SVM [2 papers]
Various Naïve Bayes techniques
o Naïve Bayes Algorithm [2 papers]
o Naïve Bayes Estimator [2 papers]
o Bayes Net Algorithm
o Bayesian Network
o Naïve Bayesian classifier
o Naïve Bayes Discretisation
o Naïve Bayes Kernel density estimation
Unsupervised ML techniques