Hierarchical Decision-making using a New Mathematical Model
based on the Best-worst Method
M.H. Tabatabaei, M. Amiri, M. Ghahremanloo, M. Keshavarz-Ghorabaee, E.K. Zavadskas, J. Antucheviciene
Mohammad Hashemi Tabatabaei
Department of Industrial Management
Faculty of Management and Accounting, Allameh Tabataba’i University, 14348-63111 Tehran, Iran [email protected], [email protected]
Maghsoud Amiri
Department of Industrial Management
Faculty of Management and Accounting, Allameh Tabataba’i University, 14348-63111 Tehran, Iran [email protected]
Mohammad Ghahremanloo
Department of Management
Faculty of Industrial Engineering and Management, Shahrood University of Technology, 36199-95161 Shahrood, Iran
[email protected], [email protected]
Mehdi Keshavarz-Ghorabaee
Department of Management
Faculty of Humanities (Azadshahr Branch), Gonbad Kavous University, 49717-99151 Gonbad Kavous, Iran
[email protected], [email protected]
Edmundas Kazimieras Zavadskas*
Department of Construction Management and Real Estate
Vilnius Gediminas Technical University, Sauletekio al. 11, LT-10223Vilnius, Lithuania *Corresponding author: [email protected]
Jurgita Antucheviciene
Department of Construction Management and Real Estate
Vilnius Gediminas Technical University, Sauletekio al. 11, LT-10223Vilnius, Lithuania [email protected]
Abstract: Decision-making processes in different organizations often have a hierar-chical and multilevel structure with various criteria and sub-criteria. The application of hierarchical decision-making has been increased in recent years in many different areas. Researchers have used different hierarchical decision-making methods through mathematical modeling. The best-worst method (BWM) is a multi-criteria evalua-tion methodology based on pairwise comparisons. In this paper, we introduce a new hierarchical BWM (HBWM) which consists of seven steps. In this new approach, the weights of the criteria and sub-criteria are obtained by using a novel integrated mathematical model. To analyze the proposed model, two numerical examples are provided. To show the performance of the introduced approach, a comparison is also made between the results of the HBWM and BWM methodologies. The anal-ysis demonstrates that HBWM can effectively determine the weights of criteria and sub-criteria through an integrated model.
Keywords: decision model, MCDM, best-worst method, hierarchical decision-making, pairwise comparison.
1
Introduction
Often in most decision-making cases, a number of alternatives are ranked and selected according to different criteria; but it’s not always a simple task. In various issues of today’s complex world, which require correct and timely decisions, we often deal with a hierarchical and multilevel structure with various criteria and sub-criteria, which should be considered in decision making according to their significance [4]. Multi-criteria decision-making (MCDM) approach helps to select appropriate alternatives through mathematical and computational techniques [35]. The need for this category of multi-criteria decisions is felt to solve today management problems [13, 21]. Recently, some researchers have developed MCDM methods, Jiang and Huang [12] introduced a new fuzzy MCDM approach to evaluate the performance of green supply chain management. Xu et al. [41] developed the TOPSIS (Technique for Order of Preference by Similarity to Ideal Solution) using Neutrosophic Approach. Also, Ren et al. [24] developed TODIM (an acronym in Portuguese for Interative MCDM) Method for MADM Problem in Fuzzy Environment.
From a scientific perspective, there are two basic elements to support the hierarchical decision-making process: 1) How to create a hierarchical decision-making model to describe the decision-making process; and 2) Finding the optimal method for calculating the weights of criteria and choosing the alternatives [16].Various techniques of MCDM have been widely used in the last few years to find solutions for many real-world problems [11]. Interested readers are referred to some review articles that presented and analyzed different MCDM approaches in dif-ferent fields of real-world decision problems [11,16]. In 2015, the best-worst method (BWM) was introduced as a new MCDM method. The best and the worst criteria mean the most and the least significant criteria, respectively. After making the comparisons, a Min-Max mathematical programming model was formulated to determine the optimal weights of the criteria. It was also found that the BWM was better than the analytical hierarchy process method because it requires less data, and it’s easier to use [26].
In this paper, given the importance of hierarchical decision making, we present an MCDM method based on BWM. In this novel method, an integrated mathematical model is used to calculate weights of criteria and sub-criteria simultaneously. In the original BWM, if we have j criteria and k sub-criteria, we must solve the BWM model (j + 1) times in order to obtain
the weights of the criteria and sub-criteria, but in the HBWM, we will obtain the weights of the criteria and sub-criteria in an integrated model based on BWM with running the model once. The HBWM also provides a global weight for each sub-criterion. In addition, the proposed method allows the calculation of the compatibility rate of criteria and sub-criteria for pairwise comparisons.
The remainder of the paper is organized as follows. We describe the hierarchical decisions, development and application of the BWM in Section 2. In Section 3, we present the proposed HBWM methodology along with its steps, integrated mathematical model, variables, and pa-rameters. In Section 4, two numerical examples are provided and the results of the HBWM model are compared with the original BWM model. Finally, we discuss the results and present suggestions for future research in the conclusion section.
2
Literature review
2.1 Hierarchical decision-making
AHP was introduced by [29, 30]. It is a decision-making support tool that can be used to solve complex decision problems. It uses a multi-level hierarchical structure of goals, criteria,
sub-criteria, and alternatives [38]. The analytic network process (ANP) is known as one of the AHP developments, and it structures a decision problem as a network [31]. Many researchers have used these methods to obtain optimal weights of decision-making sub-criteria [5,23,36]. In addition, other well-known methods in the MCDM field, such as TOPSIS, VIKOR (in Serbian: VIĹĄekriterijumska optimizacija i KOmpromisno ReĹĄenje) and ELECTRE (in French: ELim-ination Et Choix Traduisant la REalitĂŠ) methods have also been developed in a multilevel and hierarchical environment [3, 15, 43]. These methods made changes in the original method to obtain the optimum weights of the criteria and sub-criteria and to rank the alternatives. However, in recent years, some researchers have successfully developed new methods for multi-criteria decision-making. For example, Rezaei [26] developed a new MCDM method, which had less computation and pairwise comparisons are more consistence than the AHP method, and it was also used in the hierarchical environment [8].
2.2 Developments and applications of BWM
The best-worst methodology was introduced as an efficient MCDM method based on pairwise comparisons. In this method, the best (the most favorable) and the worst (the least favorable) criteria are chosen by decision makers without performing pairwise comparison and the rest of the criteria are compared with them in a pairwise manner, then a max-min problem is formulated and solved to obtain the optimum weight of the criteria [26]. Many researchers have used this method to obtain the optimal weights of decision-making criteria and ranking the alternatives in various real-world decision problems such as supplier selection [2,8,28], calculating the efficiency [9,33], sustainability study [25, 40] performance evaluation [42, 44, 45], web service selection [34] and power source evaluation [39]. Meanwhile, other researchers developed the BWM and added new capabilities to its basic model. Rezaei [27] added new features to the model; he introduced a linear mathematical programming model that yielded a unique solution.
Mou et al. [20] presented a new BWM-based group decision-making model in uncertain conditions and used it to solve health management problems. Guo et al. [6] presented the BWM model in a fuzzy environment using a nonlinear mathematical model, and used real-world case studies to describe the model. Hafezalkotob & Hafezalkotob [10] discussed and evaluated the fuzzy BWM model in group decision-making that used two linear programming models. In their approach, the final decision was made based on composition of decisions of senior decision-makers and experts. Also, Aboutorab et al. [1] presented the Z-number version of the BWM under the condition of uncertain input data and solved the supplier selection problem in the form of a case study by using the mentioned methodology. Safarzadeh et al. [32] used a new BWM model with two new mathematical models in group decision-making and evaluated the new model using numerical examples and the real-world case studies. Tabatabaei et al. [37] developed the BWM model in the form of group decision making. This method is applicable when a decision-group, including a manager and several experts, is required to evaluate several options or criteria.
Pamucar et al. [22] proposed a new integrated model based on the interval rough numbers (IRN), BWM, Weighted Aggregates Sum Product Assessment (WASPAS) and Multi-Attributive Border Approximation area Comparison (MABAC) to evaluate third-party logistics (3PL) providers. In another study, the fuzzy BWM was used as a MCDM methodology to prepare the strategy of a manufacturing company in Iran. The proposed method provided a new approach to determine weight vector from matrices of the fuzzy pairwise comparisons. For this purpose, a nonlinear optimization model was developed [14]. A group hierarchical decision-making algorithm was introduced by Maghsoodi et al. [17] based on the principles of Axiomatic design and the BWM in a fuzzy environment, then a case study about selecting the conceptual design of a speaker prototype was examined using the proposed method.
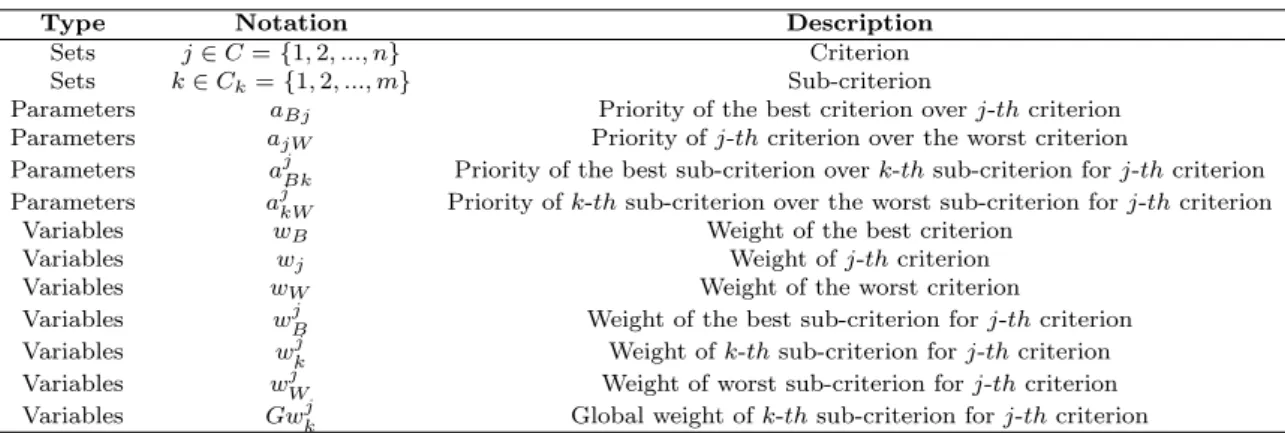
Table 1: Notations and their descriptions
Type Notation Description
Sets j∈C={1,2, ..., n} Criterion
Sets k∈Ck={1,2, ..., m} Sub-criterion
Parameters aBj Priority of the best criterion overj-thcriterion
Parameters ajW Priority ofj-thcriterion over the worst criterion
Parameters ajBk Priority of the best sub-criterion overk-thsub-criterion forj-thcriterion Parameters ajkW Priority ofk-thsub-criterion over the worst sub-criterion forj-thcriterion
Variables wB Weight of the best criterion
Variables wj Weight ofj-thcriterion
Variables wW Weight of the worst criterion
Variables wjB Weight of the best sub-criterion forj-thcriterion Variables wjk Weight ofk-thsub-criterion forj-thcriterion Variables wjW Weight of worst sub-criterion forj-thcriterion Variables Gwjk Global weight ofk-thsub-criterion forj-thcriterion
In this paper, considering the basic model of the BWM and its details, and considering the need for decision making in the hierarchical and multilevel conditions, we introduce a multi-criteria hierarchical best-worth method (HBWM) with an integrated non-linear mathematical model. In the next section, details of the HBWM are described. In order to evaluate the new model, two numerical examples, which previously solved by a simple BWM model in hierarchical conditions and by involvement of sub criteria, will be examined by the new model and the results will be compared. The advantages of the new HBWM model are as follows:
• Reducing the number of repetitions of basic BWM model for hierarchical decisions from (j+ 1)to one, wherej represents the number of criteria.
• Calculating the weights of criteria, sub-criteria as well as the global weight in an integrated mathematical model.
• Possibility to calculate the consistency rate for comparisons performed for criteria and sub-criteria only by solving the model once.
3
The HBWM
In decision-making, determining some sub-criteria along with main criteria is essential for assessment of alternatives. It can be helpful to provide a model that has the ability to involve sub-criteria in decision-making and requires less data and information to make decisions while preserving the benefits of previous approaches. The model developed in this study which is based on the BWM for hierarchical decision making, can be used as an efficient tool by researchers and managers in various organizations. The proposed model allows the calculation of consistency rate of the decisions made based on pairwise comparisons performed for criteria and sub-criteria.
3.1 Proposed model
In the proposed model, a "global weight" is calculated by combining the weights of all sub-criteria of the decision-making problem. The notations and their descriptions are presented in Table 1.
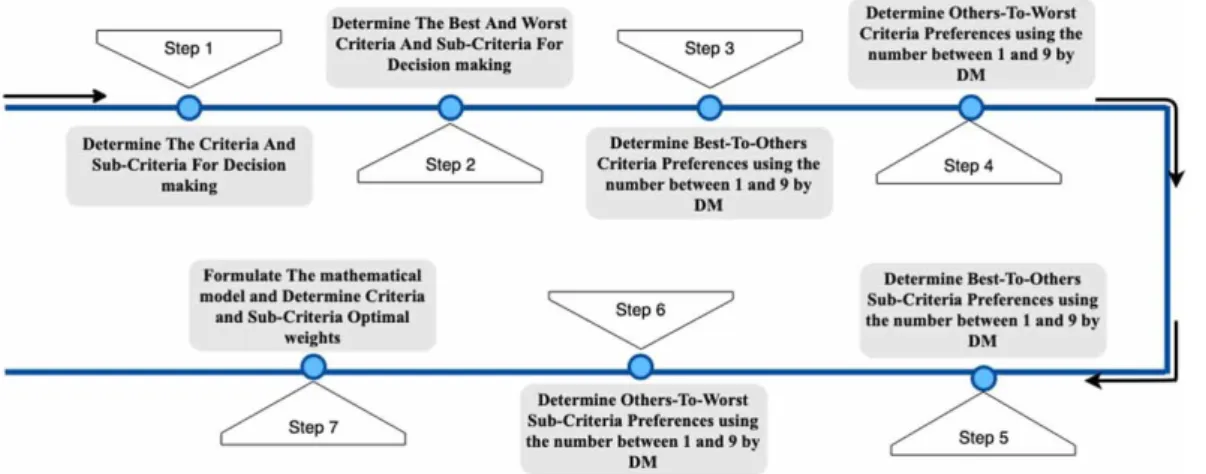
The procedure of the HBWM are as follows:
Step 1. Identifying the decision criteria and sub-criteria: In this step, the decision criteria and sub-criteria are defined as {c1, c2, ..., cn} and {c1k, c2k, ..., cnk}respectively.
Step 2. Identifying the best (most important, most desirable) and the worst (least important, least desirable) criteria and sub-criteria: the best and the worst criteria and sub-criteria are selected. No comparison will be made at this step.
Step 3. At this step, the priority of the best criterion over each of other criteria is determined as a number between 1 and 9, which is expressed as AB = (aB1, aB2, ..., aBn) where aBi is the
priority of the best criterion overj-th criterion and aBB = 1, Eq. (2).
Step 4. At this step, the priority of each criterion over the worst criterion is determined as a number between 1 and 9, which is expressed as AW =(a1W, a2W, ..., anW), where ajW is the
priority ofj-th criterion over the worst criterion and aW W = 1, Eq. (3).
Step 5. At this step, the priority of the best sub-criterion over each of other sub-criterion is determined as a number between 1 and 9, which is expressed asAB =(ajB1, ajB2, ..., ajBk), where
ajBkis the priority of the best sub-criterion overk-thsub-criterion inj-thcriterion andajBB= 1, Eq. (4).
Step 6. At this step, the priority of each sub-criterion over the worst sub-criterion is determined for each criterion as a number between 1 and 9, which is expressed as AB =
(aj1W, aj2W, ..., akWj ), where ajkWis the priority of k-th sub-criterion over the worst sub-criterion
for j-th criterion andajW W = 1, Eq. (5).
Step 7. Calculating the weights of the criteria(w∗1, w2∗, ..., w∗n)and sub-criteria(w1j∗, wj2∗, ..., wjk∗). Eq.(1) is the objective function of the model and yields the minimum deviations of the comparisons made for the criteria and sub-criteria.
Eq.(6) calculates the global weights of the sub-criteria.
Eq.(7) shows that sum of the criteria weights must be equal to 1 and the weight of each criterion must be non-negative.
Eq.(8) shows that sum of the weights of sub-criteria of thej-th criteria must be equal to 1
and the weight of each sub-criterion must be non-negative.
We can write the model of HBWM as follows, Eqs. (1) to (8): Min ξL+X j ξjL (1) |wB−aBjwj| ≤ξL,∀j (2) |wj−ajWwW| ≤ξL,∀j (3) |wBj −ajBkwkj| ≤ξLj,∀j &∀k (4) |wjk−ajkWwWj | ≤ξjL,∀j &∀k (5) Gwkj =wjwjk,∀k (6) X j wj = 1, wj ≥0 (7) X k wjk= 1, wjk≥0 (8) The HBWM includes seven steps, as shown in Fig. 1.
Figure 1: Decision-making process in HBWM
3.2 Calculating the consistency rate
Given that in the HBWMξLof comparisons performed for the criteria andξjLof comparisons
performed for the sub-criteria of each criteria are determined separately by the model, and the results are calculated in a similar way to the basic BWM, the consistency index provided for the basic BWM can be used to calculate the consistency rate of the comparisons performed for the criteria and sub-criteria. The consistency rate in the BWM is obtained with respect to the value of the priority of the best criterion over the worst criterion and the priority of the best sub-criterion over the worst sub-criterion ofj-th criterion. its values are shown in Table 2 [26].
Table 2: Consistency index in BWM
aBW, ajBW 1 2 3 4 5 6 7 8 9
Consistency Index (Maxξ ) 0.00 0.44 1.00 1.63 2.30 3.00 3.73 4.47 5.23
Given the minimum deviations of the comparisons performed for the criteria(ξ∗) and the sub-criteria of each criterion(ξj∗)which are calculated through the BWM, and the inconsistency rate provided in Table 2, we can calculate the consistency rate for the criteria and sub-criteria of each criterion using Eqs. (9) and (10).
Consistency rate= ξ ∗ Consistency index (9) Consistency rate= ξ ∗ j Consistency index (10)
4
Numerical examples
Several authors have tried in their papers to measure the weights of criteria and sub-criteria in decision making using the BWM. We can show that it is possible to calculate the weights of criteria and sub-criteria in a single integrated hierarchical decision making model and achieve the same results as the best-worst method. For this purpose, we use the criteria and sub-criteria and the questionnaire data provided in two previously done studies and compare the results of the basic model and the proposed HBWM.
4.1 Example 1
In reference [7] Gupta and Barua, a study was conducted to identify important factors of technological innovations in the field of MSME (Micro-Small and Medium Enterprises) in India. The authors used the research literature and experts’ judgments to identify the factors of technological innovation. They calculated the optimum weights of the criteria and sub-criteria using the basic model of the BWM.
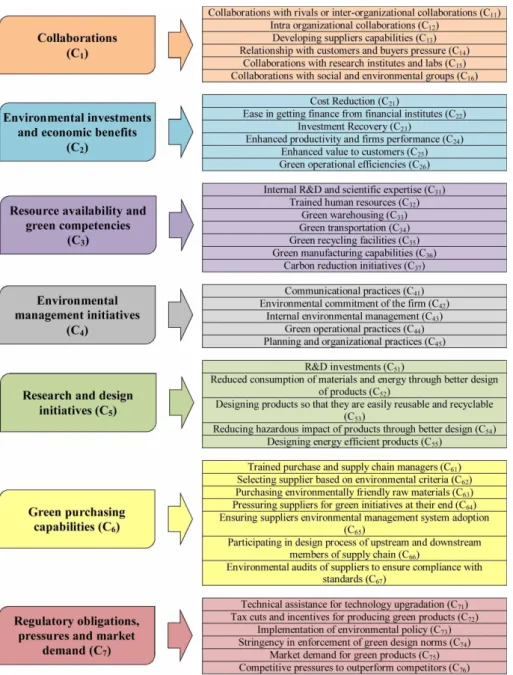
In the first numerical example, the criteria and sub-criteria and their study information are examined using the new model (HBWM) and the new model is evaluated by comparing the results. Evaluation criteria are shown in Figure 2.
Figure 2: Main criteria and sub-criteria for Example 1
In Example 1, criteria and sub-criteria and questionnaire data provided in the study of Gupta and Barua [7] have been used. In their paper, they tried to identify significant factors of technological innovation. Table 3 represents BWM questionnaire data obtained by them and the pairwise comparisons of criteria and sub-criteria including best-to-others(BO) and others-to-worst(OW).
Table 3: The comparisons for the criteria and sub-criteria in Example 1 Criteria BO OW Sub-criteria BO OW Sub-criteria BO OW
C1 2 4 C11 8 1 C21 1 6 C2 5 1 C12 1 8 C22 6 1 C3 1 5 C13 3 2 C23 3 2 C4 3 2 C14 2 3 Sub-criteria BO OW Sub-criteria BO OW C31 5 1 C41 1 8 C32 1 5 C42 3 4 C33 4 2 C43 8 1
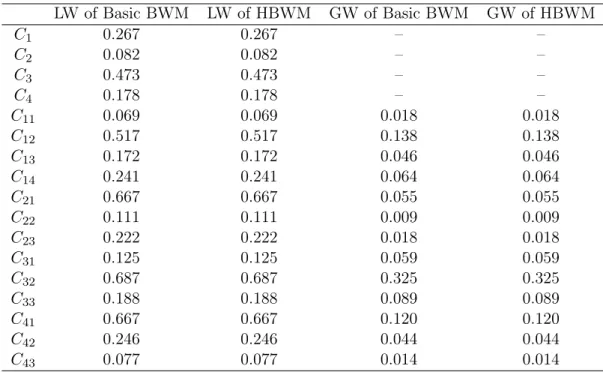
Table 4 shows the results of basic BWM and HBWM for the first numerical example. The results show that the weights obtained for criteria and sub-criteria by HBWM are same as the
weights obtained by BWM. In the study of Gupta and Barua [7], the basic BWM was solved (j+1) times to obtain the weights of criteria and sub-criteria; however, in the proposed approach, weights are obtained by solving the integrated model of HBWM only one time. Table 5 represents the values ofξL andξLj for criteria and sub-criteria in Example 1.
Table 4: Local weights(LW) and Global weights(GW) for Example1
LW of Basic BWM LW of HBWM GW of Basic BWM GW of HBWM C1 0.267 0.267 – – C2 0.082 0.082 – – C3 0.473 0.473 – – C4 0.178 0.178 – – C11 0.069 0.069 0.018 0.018 C12 0.517 0.517 0.138 0.138 C13 0.172 0.172 0.046 0.046 C14 0.241 0.241 0.064 0.064 C21 0.667 0.667 0.055 0.055 C22 0.111 0.111 0.009 0.009 C23 0.222 0.222 0.018 0.018 C31 0.125 0.125 0.059 0.059 C32 0.687 0.687 0.325 0.325 C33 0.188 0.188 0.089 0.089 C41 0.667 0.667 0.120 0.120 C42 0.246 0.246 0.044 0.044 C43 0.077 0.077 0.014 0.014
Table 5: The values of ξL and ξjL for criteria and sub-criteria in Example 1
Comparisons Basic BWM HBWM C1,C2,C3,C4 0.061 0.061 C11,C12,C13,C14 0.034 0.034 C21,C22,C23 0 0 C31,C32,C33 0.062 0.062 C41,C42,C43 0.061 0.061 4.2 Example 2
In the study of Gupta and Barua [8], supplier selection in SMEs was investigated based on the green innovation criteria. They first selected the green innovation criteria by reviewing the related literature and interviewing with decision makers, then determined the weights of criteria and sub-criteria using basic BWM, and finally ranked the alternatives using the fuzzy TOPSIS method. In the second numerical example, the results of their study are examined and compared with the HBWM model to evaluate the performance of the new model. The criteria and sub-criteria are shown in Figure 3.
In Example 2, criteria and sub-criteria and questionnaire data provided in the study of Gupta and Barua [8] are used. In their paper, they tried to identify significant factors of green innovation. Table 6 represents BWM questionnaire data obtained by them and the pairwise comparisons of criteria and sub-criteria including BO and OW.
Table 6: The comparisons for the criteria and sub-criteria in Example 2 Criteria BO OW Sub-criteria BO OW Sub-criteria BO OW
C1 8 2 C11 4 2 C21 8 1 C2 2 4 C12 3 3 C22 2 4 C3 1 9 C13 2 4 C23 1 8 C4 9 1 C14 1 9 C24 4 2 C5 3 3 C15 7 2 C25 3 3 C6 6 2 C16 9 1 C26 4 3 C7 2 5
Sub-criteria BO OW Sub-criteria BO OW Sub-criteria BO OW
C31 8 2 C41 8 1 C51 2 4 C32 9 1 C42 2 4 C52 5 2 C33 6 2 C43 1 8 C53 1 9 C34 6 2 C44 3 3 C54 3 3 C35 1 9 C45 6 2 C55 9 1 C36 2 4 C37 4 2 Sub-criteria BO OW Sub-criteria BO OW C61 8 9 C71 9 1 C62 1 2 C72 1 9 C63 2 4 C73 5 2 C64 4 3 C74 2 4 C65 5 2 C75 3 3 C66 9 1 C76 4 2 C67 7 2
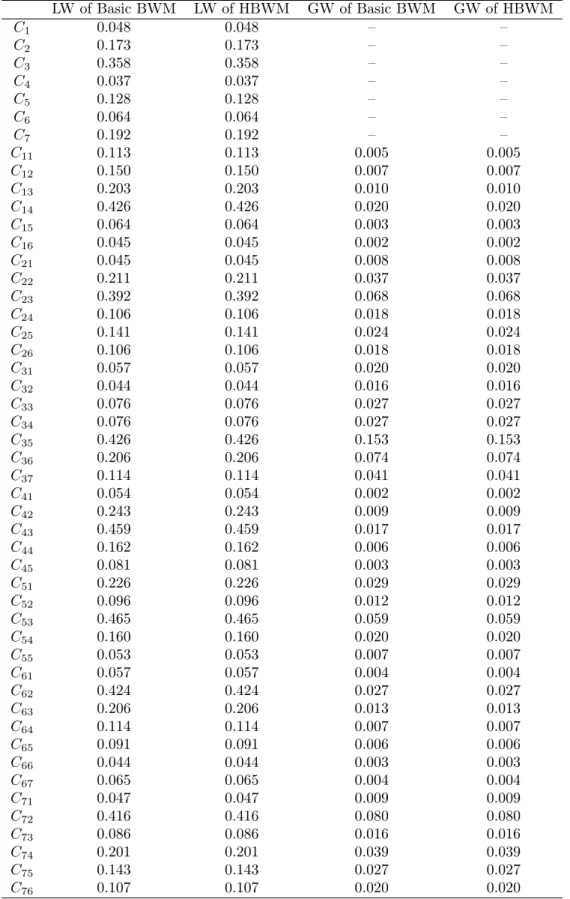
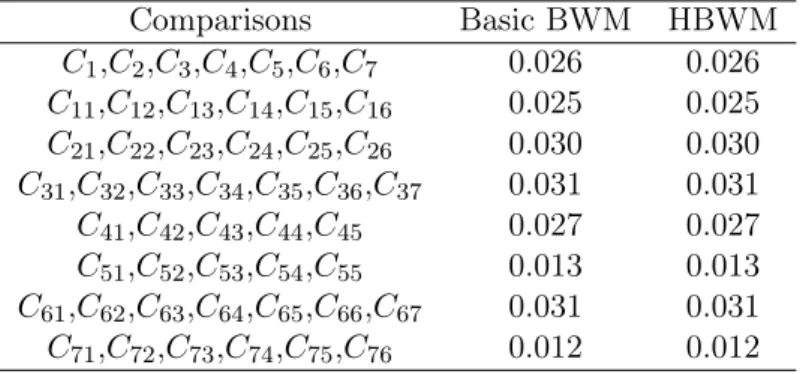
Table 7 shows the results of basic BWM and HBWM for the second numerical example. The results show that the weights obtained for criteria and sub-criteria by HBWM are same as the weights obtained by BWM, while the advantage of HBWM is that it formulates and calculates all necessary parameters in a single integrated model. Also, by comparing the values ofξLandξjLin
both methods as shown in Table 8, no difference is observed between these values. Comparing the results, its observed that the weights for criteria and sub-criteria are not different, but HBWM obtained the results by solving an integrated model while Gupta and Barua [8] solved 8 times the basic BWM to obtain the results. Also, in HBWM there is no need to manually calculate the global weight because it is provided by the model itself.
Table 7: Local weights(LW) and Global weights(GW) for Example2 LW of Basic BWM LW of HBWM GW of Basic BWM GW of HBWM C1 0.048 0.048 – – C2 0.173 0.173 – – C3 0.358 0.358 – – C4 0.037 0.037 – – C5 0.128 0.128 – – C6 0.064 0.064 – – C7 0.192 0.192 – – C11 0.113 0.113 0.005 0.005 C12 0.150 0.150 0.007 0.007 C13 0.203 0.203 0.010 0.010 C14 0.426 0.426 0.020 0.020 C15 0.064 0.064 0.003 0.003 C16 0.045 0.045 0.002 0.002 C21 0.045 0.045 0.008 0.008 C22 0.211 0.211 0.037 0.037 C23 0.392 0.392 0.068 0.068 C24 0.106 0.106 0.018 0.018 C25 0.141 0.141 0.024 0.024 C26 0.106 0.106 0.018 0.018 C31 0.057 0.057 0.020 0.020 C32 0.044 0.044 0.016 0.016 C33 0.076 0.076 0.027 0.027 C34 0.076 0.076 0.027 0.027 C35 0.426 0.426 0.153 0.153 C36 0.206 0.206 0.074 0.074 C37 0.114 0.114 0.041 0.041 C41 0.054 0.054 0.002 0.002 C42 0.243 0.243 0.009 0.009 C43 0.459 0.459 0.017 0.017 C44 0.162 0.162 0.006 0.006 C45 0.081 0.081 0.003 0.003 C51 0.226 0.226 0.029 0.029 C52 0.096 0.096 0.012 0.012 C53 0.465 0.465 0.059 0.059 C54 0.160 0.160 0.020 0.020 C55 0.053 0.053 0.007 0.007 C61 0.057 0.057 0.004 0.004 C62 0.424 0.424 0.027 0.027 C63 0.206 0.206 0.013 0.013 C64 0.114 0.114 0.007 0.007 C65 0.091 0.091 0.006 0.006 C66 0.044 0.044 0.003 0.003 C67 0.065 0.065 0.004 0.004 C71 0.047 0.047 0.009 0.009 C72 0.416 0.416 0.080 0.080 C73 0.086 0.086 0.016 0.016 C74 0.201 0.201 0.039 0.039 C75 0.143 0.143 0.027 0.027 C76 0.107 0.107 0.020 0.020
Table 8: The values of ξL and ξjL for criteria and sub-criteria in Example 2 Comparisons Basic BWM HBWM C1,C2,C3,C4,C5,C6,C7 0.026 0.026 C11,C12,C13,C14,C15,C16 0.025 0.025 C21,C22,C23,C24,C25,C26 0.030 0.030 C31,C32,C33,C34,C35,C36,C37 0.031 0.031 C41,C42,C43,C44,C45 0.027 0.027 C51,C52,C53,C54,C55 0.013 0.013 C61,C62,C63,C64,C65,C66,C67 0.031 0.031 C71,C72,C73,C74,C75,C76 0.012 0.012
5
Conclusion
In this paper, we introduced a new hierarchical MCDM method called HBWM based on the basic BWM. The BWM calculates the weights based on pairwise comparisons of the alternatives with the best and the worst options and achieves consistent results. In this paper, this approach is extended for a situation in which the decision process involves criteria and sub-criteria for evaluating or selecting the alternatives. In order to show that the weights obtained by HBWM are as optimal as the weights obtained in BWM, we used data from two papers that used the basic BWM to obtain the weights of the criteria and sub-criteria. BWM uses (j+ 1) repetitions (wherej represents the number of the criteria) to obtain the optimal weights of the criteria and
sub-criteria, while the HBWM calculates the weights by an integrated model without repetitions. Also, in HBWM there is no need to manually calculate the global weight because it is provided by the model itself. The results of this paper show that HBWM can be useful for situations that require the simultaneous evaluation of criteria and sub-criteria. The proposed method can be used in combination with other MCDM methods or solely. Also this method can be extended to examine the cases in which there are relationships between sub-criteria of two different criteria.
Author contributions. Conflict of interest
The authors contributed equally to this work. The authors declare no conflict of interest.
Bibliography
[1] Aboutorab, H., Saberi, M., Asadabadi, M.R., Hussain, O.,Chang, E. (2018). ZBWM: The Z-number extension of Best Worst Method and its application for supplier development, Expert Systems with Applications, 107, 115-125, 2018.
[2] Badi, I.; Ballem, M. (2018). Supplier selection using the rough BWM-MAIRCA model: A case study in pharmaceutical supplying in Libya, Decision Making: Applications in Man-agement and Engineering, 1(2), 16-33, 2018.
[3] Baky, I.A. (2014). Interactive TOPSIS algorithms for solving level non-linear multi-objective decision-making problems, Applied Mathematical Modelling, 38(4), 1417-1433, 2014.
[4] Ecer, F. (2018). Third-party logistics (3PLs) provider selection via Fuzzy AHP and EDAS integrated model, Technological and Economic Development of Economy, 24(2), 615-634, 2018.
[5] Farias, L.M.S.; Santos, L.C.; Gohr, C.F.; Rocha, L.O. (2019). An ANP-based approach for lean and green performance assessment, Resources, Conservation and Recycling, 143, 77-89, 2019.
[6] Guo, S.; Zhao, H. (2017). Fuzzy best-worst multi-criteria decision-making method and its applications, Knowledge-Based Systems, 121, 23-31, 2017.
[7] Gupta, H.; Barua, M.K. (2016). Identifying enablers of technological innovation for Indian MSMEs using best-worst multi criteria decision making method, Technological Forecasting and Social Change, 107, 69-79, 2016.
[8] Gupta, H.; Barua, M.K. (2017). Supplier selection among SMEs on the basis of their green innovation ability using BWM and fuzzy TOPSIS, Journal of Cleaner Production, 152, 242-258, 2017.
[9] Gupta, P.; Anand, S.; Gupta, H. (2017). Developing a roadmap to overcome barriers to energy efficiency in buildings using best worst method, Sustainable Cities and Society, 31, 244-259, 2017.
[10] Hafezalkotob, A.; Hafezalkotob, A. (2017). A novel approach for combination of individual and group decisions based on fuzzy best-worst method,Applied Soft Computing, 59, 316-325, 2017.
[11] Ilieva, G.; Yankova, T.; Klisarova-Belcheva, S. (2018). Decision analysis with classic and fuzzy EDAS modifications, Computational and Applied Mathematics, 37(5), 5650-5680, 2017.
[12] Jiang, W.; Huang, C. (2018). A multi-criteria decision-making model for evaluating suppliers in green SCM,International Journal of Computers Communications &Control, 13(3), 337-352, 2018.
[13] Khan, M.S.A. (2019). The Pythagorean fuzzy Einstein Choquet integral operators and their application in group decision making, Computational and Applied Mathematics, 38(3), 128, 2019.
[14] Khanmohammadi, E.; Zandieh, M. (2018). Drawing a Strategy Canvas Using the Fuzzy Best-Worst Method,Global Journal of Flexible Systems Management, 20(1), 57-75, 2018. [15] Lei, L.; Zhang, W.F. (2013). Extended VIKOR method for multi-level hybrid multi-attribute
group decision making, 25th Chinese Control & Decision Conference(CCDC), 1718-1722, 2013.
[16] Lu, J.; Han, J.; Hu, Y.; Zhang, G. (2016). Multilevel decision-making: A survey,Information Sciences, 346, 463-487, 2016.
[17] Maghsoodi, A.I.; Mosavat, M.; Hafezalkotob, A.; Hafezalkotob, A. (2019). Hybrid hierarchi-cal fuzzy group decision-making based on information axioms and BWM: Prototype design selection, Computers& Industrial Engineering, 127, 788-804, 2019.
[18] Mardani, A.; Jusoh, A.; Nor, K.; Khalifah, Z.; Zakwan, N.; Valipour, A. (2015). Multiple criteria decision-making techniques and their applications-a review of the literature from 2000 to 2014., Economic Research-Ekonomska IstraĹživanja, 28(1), 516-571, 2015.
[19] Mardani, A.; Jusoh, A.; Zavadskas, E.K. (2015). Fuzzy multiple criteria decision-making techniques and applications-Two decades review from 1994 to 2014, Expert Systems with Applications, 42(8), 4126-4148, 2015.
[20] Mou, Q.; Xu, Z.; Liao, H. (2016). An intuitionistic fuzzy multiplicative best-worst method for multi-criteria group decision making, Information Sciences, 374, 224-239, 2016.
[21] Naz, S.; Akram, M. (2019). Novel decision-making approach based on hesitant fuzzy sets and graph theory,Computational and Applied Mathematics, 38(1), 7, 2019.
[22] Pamucar, D.; Chatterjee, K.; Zavadskas, E.K. (2019). Assessment of third-party logistics provider using multi-criteria decision-making approach based on interval rough numbers, Computers &Industrial Engineering, 127, 383-407, 2019.
[23] Patriarca, R.; Di Gravio, G.; Costantino, F.; Falegnami, A.; Bilotta, F. (2018). An Analytic Framework to Assess Organizational Resilience, Safety and Health at Work, 9(3), 265-276, 2018.
[24] Ren, H.; Liu, M.; Zhou, H. (2019). Extended TODIM method for MADM problem under trapezoidal intuitionistic fuzzy environment, International Journal of Computers Commu-nications &Control, 14(2), 220-232, 2019.
[25] Ren, J.; Liang, H.; Chan, F.T.S. (2017). Urban sewage sludge, sustainability, and transition for Eco-City: Multi-criteria sustainability assessment of technologies based on best-worst method, Technological Forecasting and Social Change, 116, 29-39, 2017.
[26] Rezaei, J. (2015). Best-worst multi-criteria decision-making method,Omega, 53, 49-57, 2015. [27] Rezaei, J. (2016). Best-worst multi-criteria decision-making method: Some properties and
a linear model, Omega, 64, 126-130, 2016.
[28] Rezaei, J.; Wang, J.; Tavasszy, L. (2015). Linking supplier development to supplier seg-mentation using Best-Worst Method, Expert Systems with Applications, 42(23), 9152-9164, 2015.
[29] Saaty, T.L. (1977). A scaling method for priorities in hierarchical structure, Journal of Mathematical Psychology, 15(3), 234-281, 1997.
[30] Saaty, T.L. (1990). How to make a decision: the analytic hierarchy process,European Journal of Operational Research, 48(1), 9-26, 1990.
[31] Saaty, T.L.; Takizawa, M. (1986). Dependence and independence: From linear hierarchies to nonlinear networks, European Journal of Operational Research, 26(2), 229-237, 1986. [32] Safarzadeh, S.; Khansefid, S.; Rasti-barzoki, M. (2018). A group multi-criteria
decision-making based on best-worst method, Computers & Industrial Engineering, 126, 111-121, 2018.
[33] Salimi, N., Rezaei, J. (2016). Measuring efficiency of university-industry Ph. D. projects using best worst method, Scientometrics, 109(3), 1-28, 2016.
[34] Serrai, W.; Abdelli, A.; Mokdad, L.; Hammal, Y. (2017). Towards an efficient and a more accurate web service selection using MCDM methods, Journal of Computational Science, 22, 253-267, 2017.
[35] Sharaf, I.M. (2018). TOPSIS with similarity measure for MADM applied to network selec-tion,Computational and Applied Mathematics, 37(4), 4104-4121, 2018.
[36] Sitorus, F.; Cilliers, J.J.; Brito-Parada, P.R. (2018). Multi-Criteria Decision Making for the Choice Problem in Mining and Mineral Processing: Applications and Trends, Expert Systems with Applications, 121, 393-417, 2018.
[37] Tabatabaei, M.H.; Amiri, M.; Khatami Firouzabadi, S.M.A.; Ghahremanloo, M.; Keshavarz-Ghorabaee, M.; Saparauskas, J. (2019). A new group decision-making model based on bwm and its application to managerial problems, Transformations in Business and Economics, 18(2), 197-214, 2019.
[38] Triantaphyllou, E.; Mann, S.H. (1995). Using the Analytic Hierarchy Process for Decision Making in Engineering Applications: Some Challenges, International Journal of Industrial Engineering: Applications and Practic, 2(1), 35-44, 1995.
[39] Van De Kaa, G.; Scholten, D.; Rezaei, J.; Milchram, C. (2017). The battle between battery and fuel cell powered electric vehicles: A BWM approach, Energies, 10(11), 1707, 2017. [40] Wei, G.; Wang, J. (2017). A comparative study of robust efficiency analysis and Data
Envelopment Analysis with imprecise data, Expert Systems with Applications, 81, 28-38, 2017.
[41] Xu, G.; Wang, S.; Yang, T.; Jiang, W. (2018). A neutrosophic approach based on TOPSIS method to image segmentation, International Journal of Computers Communications & Control, 13(6), 1047-1061, 2018.
[42] You, P.; Guo, S.; Zhao, H.; Zhao, H. (2017). Operation performance evaluation of power grid enterprise using a hybrid BWM-TOPSIS method,Sustainability, 9(12), 2329, 2017. [43] Zak, J.; Kruszynski, M. (2015). Application of AHP and ELECTRE III/IV methods to
multiple level, multiple criteria evaluation of urban transportation projects, Transportation Research Procedia, 10, 820-830, 2015.
[44] Zhao, H.; Guo, S.; Zhao, H. (2018). Comprehensive performance assessment on various battery energy storage systems, Energies, 11(10), 2841, 2018.
[45] Zhao, H.; Zhao, H.; Guo, S. (2018). Comprehensive Performance Evaluation of Electricity Grid Corporations Employing a Novel MCDM Model, Sustainability, 10(7), 2130, 2018.