Florida International University
FIU Digital Commons
FIU Electronic Theses and Dissertations University Graduate School
6-11-2018
Study on Strut and Node Behavior in Strut-and-Tie
Modeling
Nazanin Rezaei
[email protected]DOI:10.25148/etd.FIDC006887
Follow this and additional works at:https://digitalcommons.fiu.edu/etd
Part of theCivil Engineering Commons,Construction Engineering and Management Commons, and theStructural Engineering Commons
This work is brought to you for free and open access by the University Graduate School at FIU Digital Commons. It has been accepted for inclusion in FIU Electronic Theses and Dissertations by an authorized administrator of FIU Digital Commons. For more information, please [email protected].
Recommended Citation
Rezaei, Nazanin, "Study on Strut and Node Behavior in Strut-and-Tie Modeling" (2018).FIU Electronic Theses and Dissertations. 3749.
FLORIDA INTERNATIONAL UNIVERSITY Miami, Florida
STUDY ON STRUT AND NODE BEHAVIOR IN STRUT-AND-TIE MODELING
A dissertation submitted in partial fulfillment of the requirements for the degree of
DOCTOR OF PHILOSOPHY in CIVIL ENGINEERING by Nazanin Rezaei 2018
ii To: Dean John L. Volakis
College of Engineering and Computing
This dissertation, written by Nazanin Rezaei, and entitled Study on Strut and Node Behavior in Strut-and-Tie Modeling, having been approved in respect to style and intellectual content, is referred to you for judgment.
We have read this dissertation and recommend that it be approved.
_______________________________________ Irtishad Ahmad _______________________________________ Atorod Azizinamini _______________________________________ Arindam Gan Chowdhury _______________________________________ Ton-Lo Wang _______________________________________ David Garber, Major Professor
Date of Defense: June 11, 2018
The dissertation of Nazanin Rezaei is approved.
_______________________________________
Dean John L. Volakis College of Engineering and Computing
_______________________________________ Andrés G. Gil Vice President for Research and Economic Development
and Dean of the University Graduate School
iii
© Copyright 2018 by Nazanin Rezaei All rights reserved.
iv DEDICATION
I am extremely grateful to be able to finish this dissertation which is the result of dedicating more than 20 years of my life to education. It is definitely one of the most valuable achievements I have ever had, and I want to dedicate it to the most lovely and respectful people.
I would like to dedicate this dissertation to children all over the world who feel oppressed, defenseless, unsheltered, and voiceless. Girls and boys who need protection, education, and love. I would also like to dedicate it to strong and independent women especially in my home country (Iran), who are struggling day and night for equality, freedom, and human rights. To my parents who taught me to be brave and fearless, faithful to my dreams, and confident to my power. To my beloved sisters, Elham and Elnaz, and my dearest cousin, Fereshteh, for their unconditional love and support from near and from far.
Last, but not least, I want to dedicate this dissertation to researchers who have worked on my area of research, strut-and-tie method. Their studies took me to the edge of human knowledge. I also dedicate this work to all scientists who put their time and effort to push the boundaries of knowledge to make a safe and peaceful world for people. I hope this research would be a small step toward this goal.
v
ACKNOWLEDGMENTS
First and foremost, I would like to express my deepest gratitude to my major professor, Dr. David Garber, who always stood by my side in this difficult path, and helped me with his well-thought-out advices. Without his support, valuable guidance, contribution, and patience, this dissertation would not have been possible.
I would like to thank Gary Klein, one of the most knowledgeable and well-known civil engineers especially in strut-and-tie field, for his valuable advice, and crucial contribution, which made him a backbone of this dissertation. His truly scientific intuition, ideas and passions in science has inspired and nourished my intellectual maturity.
Sincere thanks to the members of my doctoral committee, Dr. Atorod Azizinamini, Dr. Irtishad Ahmad, Dr. Ton-Lo Wang, and Dr. Arindam Gan Chowdhury for their input, valuable discussions, and accessibility.
I also want to acknowledge the help of undergraduate and graduate students at the Titan America Structures and Construction Testing Laboratory of the Florida International University, Lamar Case, Manual Matus, Francisco Chitty, and Dewan Hossain.
Last, but not least, I would like to thank my parents and my sisters (Elham and Elnaz) for their continuous encouragement and unwavering love.
vi
STUDY ON STRUT AND NODE BEHAVIOR IN STRUT-AND-TIE MODELING by
Nazanin Rezaei
Florida International University, 2018 Miami, Florida
Professor David Garber, Major Professor
The strut-and-tie method (STM) is a simple and conservative method for designing concrete structures, especially deep beams. This method expresses complicated stress patterns as a simple truss or kinematic model made up of compression elements (struts), tension elements (ties), and the joints between elements (nodes). STM is based on lower-bound plasticity theorem, so using it properly will lead to a conservative design. Although the concepts of STM have been around in concrete design since the late 19th century, STM was first introduced in AASHTO LRFD in 1994 and ACI 318-02 in 2002. ACI 318 defines two different types of struts (prismatic and bottle-shaped) based on whether compression stress can spread transversely along the length of the strut. Recent work has brought into question whether these two types of struts do exist and whether current design provisions conservatively estimate failure loads for all members.
The performance of struts and nodes were investigated experimentally by testing six full-scale concrete deep beams. The specimens had two different shapes (rectangular and truss-like), two different shear span-to-depth ratio (1 and 1.6), and three different types of development (externally unbonded bars, internally bonded hooked bars, and internally bonded bars with welded external plates). All the specimens were supported vertically and
vii
tested under a three-point load setup. Based on the results, the truss-like specimen failed at higher loads than rectangular specimens with the same shear span-to-depth ratio. According to these results and recent debate in the literature, bottle-shaped struts are not weaker than prismatic struts because of their shape. They are weaker due to shear failure where struts cross a diagonal tension field. Therefore, the structures should be separately checked for shear strength when they are designed with STM. In this dissertation, the development of the design equation for shear strength of discontinuity regions was introduced, and the procedure is under consideration for adoption in ACI 318-19.
This research was expanded numerically by studying the effect of development type and length, strut type, and strut angle on the behavior of concrete deep beams. The crack patterns and load-displacement curves, which were obtained from experimental tests, were used to validate numerical models. The strength of concrete deep beams was assessed by modeling thirty-five specimens in a nonlinear finite element software. According to the results, development length and development types influenced the presence of tensile stress in the support nodes. Additionally, the effect of the tensile stresses from reinforcement development and diagonal tension were not additive in rectangular specimens.
viii TABLE OF CONTENTS CHAPTER PAGE Chapter 1 : Introduction ...1 1.1 Overview ... 1 1.2 Project Objective ... 2 1.3 Project Scope ... 3 1.4 Thesis Organization... 3
Chapter 2 : Background of Strut-and-Tie Method ...6
2.1 Overview ... 6
2.2 Discontinuity Regions of Deep Beams ... 6
2.3 Theoretical Background of Strut-and-Tie Modeling ... 9
2.3.1 Struts ... 11 2.3.2 Ties ... 13 2.3.3 Nodal Zones ... 14 2.4 Strut Behavior ... 16 2.4.1 Vertically-Oriented Struts ... 17 2.4.2 Inclined Struts ... 22
2.4.3 Angle of Strut Inclination ... 24
2.5 Tie Behavior ... 25
2.6 Node Behavior... 28
2.7 STM Design Provisions ... 32
2.7.1 ACI 318-14 Building Code [3] ... 32
2.7.2 AASHTO LRFD Bridge Design Specification [19] ... 34
2.8 Summary ... 36
Chapter 3 : Loading Test Setup ...38
3.1 Overview ... 38
3.2 Loading Setup Details ... 38
3.3 Assembly and Disassembly ... 41
3.4 Load and Support Conditions ... 44
ix
3.6 Data Acquisition System ... 47
3.7 Recommendations for Future Use ... 48
Chapter 4 : Strut Strength and Failure in Full-Scale Concrete Deep Beams ...49
4.1 Abstract ... 49
4.2 Introduction ... 50
4.3 Research Significance ... 53
4.4 Experimental Program... 54
4.4.1 Specimen Geometry and Design ... 54
4.4.2 Material ... 58
4.5 Set up, Instrumentation, and Testing Procedure ... 58
4.5.1 Loading Protocol ... 59
4.5.2 Instrumentation ... 60
4.6 Experimental Results and Discussion ... 61
4.6.1 Crack Patterns ... 61
4.6.2 Observed Failure Modes ... 62
4.6.3 Low-Cycle Fatigue of Internally Reinforced Rectangular Specimen ... 65
4.6.4 Analysis of Test Results and Discussion ... 66
4.7 Comparison with Current STM Estimates ... 72
4.8 Summary and Conclusions ... 75
4.9 Acknowledgements ... 77
4.10 Appendix ... 77
Chapter 5 : Effect of Development and Beam Geometry on Behavior of Concrete Deep Beams ...79
5.1 Abstract ... 79
5.2 Introduction ... 80
5.3 Research Significance ... 82
5.4 Experimental Program... 83
5.4.1 Specimen Geometry and Design ... 83
5.4.2 Material ... 86
5.4.3 Loading Setup ... 86
5.4.4 Loading Protocol ... 87
x
5.5 Numerical Program ... 88
5.5.1 Modeling Parameters ... 88
5.5.2 Model Validation ... 91
5.5.3 Numerical Specimen Details... 94
5.6 Results and Discussion ... 98
5.6.1 Summary of Results ... 98
5.6.2 Effect of Development Length ... 99
5.6.3 Effect of Type of Development ... 101
5.6.4 Effect of Beam Type ... 103
5.6.5 Effect of Strut Angle ... 105
5.7 Summary and Conclusions ... 106
5.8 Acknowledgments ... 108
5.9 Appendix A ... 108
Chapter 6 : Shear in Discontinuity Regions ...109
6.1 Abstract ... 109
6.2 Introduction ... 110
6.3 Strength of Struts ... 111
6.3.1 Bottle-shaped Struts ... 111
6.3.2 Strut Strength Coefficients ... 113
6.3.3 Experimental Study ... 115
6.4 Shear Strength of D-Regions... 118
6.4.1 Shear Span ... 119
6.4.2 Size Effect and Lightweight Concrete Factors ... 120
6.4.3 Reinforcement Ratio ... 121
6.5 Conclusions and Recommendations... 122
6.5.1 Conclusions ... 122
6.5.2 Recommendations ... 123
6.6 Acknowledgements ... 124
Chapter 7 : Summary, Conclusions, and Recommendations ...125
7.1 Summary and Conclusions ... 125
xi
7.1.2 Numerical Study ... 126
7.1.3 Design Recommendations ... 127
7.2 Recommendations for Future Work ... 129
References………130
Appendix………..………137
xii
LIST OF TABLES
TABLE PAGE
Table 2-1: test results of deep beams in Sahoo et al. [7] ...23
Table 2-2: Strut and node coefficients ... 34
Table 2-3: Concrete efficiency factor (v), if minimum crack-control reinforcement is provided ... 36
Table 3-1: Hydrulic jack details ... 46
Table 3-2: Calibration detail for load cells ... 47
Table 4-1: Test Matrix ... 54
Table 4-2: Concrete mix design ... 58
Table 4-3: Measured and Estimated Failure Loads ... 73
Table 4-4: Predicted versus observed failure modes ... 75
Table 5-1: Details of experimental test specimens (“(E)” subscript identifies experimental tests) ...84
Table 5-2: Concrete mix design ... 86
Table 5-3: Summary of Concrete Material Properties ... 90
Table 5-4: Summary of the numerical specimen details and results ... 94
Table 5-5: Summary of the numerical specimen details and results for different strut angle and 0 in. (0 mm) overhang length ... 97
Table 5-6: Summary of failure loads for all beams with 45-degree strut angle in numerical investigation (underlined* number indicates sufficient development length estimated using ACI 318-14) ... 99
Table 6-1: Specimen details and test results ... 115
Table B.1: Material properties used in STM calculations ... 141
xiii
Table B.2: Summary of loads required to cause failure in different componenet of strut-and-tie model ... 156 Table B.3: Concrete efficiency factor (v), if minimum crack-control reinforcement is provided ... 158 Table B.2: Summary of loads required to cause failure in different componenet of strut-and-tie model ... 166
xiv
LIST OF FIGURES
FIGURE PAGE Figure 2-1: (a) Simply-supported beam with uniform loading, (b) typical cross-section of reinforced concrete beam, and (c) linear strain distribution across depth of
cross-section ... 7
Figure 2-2: Examples of deep beam members: (a) hammerhead cap, (b) bent cap, (c) ledged members like corbels and inverted-tee beams, (d) coupling beams, and (e) pile caps ... 8
Figure 2-3: Stress trajectories in B- and D-regions ( adapted from Birrcher et al. 2009) ... 9
Figure 2-4: Stress trajectories within D-region in simply supported concrete deep beam ... 10
Figure 2-5: Strut-and-tie model: simply supported deep beam supporting a concentrated load ... 11
Figure 2-6: Strut-and-tie model with truss elements: prismatic and bottle-shaped struts ... 12
Figure 2-7: Assumed stress flow in (a) bottle-shaped and (b) prismatic struts according to ACI 318-14 ... 13
Figure 2-8: Tie reinforcement provided at the location of tension ties ... 14
Figure 2-9: Type of the nodes in simple supported deep beam ... 15
Figure 2-10: Non-hydrostatic nodes versus hydrostatic node... 16
Figure 2-11: Testing of isolated strut specimen and the variables [5] ... 17
Figure 2-12: Bottle-shaped strut in concrete panels [21] ... 18
Figure 2-13: Different failure in bottle-shaped struts: (a) non-reinforced specimens, (b) typical failure, and (c) failure in nodal zone [22] ... 19
Figure 2-14: Specimens tested in (a) Sahoo et al. [7] (b) Pujol et al. [8] (c) Laughery and Pujol [9] (d) Adebar and Zhou [26] ... 20
xv
Figure 2-15: Mean experimental efficiency factors across various studies for selected
W/B [9] ... 22
Figure 2-16: the detail of tested deep beams in Sahoo et al. [7] ... 23
Figure 2-17: Beam and truss model tested by Beeby [29] ... 24
Figure 2-18: Comparison of the code provisions with the proposed efficiency factor models for normal-weight concrete of 5.8 ksi (40MPa) [34] ... 25
Figure 2-19: Development length of a tie [4] ... 26
Figure 2-20: Geometry of CCC node... 29
Figure 2-21: Details of CCC node (Node 1 from above)... 30
Figure 2-22: Geometry of CCT node ... 31
Figure 3-1: Available tie-downs in the Structures Laboratory ... 39
Figure 3-2: The steps of loading set-up and specimen installation ... 40
Figure 3-3: installing the first rods in the ground ... 41
Figure 3-4: installing rods to connect the beams ... 42
Figure 3-5: Assembling specimens with load and support conditions ... 43
Figure 3-6: failure in specimen with deficiency in Gypsum ... 45
Figure 3-7: Dimensions of 250-kip capacity load cells: (a) top and (b) side ... 46
Figure 4-1: (a) specimens for Pujol et al. [8] tests and (b) specimens for Sahoo et al. [7] tests. ... 52
Figure 4-2: Geometry of the specimens: (a) rectangular specimen with unbonded reinforcement, (b) truss-like specimen with unbonded reinforcement, and (c) rectangular specimen with bonded reinforcement. ... 56
Figure 4-3: Specimens with external unbonded: (a) rectangular and (b) truss-like; and with (c) internal bonded reinforcement (figure has transparent specimen to show internal reinforcement)... 57
xvi
Figure 4-5: Location of instrumentation ... 61 Figure 4-6: Crack pattern for (a) unbonded (Re-45-Ex) and (b) bonded (Re-45-In) specimens ... 62 Figure 4-7: Before, during, and after failure for five tests ... 64 Figure 4-8: (a) Load-displacement curve for bonded specimen and (b) curve relating number of cycles to failure to ultimate strength (ACI 215, 1992) (1 kip = 4.44 kN), (1 in=25.4 mm) ... 66 Figure 4-9: Load versus displacement curve for unbonded specimens with (a) 30-degree and (b) 45-30-degree strut angles (1 kip = 4.44 kN) , (1 in=25.4 mm) ... 67 Figure 4-10: Summary of the experimental failure loads (a) normalized based on strut stress and (b) normalized based on shear stress ... 68 Figure 4-11: Failure modes of rectangular versus truss specimens ... 70 Figure 4-12: (a) Load versus longitudinal strain curve and (b) strain versus distance curve at 0.9Pmax for Re-45-Ex and (c) Load versus strain curve and (d) strain versus distance curve at 0.9Pmax for Tr-45-Ex (1 kip = 4.44 kN). ... 71 Figure 4-13: Load versus perpendicular strut strain for (a) Re-30-Ex and (b) Tr-30-Ex (1 kip = 4.44 kN). ... 72 Figure 4-14: Measured strength divided by estimated strength using ACI 318-14 [3] and AASHTO LRFD [19]. ... 74 Figure 5-1: Description of strut-and-tie model with ACI 318-14 [3] strut definitions ... 82 Figure 5-2: Typical specimens geometry for beam series (a) H, (b) EP, (c) Re-S, (d) Re-ExU, (e) Tr-ExU, (f) Re-EP, where ℓ2 is overhang length and h is 8.5 inches (215 mm) ... 85 Figure 5-3: The steps of loading setup and specimen installation ... 87 Figure 5-4: Re(E)-H-0 (a) before loading, (b) during loading, (c) after failure ... 88 Figure 5-5: (a) Tensile stress-strain curve for concrete with stages of crack opening, and (b) exponential crack opening law, adapted from [60] ... 89 Figure 5-6: Comparing load-displacement results from experimental and numerical outputs (a) Re-H-0, (b) Re-ExU-0, (c) Tr-ExU-0, and (d) Re-EP-9.5 ... 92
xvii
Figure 5-7: Actual and predicted crack patterns in Re-H-0 ... 93
Figure 5-8: Failure load versus overhang length ... 100
Figure 5-9: Load versus deflection curves for rectangular beams with fully developed longitudinal reinforcement ... 102
Figure 5-10: FE model for (a) Tr-EP-0 at 20 percent of Pmax, (b) Tr-ExU-0 at 20 percent of Pmax (c) EP-0 at 50 percent of Pmax, (d) ExU-0 at 50 percent of Pmax, (e) Tr-EP-0 after failure and (f) Tr-ExU-0 after failure ... 103
Figure 5-11: Summary of the numerical failure loads versus specimens ... 104
Figure 5-12: Normalized strut stress versus series ... 106
Figure 6-1: Illustrations of (a) rectangular prismatic strut, (b) 2-D rectangular bottle strut, and (c) 3-D rectangular bottle strut. After Laughery and Pujol ... 112
Figure 6-2: Example of stress flow in a deep beam ... 113
Figure 6-3: Vtest / Vcalc versus f’c (Vcalc in accordance with the strut-and-tie method in ACI 318-14) ... 114
Figure 6-4: Schematic of test setup and specimen with supports (truss-like specimen shown) ... 116
Figure 6-5: Failure crack pattern and image of instant of failure: Specimen Re-45-Ex . 118 Figure 6-6: Transfer girder at an offset in the column grid ... 119
Figure 6-7: Shear stress vc vs ratio of shear span to effective depth, av /d ... 120
Figure A-1: Construction drawings for beams B-1 and B-2 ... 138
Figure A-2: Construction drawings for B-3, node beams, loading and support plates .. 139
Figure B-1: Re-45-Ex specimen ... 140
Figure B-2: Dimensions for Re-45-Ex: (a) elevation and (b) cross-section ... 141
Figure B-3: Strut-and-tie model used for Re-45-Ex ... 142
Figure B-4: Distance between nodes C and D for Re-45-Ex ... 143
xviii
Figure B-6: Reaction node (Nodes A and B): (a) faces and (b) dimensions ... 152
Figure C-1: CR6 with detail of wiring panel ... 170
Figure C-2: (a) CDM-VW 305 and (b) CDM-A116 ... 173
Figure C-3: Sensors and devices window in LoggerNet software ... 175
Figure C-4: Wiring diagram in LoggerNet software ... 176
Figure C-5: Output window in LoggerNet software ... 177
Figure C-6: Finish window in LoggerNet software ... 178
Figure C-7: Device Configuration Utility (DevConfig) ... 179
1
Chapter 1: Introduction 1.1 Overview
Axial and bending stresses will cause a stress distribution across the section depth of concrete members. The Bernoulli hypothesis that plane sections remain plane is usually assumed for these sections, which assumes that strains vary linearly across the depth of the section. Regions where strains actually vary linearly across the depth (i.e. where the Bernoulli hypothesis is accurate) are considered as Bernoulli or beam regions (also called B-regions), which can be designed using typical sectional design approaches (e.g. rectangular stress block approach for determining nominal moment strength).
Strains do not always vary linearly across the depth of a section. Disturbed or discontinuity regions (D-regions) are regions where stresses vary nonlinearly across the depth. D-regions are typically found within a distance d (distance from the compression face to centroid of the tension steel) of concentrated point loads, supports, or geometric discontinuity. Some examples of members with D-regions are transfer girders, pile supported foundations, and bridge bents.
Typical sectional design approaches are not valid in D-regions. Empirically derived design expressions were traditionally used in these regions before the introduction of the strut-and-tie method (STM) into design codes and specifications toward the end of the 20th century (1994 for AASHTO LRFD [1] and 2002 in ACI 318-02 [2]). STM involves modeling the stress flow through a structure using a hypothetical truss or kinematic model. Compression members in the truss are called struts, tension members are ties, and the joints are nodes. When designing using STM, sufficient reinforcement must be provided to resist
2
the forces of the tension ties and struts must have sufficient strength to carry the compression forces.
ACI 318-14 [3] defines two types of struts, prismatic and bottle-shaped, based on the geometry and the location of the struts in the structure. Bottle-shaped struts are struts where stresses can spread transversely along their length, i.e. they have a larger width and area at the mid-length of the strut than at its ends. As mentioned by many researchers ([4]–[6]), the lateral spreading in theses struts creates tensile stresses transverse to the strut, which must be resisted by minimum strut reinforcement. Prismatic struts have a uniform section along their length, either because of geometric discontinuities or from bordering tension regions (e.g. region below the rectangular stress block in bending).
The current design philosophy [3] suggests that bottle-shaped struts are weaker than prismatic struts. There has been recent research that has suggested otherwise [7]–[9]. A thorough review of the literature indicated that few studies have focused on the effect of struts on the strength and behavior of deep beams.
1.2 Project Objective
The primary objective of this research was to further investigate the behavior of struts in concrete deep beams. The experimental and numerical studies were designed to investigate the effect of the strut type (prismatic versus bottle-shaped), strut angle (30o, 45o, 60o), and presence of bonded tensile reinforcement on the strength and behavior of struts in concrete deep beams. The conservatism and accuracy of the current ACI 318 STM provisions were assessed and recommendations for the improved estimation of strut strength were made.
3
1.3 Project Scope
The above objectives were achieved through the following primary tasks:
• Literature Review: Conduct a literature review to indicate the current state of knowledge on strut behavior and design in concrete deep beams.
• Test Setup Design: Design, fabrication, and installation of three-point loading setup with 800-kip capacity to test constructed deep beams.
• Experimental Testing: Full-scale experimental testing of concrete deep beams with different geometries (rectangular and truss-like), strut angle (30o and 45o), and presence of bonded and unbonded reinforcement.
• Numerical Study: Numerical investigation of concrete deep beams using non-linear finite element software specifically calibrated for concrete structures with the purpose of further investigating the behavior of struts. Additionally strut angles (60o) and reinforcement development types and lengths were investigated to further understand the effect of resulting tension fields on strut behavior.
• Design Recommendations: Make a recommendation for ACI 318 and AASHTO provisions based on findings.
1.4 Thesis Organization
This dissertation is written based on the format of ‘Thesis Containing Journal Papers’. The dissertation includes three manuscripts for scholarly journals and magazine, of which all are under review. Additional chapters are provided to complete the dissertation and summarize work not adequately captured in the three journal papers. The organization is as follows:
4
• Chapter 2 – Background of STM: This chapter introduces STM and a summary of the relevant literature and previous research results.
• Chapter 3 – Loading Test Setup: This chapter contains an overview of the design of the 800-kip test setup that was designed for this research.
• Chapter 4 – “Strut Strength and Failure in Full-Scale Concrete Deep Beams” (submitted to ACI Structural Journal) [10]: This paper discusses results from full-scale testing conducted at FIU. It includes the experimental results of five full-full-scale concrete deep beams: three rectangular and two truss-like specimens with the shear span-to-effective depth ratio (a/d) of 1 (45 degree) and 1.6 (30 degree).
• Chapter 5 – “Effect of Development and Beam Geometry on Behavior of Concrete Deep Beams” (submitted to ACI Structural Journal ) [11]: The second paper is an extension of the first paper, including additional experimental results for one additional experimental specimens, the validation of numerical models, and results for numerical modeling of an additional 35 specimens. The specimens were modeled to investigate the effect of development length, development type, strut type, and strut angle on the behavior of nodal zones in discontinuity regions. • Chapter 6 – “Shear in Discontinuity Regions” (submitted to Concrete
International) [12]: The final paper is the answer of why STM can be unconservative for so-called bottle-shaped struts, despite already low strut efficiency factors. This paper includes suggestions to use interior strut instead of bottle-shaped strut, and edge struts instead of prismatic struts. Interior struts are weaker than edge struts because interior struts cross a diagonal tension field and the sections fails in shear. The developed design equations for shear strength of
5
discontinuity are proposed based on shear span, section depth, and lightweight concrete and is under consideration for inclusion in ACI 318-19.
A conclusions section is then provided to summarize conclusions from all the three papers and propose recommended future work.
6
Chapter 2: Background of Strut-and-Tie Method 2.1 Overview
This chapter includes an overview of the theoretical background of the strut-and-tie method (STM). The current state of knowledge of the behavior of struts, ties, and nodes is summarized with an expanded discussion on struts, since this is the focus of this dissertation. A summary of two of STM provisions primarily used in the US (ACI 318-14 and AASHTO LRFD Bridge Design Specification) is also provided.
2.2 Discontinuity Regions of Deep Beams
As previously introduced, applied loads and moments will cause stresses in members. These stresses vary across the section depth. According to the Bernoulli hypothesis and traditional beam theory, the strain distribution is assumed to vary linearly across the depth of the section (i.e. plane sections remain plane). Assuming a linear strain profile across the depth of a section allows for the derivation of traditional sectional behavior and design expressions. Regions where plane sections remain plane are called Bernoulli or beam regions (B-regions) and can be designed using traditional sectional design approaches. An example of a beam designed using conventional sectional design approaches is shown in Figure 2-1. As mentioned, a linear strain distribution is assumed across the cross-section depth, as shown in Figure 2-1 (c).
7
Figure 2-1: (a) Simply-supported beam with uniform loading, (b) typical cross-section of reinforced concrete beam, and (c) linear strain distribution across depth of cross-section
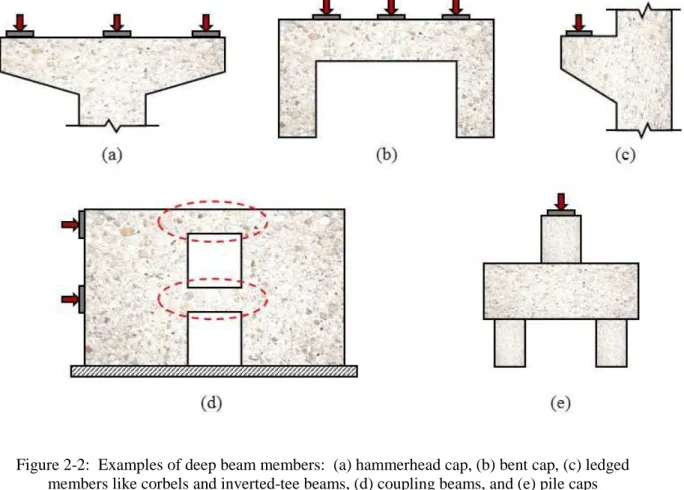
Strains do not always vary linearly across the depth of a section. Disturbed or discontinuity regions (D-regions) are regions where stresses vary nonlinearly across the depth. D-regions are typically found within a distance d (distance from the compression face to centroid of the tension steel) of concentrated point loads, supports, or geometric discontinuity. Some examples of members with D-regions are shown in Figure 2-2 and include: hammerhead pier caps, bent caps, ledged members like corbels and inverted-tee beams, coupling beams between shear walls, and pile caps.
8
Figure 2-2: Examples of deep beam members: (a) hammerhead cap, (b) bent cap, (c) ledged members like corbels and inverted-tee beams, (d) coupling beams, and (e) pile caps
The principle compression and tension strain diagram for a simply-supported beam with a point load placed toward one support is shown in Figure 2-3. Saint-Venant’s principle allows for the strain diagram to be simplified as linear further from the load points, allowing for sectional approaches to be valid [13]. Strains do vary non-linearly across the section depth within a distance d from the load and support points, so these regions are considered D-regions. The shear span (a) is also highlighted in this figure.
The shear span is the distance from the point load to the support point. Another means for determining whether a region is a D-region is by looking at the shear span-to-depth (a/d) ratio. Shear span-to-depth ratios less than 2 to 2.5 signify regions are D-regions; a limit of 2.0 is used in ACI 318-14 [3].
9
Figure 2-3: Stress trajectories in B- and D-regions ( adapted from Birrcher et al. 2009)
Since these regions do not satisfy the Bernoulli hypothesis (i.e. plane sections do not remain plane), sectional analysis and design procedures are not valid in D-regions. Therefore, designers use empirically derived design methods or STM. The empirically derived methods are typically specific to certain member types for specific applications (e.g. ledges in inverted-tee members). On the other hand, STM is a reasonable and versatile method to safely design all deep beams (and non-deep beams if desired).
2.3 Theoretical Background of Strut-and-Tie Modeling
As mentioned in the previous section, strains are distributed nonlinearly within D-regions. The principle tensile and compression strain trajectories in a simply-supported beam with a single point load are shown in Figure 2-4. STM allows for this complex state of stresses in the specimen to be simplified with a collection of uniaxial force elements in a truss or kinematic model, as shown in Figure 2-5. This model includes compression members (struts), tension elements (ties), and the intersection of struts and ties (nodes). STM is a lower-bound plasticity theorem, so as long as equilibrium is satisfied (i.e. forces in these elements are in equilibrium with the external forces) and the distribution of forces are
2
D- Region B- Region
D- Region
Principle tensile strain trajectory Principle compression strain trajectory
10
compatible with the concrete deformation capacity, using STM will lead to a conservative design [14].
Figure 2-4: Stress trajectories within D-region in simply supported concrete deep beam
To design a member using this method, one must ensure several things:
• Sufficient Tie Reinforcement: Sufficient reinforcement must be placed at the location of the tension ties to resist the tension force in the tie.
• Adequate Concrete Strength in Struts and Nodes: Enough concrete strength and member area must be provided in the struts, strut-to-node interfaces, and other node faces to resist the strut and node forces.
• Proper Detailing: Tie reinforcement must be properly anchored to develop the required tie force and other reinforcement must be provided so that the member has
D- Region
Principle tensile strain trajectory Principle compression strain trajectory
11
the deformation capacity to properly distribute the forces. Improper detailing can lead to lower capacities than desired [15].
There are many resources available to help engineers to design structures in discontinuity regions using STM [16], [17].
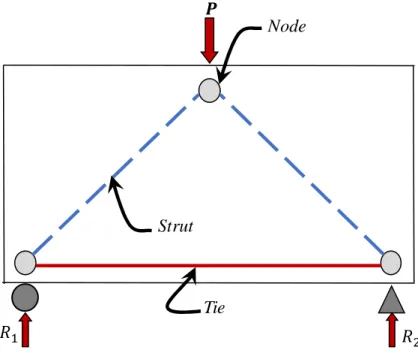
Figure 2-5: Strut-and-tie model: simply supported deep beam supporting a concentrated load
2.3.1 Struts
The compression elements in a strut-and-tie model are called struts and are typically represented by a blue dotted line, as shown in Figure 2-5. Current ACI 318-14 [3] STM provisions assume that there are two different types of struts based on geometry and tensile stresses: bottle-shaped struts and prismatic struts, shown in Figure 2-6. Bottle-shaped struts have minimum sectional area at the ends of the strut and maximum cross-sectional area in the mid-length. The spreading of compression stress in bottle-shaped struts is thought to develop transverse tensile stress, as shown in Figure 2-7 (a). This transverse
Node
Tie Strut
12
tensile stress is resisted by the minimum strut reinforcement, according to ACI 318-14 [3].
Figure 2-6: Strut-and-tie model with truss elements: prismatic and bottle-shaped struts
Struts located in regions where stresses are not able to spread (i.e. having a uniform section along the length of the strut) are currently called prismatic struts. The prismatic strut shown in Figure 2-6 is formed by the bordering tensile stress region caused by bending. A prismatic strut has only unilateral compression stresses, as shown in Figure 2-7, and no transverse tensile stresses. Because there are no transverse tensile stresses, prismatic struts are thought to be stronger than bottle-shaped struts.
P P Nodal Zone Nodal Zone Bottle-Shaped Strut Prismatic Strut Tie P P Idealized Prismatic Strut
13
Figure 2-7: Assumed stress flow in (a) bottle-shaped and (b) prismatic struts according to ACI 318-14
2.3.2 Ties
The tension elements in a strut-and-tie model are called ties and are typically represented by a solid black line, as shown in Figure 2-5. Reinforcement must be provided to resist the tensile force of a tie element, as shown in Figure 2-6 and Figure 2-8. The tie element is located at the centroid of the reinforcement. Tie reinforcement must be fully developed by the time the reinforcement leaves the extended nodal zone.
Transverse Tension P P P P Unilateral Compression (a) (b)
14
Figure 2-8: Tie reinforcement provided at the location of tension ties
2.3.3 Nodal Zones
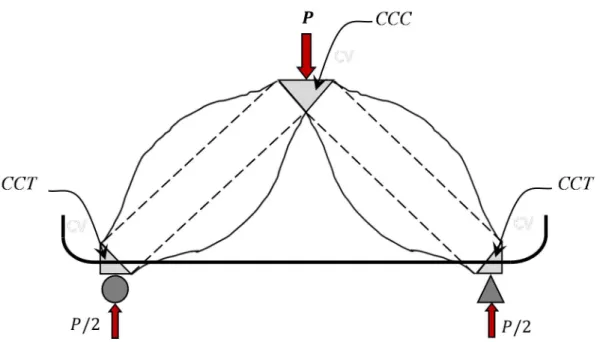
The intersection of struts and ties are called nodes, as shown in Figure 2-5. Like struts, nodes will have a three-dimensional shape dependent on the intersecting element dimensions. This region formed by the intersecting elements is called a nodal zone. These zones are critical to the behavior of the whole system, because they are typically the most highly stressed regions member. Nodal zones are generally named based on the type of the elements (compression or tension) connected in nodes, where “C” represents intersecting compression elements and “T” represents tension elements. Nodes with only struts intersecting are CCC nodes. Nodes having a tie only in one direction are CCT nodes. If the node has ties intersect in two different directions, it is a CTT node. Since the type of the node governs the behavior and strength of the specimen, the type of the node is determined in the design process. The types of nodes for the abovementioned beam are highlighted in
15 Figure 2-9.
Figure 2-9: Type of the nodes in simple supported deep beam
Nodes can also be defined based on the presence of shear stresses in the nodal zone. A hydrostatic node is a node with equal stresses on all faces of the node, as shown in Figure 2-10 (b). These types of nodes are thought to have no shear stresses developing in the nodal zone, since principal stresses are equal on all side faces. In hydrostatic nodes, the ratio of the area of the side face is proportional to the applied load. Nodes with different stresses on different faces of the node are called non-hydrostatic nodes, as shown in Figure 2-10 (a) and (c). Shear stresses occur in the nodal zone of these nodes. Proportioning techniques and a further discussion on the use of hydrostatic and non-hydrostatic nodes are found in Birrcher et al. [4].
16
Figure 2-10: Non-hydrostatic nodes versus hydrostatic node
2.4 Strut Behavior
Struts are the compressive elements in strut-and-tie modeling. As mentioned above, ACI 318-14 [3] currently divides struts in two types (prismatic and bottle-shaped) based on the ability for stress to spread perpendicular to the strut axis. Previous research related to the behavior of struts and the validity of this assumption is summarized in this section.
(a) (b) (c) non-hydrostatic node hydrostatic node non-hydrostatic node
17
2.4.1 Vertically-Oriented Struts
One way of investigating the behavior of struts is to test vertically-oriented panels of different dimensions in unilateral compression. Brown et al. [5] investigated the performance of “bottle-shaped” struts by testing 26 vertical concrete panels with different variables including: web reinforcement size, location and angle; specimen dimensions; bearing area dimensions; and concrete compressive strength. One of the specimens in the loading setup is shown in Figure 2-11.
Figure 2-11: Testing of isolated strut specimen and the variables [5]
The same failure mode was observed in all the specimens: crushing of the strut-to-node interface. There were no significant differences between the failure mode or failure load of the most heavily reinforced and unreinforced specimens. Results were compared with estimates from ACI 318-05 [18] and AASHTO LRFD [19] to evaluate the efficiency factor for node and strut strength and reinforcement requirements. Estimates were found to be conservative and erratic using ACI 318-05 [18] and more consistent but less conservative
18
using AASHTO LRFD [19]. Brown and Bayrak [20] later concluded that adequate reinforcement must be located within the struts because of the transverse tension that develops in bottle-shaped struts.
Sahoo et al. [21] also investigated vertically-oriented panels through an analytical study. They also presented that the bottle-shaped struts formed when the load was applied to the small area compared to the dimension of the whole specimen. Their research investigated the effect of aspect ratio on the behavior of bottle-shaped struts. One of their specimens with an aspect ratio of 2.0 is shown in Figure 2-12.
Figure 2-12: Bottle-shaped strut in concrete panels [21]
Ghanei and Aghayari [22] also tested vertically-oriented concrete panels with different dimensions and reinforcement; the failure of three of these panels is shown in Figure 2-13.
Bearing Plate
Isostatic lines of compression
19
Unreinforced specimens, shown in Figure 2-13 (a), typically failed when an initially formed crack in the middle led to the specimen splitting in half. Specimens with typical amounts of shear reinforcement, shown in Figure 2-13 (b), had both an initial crack down the center of the specimen and secondary cracks developing toward the edges. Failure of these occurred when concrete crushed at the support or load points. Heavily reinforced specimens, shown in Figure 2-13 (c), had minimal cracking during loading and failed due to crushing of concrete at the support or load points.
Figure 2-13: Different failure in bottle-shaped struts: (a) non-reinforced specimens, (b) typical failure, and (c) failure in nodal zone [22]
The authors of these studies all concluded that the stress can spread outward in bottle-shaped struts, which will create transverse tensile stress. Because concrete is weaker in tension than compression, the bottle-shaped struts are weaker than prismatic one. This idea was suggested in several other studies [23]–[25].
Several additional research efforts were conducted on vertically-oriented struts with varying widths and exactly the same support and loading conditions [7]–[9], [26]. A
20
summary of the specimen geometry for all of these research efforts is provided in Figure 2-14. Note that all specimens were rectangular except those tested by Adebar and Zhou [26], which were circular. Also, the specimen depth was equal to the bearing width (b) in all tests.
Figure 2-14: Specimens tested in (a) Sahoo et al. [7] (b) Pujol et al. [8] (c) Laughery and Pujol [9] (d) Adebar and Zhou [26]
Sahoo et al. [7] tested seven unreinforced vertically-oriented struts with varying widths, as shown in Figure 2-14 (a) and found all specimen widths to have about the same strength. Generally, specimens started to crack in the middle of the specimens and then the crack propagated towards the top and bottom plates.
6 (a) (b) 4 (c) (d) . 6 b Circular 3 4
21
Pujol et al. [8] tested 42 unreinforced specimens categorized in three series with dimensions shown in Figure 2-14 (b). Series 1 specimens included rectangular specimens with two widths (b and 2b) and irregular hexagonal-shaped specimens with one width at mid-height (2b), all specimens had similar strength. Series 2 specimens were all rectangular with widths varying from b to 4b. There was not a significant difference in strength between the specimens with widths of b and 2b, but there was a slight drop in strength for specimens with widths of 3b and 4b. Series 3 was like Series 2 except with a higher water-to-cement ratio. There was no difference in strength between any of the specimen widths (b to 4b) in this series.
Laughery and Pujol [9] conducted similar testing on 32 additional unreinforced strut specimens, shown in Figure 2-14 (c). They combined their results with results from several previous studies [5], [7], [8], [26], [27], as shown in Figure 2-15. This graph includes results for struts with equal section and bearing depths (called “2-D Dispersion” in Figure 2-15) and struts with section depths greater than the bearing depth (called “3-D Dispersion” in Figure 2-15). Stresses in sections with 2-D dispersion can only spread in one direction transverse to the strut axis. Stresses in sections with 3-D dispersion can spread in two directions transverse to strut axis. There is little difference in strut efficiency for specimens with 2-D dispersion with various aspect ratios. There is a significant difference in strength between specimens with 3-D dispersion and varying aspect ratios, shown in the results of Adebar and Zhou [26].
22
Figure 2-15: Mean experimental efficiency factors across various studies for selected W/B [9]
2.4.2 Inclined Struts
While vertically-oriented idealized struts may be the simplest to test, they do not accurately represent the behavior of inclined struts. Sahoo et al. [7] understood the need for testing inclined struts and expanded their vertical-oriented strut testing to include two unreinforced deep beam specimens. The width, height, and depth of the specimens were 39.37 inches (1000 mm), 17.71 inches (450 mm), and 3.94 inches (10 mm), respectively. The details of these specimens are shown in Figure 2-16.
23
Figure 2-16: the detail of tested deep beams in Sahoo et al. [7]
The compressive strength of concrete, failure load, and the calculated efficiency factor for Sahoo et al. [7] tests are presented in Table 2-1. Sahoo et al. [7] found strut efficiency factors similar to those found through their vertically-oriented strut tests.
Table 2-1: test results of deep beams in Sahoo et al. [7]
Specimen ID Cylinder Compressive strength, ksi (MPa)
Peak Load, kips (kN) Experimental Strut Efficiency Factor BN-0-0 36.6 (5.74) 429.2 (96.5) 1.07 BN-0-0 (R) 45.2 (6.55) 464.3 (104.4) 1.01
Van den Hoogen [28] was the first to look into the behavior of deep beams where stresses were not able to spread in the strut between load and support. Van den Hoogen [28]
(450 mm)
24
referenced unpublished experimental results by Beeby [29] that compared the capacity of a beam with a cut-out of the concrete with a solid beam with no cut-out and the same dimensions, shown in Figure 2-17.
Figure 2-17: Beam and truss model tested by Beeby [29]
Beeby [29] found the beam with a cut-out to be 1.5 times stronger than the beam (i.e. less material resulted in a stronger structure). Van den Hoogen [28] created numerical models verified by the experimental results developed by Beeby [29]. From the analysis results, Van den Hoogen [28] concluded that the tension stresses developed by the bending of the beam without a cut-out decreased the shear strength of the beam. This diagonal tension (the tension caused by bending) disrupted the compression strut forming from the load to the support. They also determined that the gap height (hg) did not have a noticeable effect on the failure load or the failure mechanism. Note that the testing by Beeby [29] was done on beams in the transition between deep beam (a/d ≤ 2.0) and sectional shear behavior (a/d ≥ 2.5), so these observations should be confirmed for deep beams.
2.4.3 Angle of Strut Inclination
The behavior of struts is also impacted by the angle of strut inclination. ACI 318-14 [3] restricts that strut angles be between 25 and 65 degrees in a strut-and-tie model, which is
25
based on several researches [30]–[32]. This limitation is based on the idea that the struts loss their capacity when their axis approaches a ties axis [33]. Sahoo et al. [34] conducted an analytical investigation investigating strut angle and its effect on strut behavior, which can be measured by a strut efficiency factor (βs). Results from Sahoo et al. [34] are
summarized in Figure 2-18. The researchers concluded that current ACI 318-14 [3] strut efficiency factors can be unconservative for struts with angles less than 54 degrees.
Figure 2-18: Comparison of the code provisions with the proposed efficiency factor models for normal-weight concrete of 5.8 ksi (40MPa) [34]
Contrary results were found by Su and Looi [35]. Su and Looi [35] experimentally tested nine asymmetrical specimens with varying strut angles (i.e. varying a/d ratios). They concluded from their results that a constant strut efficiency factor should be used.
2.5 Tie Behavior
Tension elements in a strut-and-tie model (ties) must be designed with reinforcement to hold tensile forces in the ties. Reinforcement is provided based on the location of ties in
26
the model, and the location of ties in the model are located at the centroid of the tie reinforcement, as shown in Figure 2-19. This interdependence can make designing tie reinforcement an iterative process if the location of ties needs to be changed as reinforcement is detailed.
The sufficiency of the tie strength is not only dependent on enough reinforcing area being provided, but also requires that the reinforcement is properly developed by the time it leaves the extended nodal zone. The critical section for development of the tie is highlighted in Figure 2-19.
Figure 2-19: Development length of a tie [4]
Different types of development such as straight bars, hooked bars, headed bars, or bars welded to the external plates can be used to properly develop tie reinforcement. The development length formulas for different types of development from ACI 318-14 [3] are shown in Equation 2-1 to Equation 2-3. Reinforcement welded to steel plates is assumed to develop fully at the location of the steel plate. The specified required development length found using the below equations must be less than the total available development length
Diagonal Strut
Extended Nodal Zone Nodal Zone
Available Development Length
Critical Section for Development of Tie Tie coincides with centroid of reinforcement
27
found from reinforcement detailing, bearing dimensions, and strut geometry, shown in Figure 2-19.
Straight Bars (Detailed Method): 3
40 !&'"(#+ *"$"#+% ( , - ( Equation 2-1 ACI 318-14 (25.4.2.3) Hooked Bars: max {3 "$" "+ 50 ! 5 (, 8 (, 689. } Equation 2-2 ACI 318-14 (25.4.3.1) Headed Bars ( ! 6000 ;<8): max {30.016 "$ ! 5 (, 8 (, 689. } Equation 2-3 ACI 318-14 (25.4.4.2) Where: *#+ = min A2.5, 40B#+ C9 D
transverse reinforcement index, in.
B#+ =
total cross-sectional area of all transverse reinforcement within spacing s that crosses the potential plane of splitting through the reinforcement being developed, in.2
C = center-to-center spacing of items, such as longitudinal reinforcement,
transverse reinforcement,tendons, or anchors, in.
9 = number of items, such as, bars, wires, monostrand
anchorage devices, anchors, or shearhead arms
= specified yield strength for nonprestressed reinforcement,psi
! =
specified compressive strength of concrete, psi
28
'( =
lesser of: (a) the distance from center of a bar or wire to nearest concrete surface, and (b) one-half the center-to-center spacing of bars or wires being developed, in.
=
modification factor to reflect the reduced mechanical properties of lightweight concrete relative to normalweight concrete of the same compressive strength
" = factor used to modify development length based on cover
"$ = factor used to modify development length based on reinforcement
coating
"+ = factor used to modify development length based on confining
reinforcement
"% = factor used to modify development length based on reinforcement size
"# = factor used to modify development length for casting location in tension
2.6 Node Behavior
As previously introduced, there are three different types of nodes (CCC, CCT, and CTT) dependent on the types of elements framing into the node (compression or tension). The nodal zone under the load in Figure 2-8 is a CCC node and is further broken down in Figure 2-20. In this picture, the load is applied in the center of the load node, and both the left side and the right side are symmetrical. The total load applied (P) is equal to the sum of the force applied on each of the nodal zones (Cb1 and Cb2). Additionally, the force on the back face of each of the nodes is equal (Ck1 equals Ck2) to satisfy equilibrium of the node. If the load is not located at the center of a member, the bearing face of each of the nodes (1 and 2) will be proportional to the amount of force going in each direction. The back-face forces will always be equal, although the magnitude will change.
29
Figure 2-20: Geometry of CCC node
The dimensions of the bearing face (lb1), back face (hk), and strut-to-node interface (ws) must be determined to find the strength of the node; these dimensions are shown in Figure 2-21. The bearing face length is dependent on the total bearing length (lb) and proportional to the amount of force entering the node (Cb1) compared to the total applied load (P). For this example, half the total load is applied to Node 1 (Cb1 = 0.5P), so the bearing length is half of the total bearing length (lb1 = 0.5lb). The height of the back face (hk) can be found by finding the depth of the rectangular stress block from a typical nominal flexural moment analysis, as shown in Equation 2-4. The strut-to-node interface length (ws) depends on the height of the back face, length of the bearing, and the angle of the incoming strut (θ), as
shown in Equation 2-5. ℎF B% − B% ! ! 0.85 H ! Equation 2-4 Cb1 I + I Cb2 Cs2 Ck2 Ck1 Cs1 Ck1= Ck2 Strut-to-Node Interface Bearing Face
Back Face Back Face
Strut-to-Node Interface
Bearing Face
1 2
30
% ( <89J + ℎF 'K<J Equation 2-5
Where:
B% = area of longitudinal tension steel (in2) = yield strength longitudinal tension steel (psi)
B%! = area of longitudinal compression steel (in2)
! = yield strength longitudinal compression steel (psi)
H = web width (in.)
! = specified compressive strength of concrete (psi)
J = angle of incoming strut
Figure 2-21: Details of CCC node (Node 1 from above)
Typical dimensions for a CCT node with relevant details are shown in Figure 2-22 with the length of the bearing plate ( (), the height of the back face ( #), and the length of the strut-to-node interface ( %) highlighted. The height of the back face ( #) is calculated as
( ℎF % J (sin J ℎFcosJ 1 Strut-to-Node Interface Bearing Face Back Face ( ( + ( Note:
31
twice the distance from the bottom of the beam to the centroid of the ties. The length of the strut-to-node surface in CCT node is calculated in Equation 2-6.
% ( <89J + # 'K<J Equation 2-6
For additional details on calculating the dimension of different types of nodes refer to Birrcher et al. [4], Williams et al. [36], and Larson et al. [37].
Figure 2-22: Geometry of CCT node
A final distinction made when discussing nodal zones is based on whether the node has measurable dimensions. Nodes that are located adjacent to a support or load point have a defined geometry based on the bearing dimensions and bordering elements. Most of the other nodes in a strut-and-tie model do not have a definite geometry. Nodes without a defined geometry are called smeared nodes and typically do not need to be checked. For further details on smeared nodes refer to Wight and Parra-Montesinos [38], and Birrcher et al. [4]. Diagonal Strut Extended Nodal Zone Nodal Zone Bearing Face Strut-to-Node Interface Back Face % # 0.5 # #cosJ (sin J ( J
32
2.7 STM Design Provisions
The two STM design provisions that are primarily used in practice in the US are found in ACI 318-14 [3], and the AASHTO LRFD Bridge Design Specification [19]. An overview of these two design provisions is given in this section.
2.7.1 ACI 318-14 Building Code [3]
The ACI 318-14 Building Code [3] has separate design checks for the strength of struts, ties, and nodes. The reduced design strength (ϕFns for struts and ϕFnn for nodes) must be greater than the factored element force (Fus for struts and Fun for nodes) for both struts and nodes, as shown in Equation 2-7 and Equation 2-8.
OPQ% ≥ PS% Equation 2-7
OPQQ≥ PSQ Equation 2-8
The strength of the struts and nodes is dependent on the area of concrete at the interface between the struts and nodes (Acs for struts and Anz for nodes) and the effective concrete strength of the elements (fce). Relationships for these design strengths are shown in Equation 2-9 through Equation 2-12.
PQ% $B % Eqn. (23.4.1a) Equation 2-9
$ 0.85T% ′ Equation 2-10 Eqn. (23.4.3)
PQQ $BQV Equation 2-11 Eqn. (23.9.1)
$ 0.85TQ ′
Equation 2-12 Eqn. (23.9.2)
33
(βs) and node coefficient (βn), respectively, and the concrete compressive strength (f’c). The
strut coefficient (βs) depends on the geometry and location of a strut and are summarized in Table 2-2. The minimum of the strut and node coefficients should be used when designing the strut-to-node interface. Relevant to the members investigated in this research, struts with uniform cross-sectional areas along their length have a strut coefficient of 1.0, and struts located in regions where stresses can spread along the strut length without the minimum strut reinforcement have a strut coefficient of 0.6λ. The truss-like specimens have a uniform area along the length, so the strut coefficient is equal to 1.0. The rectangular specimens allow stress to spread along the strut length, so the strut coefficient is 0.6 (with λ equal to 1.0 for normal-weight concrete).
The node coefficient (βn) depends on the number of ties that are anchored into the node. Relevant to the members investigated in this research, the node coefficient is equal to 1.0 for nodes with no ties and 0.8 for nodal zones anchoring one tie. Members with external unbonded reinforcement have no ties anchoring in the nodal zones, so the node coefficient was taken as 1.0. Members with internal bonded reinforcement have one tie anchoring in the nodal zone, so the node coefficient was taken as 0.8.
These were some of the factors that were the focus of this testing program. There are several other resources with a more comprehensive explanation of the ACI 318-14 STM procedures [16], [17].
34
Table 2-2: Strut and node coefficients
Strut (WX) Node (WY) Prismatic Bottle-shaped CCC CCT CTT 1.0 with min. reinforcement Without min. reinforcement 1.0 0.8 0.6 0.75 0.6
A complete example to determine the strength of one of the experimental specimens using ACI 318-14 is provided in Appendix B.
2.7.2 AASHTO LRFD Bridge Design Specification [19]
Like ACI 318-14 [3], AASHTO LRFD [19] also requires that the reduced design strength (ϕPn) be greater than the factored element force (Pr) for struts, ties, and nodes, as shown in Equation 2-13.
OZQ ≥ Z+ Equation 2-13 Eqn. (5.8.2.3-1)
For struts and nodes, AASHTO LRFD 2016 requires only a check of the nominal resistance of the node faces, as shown in Equation 2-14, which is dependent on the limiting compressive stress of the node face (fcu) and the effective cross-sectional area of the node face (Acn).
ZQ SB Q Equation 2-14 Eqn. (5.8.2.5.1-1)
The limiting compressive stress of the node face (fcu) depends on the type of node (CCC, CCT, or CTT), the face where the nominal resistance is being found (bearing face, back face, or strut-to-node interface), the compressive strength of the concrete (f’c), and any confinement effects from surrounding concrete (accounted for through m), as shown in Equation 2-15.
35
S [\ ′ Eqn. (5.8.2.5.3a-1) Equation 2-15
Note that unlike ACI 318-14, AASHTO LRFD [19] does not account for the effect of stresses being able to spread along the length of struts or not being able to in members with constant cross-sectional areas along the length of struts.
Benefits from confinement are accounted for when the bearing area (A1) is smaller than the notional area (A2, defined in AASHTO) and uniform loading is applied by using Equation 2-16.
[ ]BB 2.0 Equation 2-16 Eqn. (5.6.5-3)
Note that no confinement benefits will be achieved when the loading plate has the same width as the specimens (m equals 1.0).
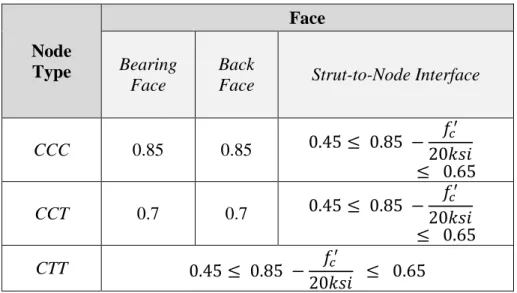
The concrete efficiency factor (v) depends on the type of node (CCC, CCT, or CTT), the face where the nominal resistance is being found (bearing face, back face, or strut-to-node interface), the presence of minimum strut reinforcement, and the compressive strength of the concrete (f’c). For beams with minimum crack control reinforcement, the concrete efficiency factors (v) are summarized in Table 2-3.
36
Table 2-3: Concrete efficiency factor (v), if minimum crack-control reinforcement is provided
Node Type Face Bearing Face Back
Face Strut-to-Node Interface
CCC 0.85 0.85 0.45 0.85 − ! 20^<8 0.65 CCT 0.7 0.7 0.45 0.85 − ! 20^<8 0.65 CTT 0.45 0.85 − ! 20^<8 0.65
For beams without minimum crack control reinforcement, the concrete efficiency factor (v) is equal to 0.45.
A complete example to determine the strength of one of the experimental specimens using the AASHTO LRFD Bridge Design Specification is provided in Appendix B.
2.8 Summary
Fundamental concepts and background information about STM were presented in this chapter. STM is a design procedure applicable to any section in any member but required in D-regions. It is a lower-bound plasticity theorem, so as long as equilibrium is satisfied and a beam is detailed so forces can redistribute, using STM will produce a safe design. A strut-and-tie model modeling the stress flow through a member using a hypothetical truss or kinematic model. The tension elements in the truss are ties, compression members are struts, and points of intersection are nodes. Design using STM requires ensuring sufficient capacity for struts and nodes and providing adequate steel reinforcement to resist tie forces.
37
Current ACI 318 terminology defines two different types of struts (bottle-shaped struts and prismatic struts) and has different strength coefficients for each. Previous research has brought into question whether bottle-shaped and prismatic are adequate descriptions of strut type and whether there is a difference in strength between them. The objective of this research was to further investigate the behavior of these struts when inclined.
38
Chapter 3: Loading Test Setup 3.1 Overview
Concrete without shear reinforcement is impacted by size (size effect), so specimens need to be sufficiently large to represent the true behavior of members found in actual structures. A high-capacity (800-kip) test frame was required to test the specimens in the experimental program. The design, construction, and capabilities of the test frame are given in this section.
3.2 Loading Setup Details
The load setup was designed to have an 800-kip capacity and tie into the already existing strong floor in the Titan America Structures Laboratory at FIU. The strong floor in the structures lab has groups of four threaded rod tie downs spaced at three feet center to center in the East-West direction and six feet center to center in the North-South direction. Each of the tie-down groups has a 100-kip capacity (25 kips in each of the four threaded rods), so eight of these tie down groups needed to be engaged to achieve an 800-kip capacity. The eight tie-down points selected for the design of the load frame are shown in Figure 3-1. One set of tie-down groups was not engaged in the center of the East-West direction to allow room for the test specimens.
39
Figure 3-1: Available tie-downs in the Structures Laboratory
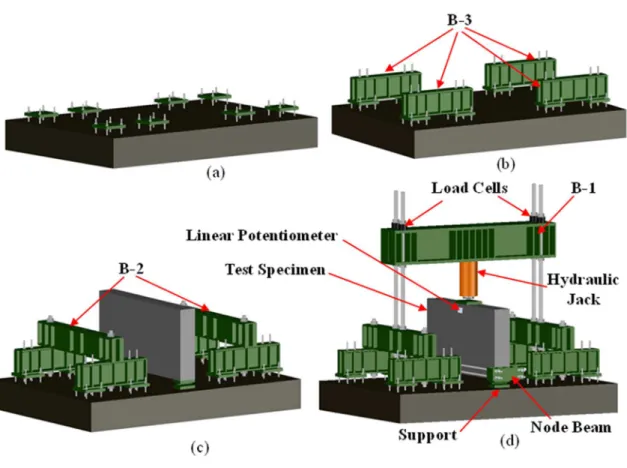
The load frame was then designed based on the available tie-down groups. The different components of the load setup are highlighted in Figure 3-2. Steel plates are located at each of the tie-down groups to engage all the four threaded rods, shown in Figure 3-2 (a). A beam (B-3) consisting of two channel steel sections (C15x40) connected with _
` -inch steel
plates welded to the top and bottom of the channel sections and plate stiffeners located where needed was used to connect adjacent plates on the tie-down groups, shown in Figure 3-2 (b). These B-3 beams were connected on each side using similar double channel steel beams (B-2), shown in Figure 3-2 (c). A large plate-girder spreader beam (B-1) was then used to connect the 2 beams together, shown in Figure 3-2 (d). 1 was connected to B-2 using large diameter threaded rods, which allows for easy vertical adjustment of the loading frame depending on the size of the test specimen. Two plates parallel to each other
40
and connected with a pin were welded on top of beam B-1 allow for easy connection with the crane.
Figure 3-2: The steps of loading set-up and specimen installation
The load is applied by an 800-kip hydraulic jack (10,000 psi) attached to the spreader beam B-1 using four high-strength bolts. Load cells with 250-kip capacity were designed to be located on each of the four threaded rods between beam B-1 and the nut on the end of the rod. These load cells measure the load in each rod and ensure that the load is being applied symmetrically on the load frame. The load applied to the specimen is then equal to the total load measured in all four of the load cells plus the weight of B-1 and the hydraulic jack. Construction drawings of each component of the test setup are provided in Appendix A.
41
3.3 Assembly and Disassembly
The procedure for assembling and disassembling the test setup is described in this section. First, all the threaded rods and steel plates need to be installed at each of the tie-down groups, shown in Figure 3-2 (a) and Figure 3-3. One practical recommendation for installing the first rods in the tie-downs is that the rods should be tied to the ground while they are in the plates, as shown in Figure 3-3. Because of imperfections in the tie-downs, it is difficult to put the plate over the rods after they are already threaded into the strong floor.
Figure 3-3: installing the first rods in the ground
After installing all the rods to the ground, the distance of all the plates to the ground was measured to make sure they have the same clearance. Each plate was leveled with a small beam level, and the adjoining plates were leveled with a longer one. Beams B-3 were then attached to each plate using threaded rods and checked again to ensure they were level, as shown in Figure 3-2 (b). Beams B-2 were then placed and attached to Beams B-3, as shown in Figure 3-2 (c). The different threaded rods required for installation of the load setup are highlighted in Figure 3-4.
42
Figure 3-4: installing rods to connect the beams
The specimen was placed into the test setup after installing all the rods, but before the placement of the spreader beam (B-1). The component of the specimens tested in this program are highlighted in Figure 3-5. The pin supports were first placed in the correct location relative to the testing frame. Next, the beam was moved into position and gypsum cement mortar (hydro-stone) was placed on top of the support plate and the beam carefully lowered into position. Gypsum cement mortar is used to ensure that the force is equally distributed on the specimen at the location of the support plate. The node beam and threaded rods used for tension steel was then placed for the specimens with external unbonded reinforcement, shown in Figure 3-5 (c). Node beams were held in position using


![Figure 2-15: Mean experimental efficiency factors across various studies for selected W/B [9]](https://thumb-us.123doks.com/thumbv2/123dok_us/10940203.2982673/41.918.172.792.120.529/figure-mean-experimental-efficiency-factors-various-studies-selected.webp)
![Figure 2-16: the detail of tested deep beams in Sahoo et al. [7]](https://thumb-us.123doks.com/thumbv2/123dok_us/10940203.2982673/42.918.203.793.109.559/figure-tested-deep-beams-sahoo-et-al.webp)