Energy-Efficiency
Policy Opportunities
for Electric
Motor-Driven Systems
I
nternatIonale
nergya
gencyP
aulW
aIde andc
onradu. B
runnerWORK ING PA PER
Efficiency
Series
Energy-Efficiency
Policy Opportunities
for Electric
Motor-Driven Systems
I
nternatIonale
nergya
gencyP
aulW
aIde andc
onradu. B
runnerWORK ING PA PER
The views expressed in this working paper are those of theauthors and do not necessarily reflect the views or policy of the International Energy Agency (IEA) Secretariat or of its individual member countries. This paper is a work in progress, designed to elicit comments and further debate; thus, comments are welcome, directed to the authors of the Energy Efficiency and Environment Division at: [email protected]
The International Energy Agency (IEA), an autonomous agency, was established in November 1974. Its primary mandate was – and is – two-fold: to promote energy security amongst its member countries through collective response to physical disruptions in oil supply, and provide authoritative research and analysis on ways to ensure reliable, affordable and clean energy for its 28 member countries and beyond. The IEA carries out a comprehensive programme of energy co-operation among its member countries, each of which is obliged to hold oil stocks equivalent to 90 days of its net imports. The Agency’s aims include the following objectives:
Secure member countries’ access to reliable and ample supplies of all forms of energy; in particular, through maintaining effective emergency response capabilities in case of oil supply disruptions.
Promote sustainable energy policies that spur economic growth and environmental protection in a global context – particularly in terms of reducing greenhouse-gas emissions that contribute
to climate change.
Improve transparency of international markets through collection and analysis of energy data.
Support global collaboration on energy technology to secure future energy supplies and mitigate their environmental impact, including through improved energy
effi ciency and development and deployment of low-carbon technologies.
Find solutions to global energy challenges through engagement and dialogue with non-member countries, industry, international
organisations and other stakeholders. IEA member countries:
Australia Austria Belgium Canada Czech Republic Denmark Finland France Germany Greece Hungary Ireland Italy Japan
Korea (Republic of) Luxembourg Netherlands New Zealand Norway Poland Portugal Slovak Republic Spain Sweden Switzerland Turkey United Kingdom United States
The European Commission also participates in
the work of the IEA. Please note that this publication
is subject to specifi c restrictions that limit its use and distribution. The terms and conditions are available
© OECD/IEA, 2011
International Energy Agency
9 rue de la Fédération 75739 Paris Cedex 15, France
Page | 3
Table of Contents
Acknowledgments ... 9
Executive Summary ... 11
The global assessment ... 11
Motor systems used widely across all sectors... 11
Policy intervention can stimulate significant savings ... 13
Policies needed for optimising packaged systems ... 14
Comprehensive integrated policy package ... 15
Regulatory policy measures ... 15
Non‐regulatory policy measures ... 16
Putting ideas into practice ... 16
1. Introduction ... 18
2. Electric Motor‐Driven Systems and Applications ... 20
Motor system types and definitions ... 20
EMDS Applications ... 20
Motor market data ... 21
Market volumes by application ... 22
Market share by efficiency ... 23
Market penetration of VFD technology ... 27
3. Global Electricity Consumption and CO2 Emissions of Electric Motor‐Driven Systems ... 29
Scope and methodology ... 29
Scope and definitions... 30
Methodology ... 32
Top‐down estimates of electricity use ... 32
Demand by end‐use ... 32
Demand by motor sector ... 33
Demand by motor size ... 37
Demand by motor application ... 37
Conclusions from top‐down estimates ... 39
Bottom‐up model of motor electricity use ... 41
Methodology ... 41
The motor stock model ... 41
Estimates from bottom‐up model ... 42
Consolidated top‐down and bottom‐up estimates of electricity consumption and CO2 emissions ... 43
Causes of uncertainty ... 45
Top‐down estimates ... 45
Page | 4
4. Energy‐Savings Technologies and Savings Potentials Applicable to Electric
Motor‐Driven Systems ... 46
Improving component efficiency ... 46
Standard AC squirrel‐cage induction motor ... 46
Other motor technologies ... 48
New motor technologies ... 49
Gears and transmissions ... 51
Motor control technologies ... 53
Variable loads and VFDs or ASDs ... 53
Efficiency opportunities in different motor applications ... 56
Pumps ... 56
Fans ... 62
Compressors ... 66
Other applications ... 67
Related energy‐savings opportunities ... 68
Engineering practice improvement ... 68
Integrated machine design ... 69
Packaged products as core motor systems ... 70
Adequate sizing ... 70
Efficient operation ... 70
5. The Economics of Energy Savings in Electric Motor‐Driven Systems ... 72
Factors that influence EMDS economics ... 72
Engineering decision making ... 73
Least life‐cycle cost ... 73
Repair versus replacement ... 75
Upgrading existing systems ... 75
Paying for a better motor by buying a smaller motor ... 76
Tapping cost benefits from motor‐system optimisation ... 76
6. Barriers to Optimisation of Efficient Electric Motor‐Driven Systems ... 78
Concepts of barriers ... 78
Missed cost reductions for mass‐produced products ... 78
Barriers to international trade... 80
Technical barriers in electricity supply ... 80
Barriers in non‐harmonised standards ... 81
Barriers at sector and business levels ... 82
Barriers at the level of manufacturers and OEMs ... 82
Barriers in wholesale, planning and engineering ... 84
Page | 5
Externalities of electricity use by electric motors and motor systems ... 88
Conclusions on removing barriers ... 89
6. Energy‐Efficiency Policy Experience for Electric Motor‐Driven Systems ... 90
Regulations and labelling for integrated equipment and components ... 90
Electric motors ... 90
Pumps ... 96
Fans ... 101
Compressors ... 102
Systems performance specifications ... 103
Electric motors ... 103
Pumps ... 103
Fans ... 104
Air compressors ... 104
Tools to encourage adoption of enhanced motor‐driven systems ... 105
United States: pump motor systems ... 105
United States: fan motor systems ... 106
United States: air compressor systems ... 106
Awareness‐raising efforts ... 107
European Union: pumps ... 107
Economic incentives ... 107
North America ... 107
China ... 108
Industrial‐sector energy service companies ... 108
Industrial energy‐efficiency programmes and capacity building... 108
European Union ... 108
China ... 109
Links with macro‐policy initiatives ... 109
Evaluation and impacts ... 109
7. Options and Recommendations for New Policies on Electric Motor‐Driven Systems ... 111
Policy context ... 111
Policy recommendations ... 112
Regulatory policy measures ... 112
Non‐regulatory policy measures ... 114
Potential policy impacts ... 116
Comprehensive integrated policy package ... 117
Regulatory ... 118
Non‐regulatory ... 118
Page | 6
Annex A. Technical Standards for EMDS ... 121
Abbreviations ... 123
References ... 125
List of figures Figure 1: Projected global electric motor‐system electricity consumption ... 14
Figure 2: Electric motor categories ... 20
Figure 3: Efficiency classes for four‐pole motors of standard IE3, IE2 and IE1 classes, and the new IE4 class ... 23
Figure 4: Market share of efficiency classes in the United States (2001‐06) ... 25
Figure 5: Motor efficiencies in Canada before and after introduction in 1997 of Energy‐ Efficiency Regulations for General Purpose Industrial Motors ... 26
Figure 6: Market share of efficiency classes in Europe under the CEMEP voluntary agreement ... 27
Figure 7: Total motor system, core motor system and electric motor ... 29
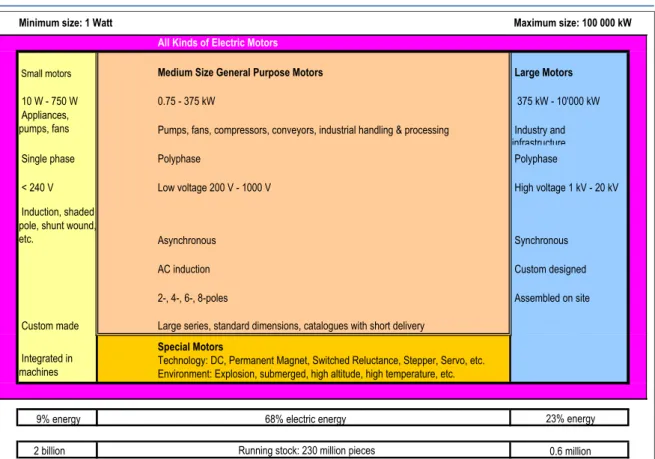
Figure 8: Main types of electric motors as a function of power and associated characteristics ... 31
Figure 9: Estimated share of global electricity demand by end‐use (2006) ... 33
Figure 10: Assumed share of motor electricity use by end‐user sector ... 35
Figure 11: Estimated electricity demand for all electric motors by sector ... 37
Figure 12: Estimated share of global motor electricity demand by application (2009) ... 40
Figure 13: Estimated overall efficiency and electricity use for all types of electric motor systems ... 40
Figure 14: Partial‐load efficiency of IE3 and IE1 motors (4‐pole) ... 47
Figure 15: Impact of possible areas of improvement for induction motor performance ... 48
Figure 16: IE3 Premium‐Efficiency motor ... 50
Figure 17: High‐efficiency EC motors from 0.1 kW to 10 kW for fans ... 51
Figure 18: Two transmission systems: roller chains and synchronous belts ... 52
Figure 19: Schematic variable‐frequency drive ... 53
Figure 20: Typical efficiency of low‐voltage, pulse‐width modulated frequency converters at full load ... 55
Figure 21: Variable‐frequency drive efficiency at full and partial load ... 56
Figure 22: Five major pump types (typical pump configurations) ... 57
Figure 23: Efficiency of single‐stage pumps according to variation of head and flow ... 57
Figure 24: Energy savings with speed control for a centrifugal pump without static pressure head ... 58
Figure 25: High‐efficiency electronically commutated motor for pumps ... 58
Figure 26: Glandless circulation pump with EC motor and automatic power adjustment ... 59
Figure 27: Electricity savings of circulator pump in heating system ... 59
Figure 28: Reduced electric power use in industrial‐size pump system ... 60
Page | 7
Figure 31: Centrifugal fans: energy savings with different methods of air‐flow control ... 64
Figure 32: Fan efficiency potential ― reduced specific power ... 66
Figure 33: Fan efficiency potential ― reduced annual electricity use ... 66
Figure 34: Systematic elimination of losses in an optimal drive system ... 69
Figure 35: Life‐cycle cost of 11 kW IE3 motor with 4 000 operating hours per year ... 72
Figure 36: Relative prices of electric motors with higher efficiency and variable‐frequency drives, Switzerland, 2008 ... 74
Figure 37: System life‐cycle cost analysis of an 11 kW motor ... 74
Figure 38: Example of how downsizing can pay for a more‐efficient motor ... 76
Figure 39: Policy instruments to reduce obstacles to diffusion of high‐efficiency electric motors and motor systems along the product cycle ... 82
Figure 40: Conventional (static) payback period and IRR of high‐efficiency motors compared to normal motors at different yearly operating hours ... 88
Figure 41: Projected global electric motor system electricity consumption ... 117
List of tables Table 1: EDMS electricity consumption by sector ... 11
Table 2: Proposed timetable for implementation of recommendations ... 17
Table 3: EMDS applications showing relationships between systems and service ... 21
Table 4: Motor systems sales in the United States (2003) ... 22
Table 5: Motor systems sales in the European Union (2005) ... 22
Table 6: Distribution of motor applications in the US industry sector (1997) ... 22
Table 7: Stock data for three applications in the European Union (2005) ... 22
Table 8: Motor efficiency classes in different countries and the corresponding international standard ... 24
Table 9: Timeline for electric‐motor efficiency classes, testing standards and minimum energy performance standards ... 24
Table 10: Share of motor efficiency class IE3 sales in the United States (2001–06) and Canada (2007) ... 26
Table 11: Share of efficiency class IE3 in electric motor sales by size, United States (2003) ... 26
Table 12: Estimate of global electricity demand (TWh) by sector and end‐use (2006) ... 33
Table 13: Estimated global electricity consumption by sector in 2006 ... 34
Table 14: Electricity end‐use by sector, country and estimated demand for all electric motors (2006) ... 36
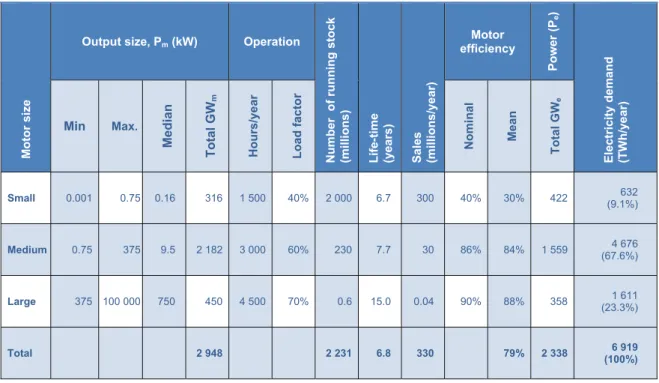
Table 15: Estimated electricity demand for the three major groups of electric motors (2009) .. 38
Table 16: Applications of all kinds of electric motors ... 38
Table 17: Estimated global motor electricity demand by sector and application (2006) ... 39
Table 18: Estimated motor electricity demand with particular factors from the bottom‐up model for 13 countries with highest electricity consumption ... 43
Table 19: Comparison of motor electricity demand in bottom‐up and top‐down models and figures from the literature of 12 economies ... 44
Page | 8
Table 21: Typical losses in an AC induction motor ... 48
Table 22: Gear efficiency ... 52
Table 23: Comparison of annual electricity use in circulator pump systems ... 60
Table 24: Comparison of annual electricity use in industrial‐size pump systems ... 61
Table 25: Major fan product categories and characteristics ... 62
Table 26: Measures and potentials for reducing the energy demand of fans ... 64
Table 27: Optimisation study of a fan ... 65
Table 28: Example of losses in a compressed‐air system ... 67
Table 29: Areas of energy efficiency in electric motor systems ... 68
Table 30: Classification of barriers to energy efficiency ... 79
Table 31: Internal rate of return and payback period difference between risk and profitability analysis ... 87
Table 32: Nominal minimum efficiencies (η) for electric motors in Europe (50 Hz) ... 91
Table 33: Motor types subject to MEPS in the United States1 ... 93
Table 34: Nominal minimum full‐load efficiencies for Subtype I electric motors in the United States (60 Hz) 1 ... 93
Table 35: Regulations for electric motors in some other countries ... 95
Table 36: Energy labelling efficiency thresholds for circulator pumps in the European Union.... 98
Table 37: Regulations for pump motor systems in some other countries ... 100
Table 38: Proposed timetable for implementation of recommendations ... 119
Table 39: Key international standards ... 122
Table 40: Other regional standards ... 122
List of equations Equation 1 ... 34 Equation 2 ... 41 Equation 3 ... 42 Equation 4 ... 63
Page | 9
Acknowledgments
This paper was written by Paul Waide (formerly with the IEA and now with Navigant Consulting)
and Conrad U. Brunner of A+B International in collaboration with Martin Jakob and Martin
Meyer, TEP Energy, Zurich, Switzerland as well as Eberhard Jochem, BSR Sustainability, Karlsruhe,
Germany. Particular thanks go to the following IEA staff and outside colleagues for the time spent
in reviewing and providing comments: Nigel Jollands, Shane Holt, Jungwook Park and Hugh
Falkner. The authors would also like to acknowledge Edita Zlatic for her administrative assistance,
Page | 11
Executive Summary
The
global
assessment
This paper presents the findings of the first global analysis of energy consumption in electric
motor‐ driven systems (EMDS)1 and the options to reduce it. It assesses the energy currently used
by EMDS and the potential for energy savings, examines market barriers to the adoption of
energy‐efficient solutions, and reviews current policy settings and outcomes. The report then
proposes a comprehensive package of policy recommendations to help governments tap the
huge potential for energy savings in EDMS.
Electric motors convert electrical power into mechanical power within a motor‐driven system.
The vast majority of the electricity used by an EMSD is consumed by the electric motor itself.
Only a very small amount is used to power control functions or other ancillary circuits.
Electric motors and the systems they drive are the single largest electrical end‐use, consuming
more than twice as much as lighting, the next largest end‐use. It is estimated that EMDS account
for between 43% and 46% of all global electricity consumption, giving rise to about 6 040 Mt of
CO2 emissions. By 2030, without comprehensive and effective energy‐efficiency policy measures,
energy consumption from electric motors is expected to rise to 13 360 TWh per year and CO2
emissions to 8 570 Mt per year. End‐users now spend USD 565 billion per year on electricity used
in EDMS; by 2030, that could rise to almost USD 900 billion.
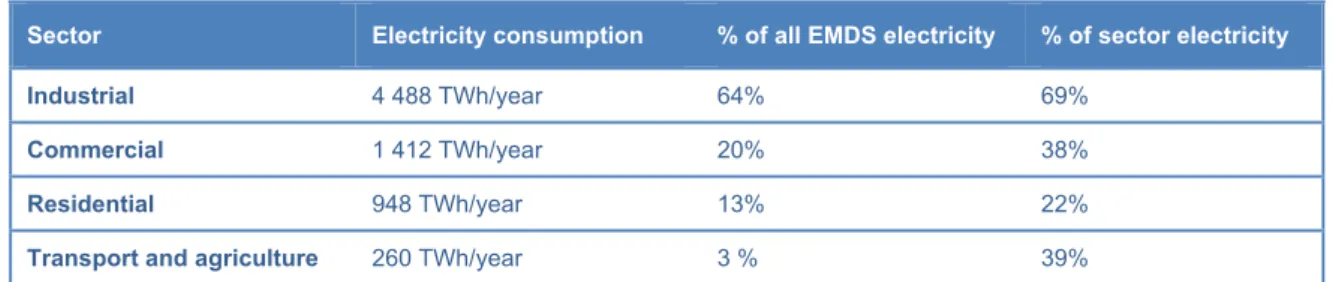
Table 1: EDMS electricity consumption by sector
Sector Electricity consumption % of all EMDS electricity % of sector electricity
Industrial 4 488 TWh/year 64% 69%
Commercial 1 412 TWh/year 20% 38%
Residential 948 TWh/year 13% 22%
Transport and agriculture 260 TWh/year 3 % 39%
Source: IEA statistics, 2006 (national electricity demand); A+B International, 2009 (motors calculations).
These daunting figures are the aggregate of the energy consumed by an array of different types
of motors operating within a wide set of applications in every sector of energy use, with the
greatest opportunity for savings in the industrial sector (Table 1).
Motor
systems
used
widely
across
all
sectors
The majority of electric motors in use draw less than 0.75 kW of power in a variety of small
applications, mostly in the residential and commercial sectors. These motors account for only
about 9% of all electric motor power consumption. In general, they are integrated into mass‐
produced packaged applications such as refrigerator compressors, extractor fans, computer hard
drives, etc. Many of these applications are subject to policies that apply to the level of the
packaged system, rather than the electric motor component, but many are still not subject to any
policy requirements. In the European Union, for example, at the beginning of 2010, only about
38% of motor electricity consumption in the combined residential and commercial sectors was
used in systems subject to minimum energy performance standards (MEPS).
1
Page | 12
The largest proportion of motor electricity consumption is attributable to mid‐size motors with
output power of 0.75 kW to 375 kW. Many different motor technologies and design types are
available, but asynchronous alternating current (AC) induction motors are most frequently used
and consume the most energy. These motors are either sold to original equipment
manufacturers (OEMs) and integrated into pre‐packaged electromechanical products (such as
pumps, fans, compressors, etc.) or sold as stand‐alone motors that final customers then integrate
into a specific application on site. Such stand‐alone motors are produced in large volumes,
according to standardised input power and size specifications, with varying channels to market
and integration into electromechanical systems. This has a significant impact on the type of
barriers to adoption of energy‐efficient solutions for EMDS and, hence, on the most appropriate
policy packages to overcome such barriers.
Motors in the mid‐size range are most commonly found in industrial applications, but they are
also widely used in commercial applications, infrastructure systems and, less often, in the
residential sector. In general, their main applications are mechanical movement, compressors,
pumps and fans, which in turn have many types of sub‐application. At present, most OECD and
many non‐OECD economies impose MEPS on asynchronous mid‐size AC motors sold as separate
components. Very few countries have set such requirements for other types of electric motors,
and the requirements are rarely applied specifically to motors integrated directly into a packaged
system prior to sale.
Large electric motors with more than 375 kW output power are usually high‐voltage AC motors
that are custom‐designed, built to order and assembled within an electromechanical system on
site. They comprise just 0.03% of the electric motor stock in terms of numbers, but account for
about 23% of all motor power consumption, making them very significant consumers of global
power (about 10.4%). These motors are not currently subject to MEPS in any part of the world.
In electric motor‐driven systems, some energy losses occur in the motor itself, but energy losses
are greater in the rest of the mechanical system to which the motor is coupled. A typical
electromechanical system involves a motor, an electrical control system, a variable‐speed drive
(VSD) and a mechanical load. The magnitude of energy losses depends on the application and the
degree to which an advanced technical solution is used. For any given power rating, there is a
difference of only a few percentage points in energy efficiency between average motors and the
most efficient motors on the market.
Small motors are less efficient than higher‐powered motors. Large losses can occur due to
mismatches between the output power of fixed‐speed motors and the mechanical power
demands of the electromechanical system. This is especially true when motors are used in
mechanical applications with variable mechanical power needs, which have a highly non‐linear
relationship between input power and mechanical load (torque and speed) and an exponential
relationship between input power and mechanical power (e.g. pumps, fans and compressors). In
this case, there can be very significant savings from using variable‐frequency drives (VFDs) with
intelligent control, which regulate the output torque and speed of the motor to match the
system mechanical loads. However, such control systems need a significant amount of power to
operate and should not be used in fixed output power applications. In such applications, they will
incur more energy losses and impose higher costs than a properly sized fixed‐speed system.
For any given output power rating, there is currently a spread of several percent in efficiency
between the most and least efficient motors on the market. Despite being slightly more costly to
purchase than standard motors, higher‐efficiency motors (HEMs) with over 1 000 hours of
operation per year are more cost‐effective over the system life for end‐users in all applications,
Page | 13
over 100%, but end‐users rarely demand HEM applications, due to a host of market barriers.
Mandatory regulations are usually the best way to ensure significant and timely market
penetration of HEMs.
Policy
intervention
can
stimulate
significant
savings
Overall, this analysis finds that using the best available motors will typically save about 4% to 5%
of all electric motor energy consumption. Linking these motors with electromechanical solutions
that are cost‐optimised for the end‐user will typically save another 15% to 25%. The potential
exists to cost‐effectively improve energy efficiency of motor systems by roughly 20% to 30%,
which would reduce total global electricity demand by about 10%.
The three major routes to achieving these savings are:
Use of properly sized and energy‐efficient motors.
Use of adjustable‐speed drives (ASDs)2, where appropriate, to match motor speed and torque
to the system mechanical load requirements. This makes it possible to replace inefficient
throttling devices and, in some cases with “direct‐drive”, to avoid wasteful mechanical
transmissions and gears.
Optimisation of the complete system, including correctly sized motor, pipes and ducts,
efficient gears and transmissions, and efficient end‐use equipment (fans, pumps,
compressors, traction, and industrial handling and processing systems) to deliver the required
energy service with minimal energy losses.
Without policy intervention, many barriers make it difficult or impossible to realise these savings
in the current market environment. In unregulated markets, purchasers tend to underinvest in
higher‐efficiency options and choose electric motor systems with a low first cost. This occurs for a
variety of reasons, including:
Lack of awareness among motor purchasers of the potential for energy and cost savings by
using more efficient motors within energy‐efficient EMDS.
Company organisational structures that manage their equipment procurement budget
separately from operations and maintenance budgets.
The fact that motors are often integrated into equipment produced by OEMs before sale to
the final end‐user.
To overcome these barriers, many countries (now comprising over one‐third of the world’s
population) have adopted MEPS for the main class of industrial electric motors. More countries
are in the process of developing such requirements. This policy instrument has been shown to be
practicable to implement and a cost‐effective means of saving energy. The average energy
efficiency of new motors in countries applying MEPS is notably higher than in countries without
such requirements. It is estimated that if all countries adopted best practice MEPS for industrial
electric motors, by 2030 approximately 322 TWh of annual electricity demand would be saved,
giving rise to corresponding savings of 206 Mt of CO2 emissions.
2 An adjustable speed drive (ASD) or variable‐speed drive (VSD) is equipment used to control the speed of machinery. Many industrial processes such as assembly lines must operate at different speeds for different products. Where process
conditions demand adjustment of flow from a pump or fan, varying the speed of the drive may save energy compared with
other techniques for flow control. Where speeds may be selected from several different pre‐set ranges, usually the drive is
said to be "adjustable" speed. If the output speed can be changed without steps over a range, the drive is usually referred
to as "variable speed". A variable‐frequency drive (VFD) is a system for controlling the rotational speed of an alternating
Page | 14
Policies
needed
for
optimising
packaged
systems
Important as these savings are, much larger savings would accrue if all EMDS were properly
optimised. Realising this objective is less straightforward from a policy perspective, but it is possible
to make headway in the more complex domain of EMDS by carefully segmenting the applications in
which motors are used, and by targeting regulatory policies at packaged motor systems applications
with large savings potentials (e.g. certain kinds of pumps, fans and compressors). It is practicable
to set MEPS and energy labelling requirements for a range of core motor‐driven systems,
including fans, pumps and compressors. In some cases, similar MEPS can be applied to entire
motor‐driven system applications (e.g. for municipal water pumping, elevators and escalators).
Regulatory measures should not necessarily be confined to devices and components that directly
consume power; policies could also eventually target the large potential energy savings from
improved energy performance of mechanical components (such as gears and drive belts). Certain
common technologies (such as worm drives and V‐belts) are fundamentally inefficient and could
potentially be regulated out of the market in favour of more efficient options.
As some aspects of motor‐system energy use do not lend themselves to simple regulatory
approaches, softer policy measures can be beneficial. It is especially important to strengthen
market awareness through educational efforts targeting multiple decision‐making levels (OEM,
system specifier, plant manager, energy manager and senior manager/executive level). This
would include user‐friendly technical assistance through enhanced technical standards, system
specification and operational/energy management tools and services. There is also a need to better
align fiscal and financial incentives throughout the value chain, which could be complemented by
well‐targeted economic assistance to encourage the uptake of energy‐efficient EMDS.
Figure 1: Projected global electric motor‐system electricity consumption
Abbreviation: LLCC = least life‐cycle cost. Notes:
Reference scenario: when the current situation is maintained without additional policy measures. Policy scenario: when all countries adopt a broad‐based and rigorous policy package on EMDS. LLCC scenario: when all EMDS are moved toward the least life‐cycle cost level.
0 2000 4000 6000 8000 10000 12000 14000 16000 2005 2010 2015 2020 2025 2030 M o to r sy st e m e le ct ri ci ty co n su m p ti o n (T W h ) Policy scenario LLCC scenario Motor system electricity consumpt ion Reference scenario 20% 30%
Page | 15
Above all, it is essential to scale up the operations and resources committed to realising the vast
savings potential of optimised EMDS. By comparison with other sustainable energy opportunities,
the energy efficiency of EDMS has been relatively neglected, and nowhere do such systems
currently benefit from the scale of support that is offered to sustainable supply‐side options.
While governments are starting to become more proactive on this issue, and many have
implemented some useful policy measures, none has yet put in place the resources or policy
processes likely to realise substantial savings.
If a broad‐based and rigorous policy package were put in place, it is estimated that globally, by
2030, it would save some 24 000 TWh in electricity demand, avoid some 16 Gt of CO2 emissions,
and generate cost savings of about USD 1.7 trillion (Figure 1). These savings would come at less
cost than supplying this energy. Annual savings in 2030 would be in the order of 2 800 TWh in
electricity demand, 1 790 Mt of CO2 emissions and USD 190 billion in electricity costs.
If it were possible to move all EMDS towards the least life‐cycle cost level as rapidly as technically
possible, it is estimated that some 42 000 TWh of electricity demand, 29 Gt of CO2 emissions and
USD 2.8 trillion in electricity costs would be saved globally by 2030. Annual savings in 2030 would
be of the order of 3 890 TWh in electricity demand, 2 490 Mt of CO2 emissions and
USD 264 billion in electricity costs.
Comprehensive
integrated
policy
package
To help realise the tremendous potential for cost‐effective energy savings in electric
motor‐driven systems, governments should consider, as a first measure, adopting mandatory
MEPS for electric motors, in line with international best practice, subject to due process and cost‐
effectiveness analysis.
These standards should apply to as many types and sizes of electric motor as it is feasible to
address and should not be confined to mid‐size asynchronous AC motors sold as separate
components. The level of these standards should be set at no lower than the least life‐cycle cost,
which is generally at IE33 or higher for mid‐size asynchronous AC induction motors. Even larger
energy savings can be achieved by using VFDs, which dynamically match the output power of
motor systems to the power demanded by the drive train. Further savings can be achieved by
using efficient transmission and gear systems, and through better sizing and management of
electric motor‐driven systems.
Overall it is estimated that it is cost‐effective to save about 20% to 30% of total global electric motor
demand (i.e. roughly 10% of all global electricity consumption) through the use of more efficient
electric motors and drives. Achieving such savings will require individual and concerted action on the
part of all players, including regulators, policy makers and standards development agencies.
It is proposed that IEA member countries and non‐member economies apply a market‐
transformation package based on the portfolio of energy performance policies set out in the
following package of policy recommendations:
Regulatory
policy
measures
1. MEPS should be introduced in IEA member countries in line with international best practice
for all major classes of electric motors. They should not be set at levels less than IE3 for
asynchronous motors. These requirements should apply to motors sold individually or
integrated into pre‐packaged electric motor‐driven systems, and should apply to motors with
as wide a range of output power as is practicable (100 W to 1 000 kW).
3
Page | 16
2. Regulatory measures, such as MEPS and energy labelling, should be introduced for packaged
integrated motor‐driven energy end‐uses between 100 W and 1 000 kW, including fans,
pumps, circulation pumps and compressors that are produced in sufficiently large volumes to
have significant energy consumption.
3. Regulators, policy makers and standards development agencies should ensure that energy
performance test procedures are developed for all motor types that use significant amounts
of electricity and are not covered by existing internationally agreed test procedures.
4. Regulators, policy makers and standards development agencies should commission the
development and application of energy‐performance test procedures to cover other
essential components of electric motor‐driven systems, including transmissions, gears and
system control devices (e.g. VFDs). In addition, efforts should be made to develop energy‐
performance test procedures and guidelines that apply to whole electric motor system
applications, such as utility water‐pumping, lifts (elevators), escalators, conveyors, etc.
5. Regulators should explore the feasibility of developing minimum energy performance
standards for certain classes of gears and transmissions to discourage (and later prohibit) the
use of inefficient solutions such as worm gears and V‐belts.
Non
‐
regulatory
policy
measures
6. Large‐scale awareness programmes should be developed and put in place to inform industrial
and commercial electricity users of the significant savings potentials possible through the use
of efficient electric motor‐driven systems. These programmes should target those responsible
for procurement of electric motors and motor‐driven systems, including operations and
maintenance managers, production and plant managers, and company executives and
decision makers responsible for overall company policy on energy, carbon and cost reduction.
7. Incentive schemes should be developed and applied to encourage adoption and use of best
practice motor sizing, management and integration, including the appropriate use of VFDs.
These should be targeted at the systems producing the highest benefit, namely for pumps,
fans and other applications with variable mechanical loads (where torque increases nearly as
the square of the rotational speed of the motor). In most cases, cost‐effective savings can also
be achieved when VFDs are used for conveyors, hoists, escalators and similar applications
(where torque is more or less independent of the motor speed). Incentive schemes are also
likely to be beneficial for these applications.
8. International capacity‐building efforts should be substantially expanded to create permanent
support structures, at a scale sufficient to support ongoing needs in the domain of energy‐
efficient electric motor‐driven systems.
9. Global market monitoring should be established at defined intervals, to support national
regulation and incentive programmes with market‐transformation data.
Putting
ideas
into
practice
Realising these savings opportunities by 2030 will require a clear a plan of action and rapid
implementation of an effective set of structural and consensus‐building endeavours. It is proposed
that IEA member countries establish a timetable for implementation of the nine policy
recommendations. To aid that process, the authors have identified timelines for completion of the
Page | 17
Table 2: Proposed timetable for implementation of recommendations
Recommendations Phase 1 In 2011 Phase 2 2012-15 Phase 3 2016-20 Phase 4 2021-25 Phase 5 2026-30
Regulatory policy measures Implementation of MEPS for all major classes of electric motors.
COMMENCE COMPLETED
Regulatory measures for packaged integrated motor-driven energy end-uses. COMMENCE COMPLETED Development of international test procedures for other electric motor types.
COMMENCE CONTINUE COMPLETED
Development of international test procedures for other electric motor system components.
COMMENCE COMPLETED
Regulatory measures for gears and
transmissions.
COMMENCE COMPLETED
Non-regulatory policy measures Development of
large-scale awareness programmes.
DEVELOP ROLL-OUT ROLL-OUT ROLL-OUT
Development of
incentive schemes. DEVELOP IMPLEMENT
International capacity-building efforts and creation of a permanent support structure.
COMMENCE COMPLETE ROLL-OUT ROLL-OUT ROLL-OUT
Global market monitoring (to support national regulation and incentive programmes with
market-transformational data).
COMMENCE REPORT 2015 REPORT 2020 REPORT 2025 REPORT 2030
To support the underpinning recommendation regarding the adoption of mandatory minimum
energy performance standards for electric motors, it is proposed that IEA member countries
adopt a policy position as quickly as possible, with an IEA report on it before 2015. IEA member
countries can then be positioned as lead actors in a push for globally co‐ordinated action on
motors, with supporting project work to engage with major motor‐manufacturing countries (such
as China, Brazil, India and others).
In addition, it is proposed that the IEA immediately undertake a comprehensive study, completed
in 2011, to assist member countries in their efforts to implement these measures within the
proposed timeframes. As binding policy decisions are taken by IEA member countries, this study
should evolve into a regular update on implementation plans.
The IEA Secretariat should also work with the non‐member economies that produce and export
significant volumes of electric motors and electric motor‐driven components to ensure that this
Page | 18
1.
Introduction
This report explores the complex and challenging world of electric motor‐driven systems (EDMS)
and makes recommendations for future policy settings to reduce electricity demand for EMDS in
a timely and cost‐effective manner.
Electric motors are used in a wide range of industrial applications, but also in many types of
applications in the commercial, residential, agricultural and transportation sectors. Typically
electric motors are a component in a motor system, responsible for converting electrical power
into mechanical power. Consumption of a motor system corresponds to electricity consumption
of its motors plus a small additional quantity to power system controls.
Prior to the analysis presented in this report, there have been very few attempts to estimate the
overall electricity consumption of electric motors and no systematic attempt to produce global
estimates. However, “back‐of‐the‐envelope” calculations have typically estimated that motors
use over 40% of all electricity (in 2005, more than 6 000 TWh at the global level). In fact, electric
motor‐driven systems appear to be the largest source of electricity use, far exceeding lighting,
the next largest end‐use (about 19% of global electricity demand).
It is surprising how few concerted studies have been directed at quantifying the energy use of
EMDS. This report attempts to provide a sounder basis for these estimates, using both top‐down
and bottom‐up analyses to increase confidence in the findings. It builds upon important regional
studies such as the European Union’s Lot 11 studies for the Eco‐design Directive (De Almeida
et al., 2008a [motors]; Falkner, 2008a [pumps]; Falkner, 2008b [circulator pumps]; Radgen, 2008
[fans]), US Department of Energy‐sponsored investigations (DOE, 2002), other North American
sources (Elliot, 2007; Boteler, 2007; NRCan, 2009), Japanese studies (JWG, 2007), Chinese studies
(Zhao, 2007) and other regional data sources.
Electric motors are found in the industrial, commercial, residential, agricultural and transportation
sectors.
In the residential sector, motors are used for compression (in refrigerators and air
conditioners), ventilation (to power fans); pumping (to power central heating system
circulation and hot and cold water pumps); cooking appliances (food mixers, whisks, oven
fans, extractor hoods); laundry; cleaning; ICT (hard disks and fans) and garden appliances.
Some less widespread residential applications (such as automatic gates and shutters) also use
motors.
In the commercial building sector, motors are used for heating, ventilating and air
conditioning (HVAC); pumping; ICT (hard drives and fans); escalators; lifts (elevators) and
hoists; laundry; cleaning and cooking.
In the agricultural sector, motors are used for pumping and conveyance activities.
In transportation, motors are used for motive power for electric trains, trucks, cars and motorbikes
and related cooling; ventilation and auxiliary devices; fluid pumping in vehicles shipping and
planes; HVAC applications; servo‐mechanisms in aviation and several other applications.
Yet it is in industry that electric motors dominate and account for the largest amount of total
electricity consumption. In industrial applications, motors are used for pumping; fans; air and
liquid compression; conveyance; and other forms of mechanical handling and processing.
Electric motor‐driven systems (EMDS) are by far the most important type of electric load in
industry. In the European Union, for example, they are estimated to account for about 70% of
all industrial electricity consumption.
Page | 19
electricity, but the amount of electricity required to fulfil its function is determined by the
amount of mechanical power required and the magnitude of the losses that occur in the delivery
of that power. Those losses occur not only within the motor itself but also – and usually more
significantly – in the mechanical system that distributes power from the motor to the final
mechanical application.
This report examines markets and use of electric motor‐driven systems and estimates their
electricity consumption by sector, application and country as well as at a global level. It reviews
the types of EDMS and analyses the different technologies in use and the potential to save
energy through better design, configuration and operation. It presents estimates of potential
energy savings and reduction of CO2 emissions and explores cost‐efficiency issues associated with
different motor‐system choices. It also examines barriers to the adoption and use of more
efficient EMDS and the various standards that have been developed to measure and improve
motor‐system electricity demand. It reviews existing and pending policy settings for motors and
motor‐driven systems and makes recommendations for future policy settings.
The findings of the report are consistent with and build upon the findings of earlier regional
studies. By drawing attention to the wide variety of means to increase efficiency of EMDS, the
study attempts to set out practicable pathways to increase energy savings and exploit
opportunities more effectively than under current policy settings. It proposes policy measures to
stimulate energy‐efficiency improvements in motor‐system components, core motor systems and
dedicated motor‐system applications and future activities to build international capacity to
Page | 20
2.
Electric Motor‐Driven Systems and Applications
This chapter describes technologies and applications of electric motor‐driven systems (EMDS),
summarises available market data (including information on sales and stocks of motors and
motor‐driven systems as a function of their efficiency), and explores the adoption of controllers
that match output to load, such as variable‐speed drives (VSDs).
Motor
system
types
and
definitions
An electric motor is a device that converts electrical energy into mechanical energy. Motors come
in output power ranging from a few watts up to many hundreds of kilowatts. In the recent EU
study under the Directive on Eco‐design of Energy‐Using Products, the product group is described
as electric motors in the output power range of 1 kW to 150 kW. However, the study considered
a lower bound of 0.75 kW and an upper bound of 200 kW to take into account standard power
sizes and the new proposed International Electrotechnical Commission (IEC) 60034‐30 efficiency
classification standard on motor efficiency. Almost all motors in this power range are of low
voltage. Medium‐voltage motors are typically used in very high power applications of >500 kW;
as they are of non‐standard design, they are sold in very small numbers and are not yet included
in any targeted energy‐efficiency policies. Electric motors are classified according to type of
power supply and other criteria (De Almeida et al.,2008a) (Figure 2).
Figure 2: Electric motor categories
Abbreviations: AC – alternating current; DC – direct current; EC – electronically commutated; PM – permanent magnet.
Source: De Almeida et al., 2008a.
EMDS
Applications
Motors are used in a myriad of applications, which are broadly categorised as follows:
Industrial applications: pumps, fans, compressed air delivery, conveyors, motive power for
other machinery, etc.
Building applications: pumps, fans, conveyors, lifts, compressors in heating, ventilation and
air‐conditioning systems, etc.
Page | 21
Table 3: EMDS applications showing relationships between systems and service
Electric motors
Application
Pumps Drinking water Water/refrigerant Sewage Oil
Rotating machines Closed loop Closed water supply system Heating, cooling and chilling system Pressure sewage system Hydraulic pumps Open pipe Water supply system Irrigation, cooling
tower Sewage system Pipeline
Fans Air Gas
Room air supply and exhaust,
blowers
Natural gas systems
Compressors Refrigerant Air Gas
Cooling machines for air conditioning and commercial freezers, refrigerators and freezers Compressed-air storage and distribution system, pneumatic systems Liquification systems Rotating/mix/
stir Roller, rotors Extruder Textile handling
Mixers, stirring
Solid Metal, stone, plastics Aluminium, plastics Weaving, washing, drying Food, colour, plastics
Liquid Food colour, plastics
Transport People Goods Vehicles
Vertical Passenger elevator Goods elevator, cranes, hoists
Inclined Escalator Conveyor cable car, ropeway Cog wheel train,
Horizont
al Conveyor Conveyor
Train, tram, trolley, cars, buses, electric cars, bikes
and bicycles
Linear motors Open/close Sort Grab and place
Back and forth
movement Valve Robot
Stepper motor Open/close Position
Angular position Valve Servo
Source: A+B International, 2009.
Motor
market
data
Following a review of data on motor sales, efficiency and stocks, this report considers motor
usage by end‐use system applications and examines market penetration of adjustable‐speed
drives (ASD) and variable‐frequency drives (VFD). Although few sources are available to
determine distribution of electric motors by end‐use application, data from the United States and
the European Union on different motor applications are included. Literature about different
applications is rarely available for other countries, except for some sales data for Japan and
Taiwan. Regional data sets are not easily comparable, as they have different scopes of study and
apply different definitions (for example, definitions may vary regarding whether a compressor is
Page | 22
Market
volumes
by
application
The share of motor sales by end‐use application in the United States appears quite different from
the situation in the European Union (Tables 4 and 5). Figures for US pump sales include only
pumps and vacuum pumps used in industry, and do not cover pumps used in commercial or
building sectors. Compressor data applies only to stationary compressors. The total is the sum of
these three applications. No data for any other applications is presented.
Table 4: Motor systems sales in the United States (2003)
Pumps Vacuum pumps Compressors Total
No. of units (thousands) 12 143 200 1 301 13 645
Sales value
(USD millions) 2 637 103 1 534 4 275
Note: Numbers may not sum to total due to rounding. Source: US Census Bureau.
Table 5: Motor systems sales in the European Union (2005)4
Pumps Circulators Fans Total
No. of units (millions) 1 800 14 000 8 927 24 727
Market share 7% 57% 36% 100%
Sources: Falkner, 2008a (pumps); Falkner, 2008b (circulator pumps); Radgen, 2008 (fans).
In the United States, more than 40% of general‐purpose industrial motors are used to drive
material processes, representing the largest share of motor applications. Other large groups are
pumps and material‐handling applications; compressors (compressed air, refrigeration) and fans
represent only minor shares (Table 7).
Table 6: Distribution of motor applications in the US industry sector (1997)
Pumps Fans Compressed
air Refrigeration
Material handling
Material
process Other All
Share of stock 19.7% 11.2% 5.1% 0.8% 16.8% 42.2% 4.2% 100.0%
Source: DOE, 2002.
Table 7: Stock data for three applications in the European Union (2005)
Pumps Fans Circulators Total
No. of units (millions) 17 104 10 131
Share of stock 13% 79% 8% 100%
Sources: Falkner, 2008a (pumps); Falkner, 2008b (circulator pumps); Radgen, 2008 (fans).
In the case of the European Union, the figure for circulators includes only large stand‐alone
circulators, and the figure for fans includes only building ventilation (no fans for process
ventilation etc. are included). In this limited context, fans account for the largest share – almost
80% – of the installed motor base (Table 7). Significant differences in the scope of available stock
data on motor applications make it difficult to draw direct comparisons between the United
States and the European Union.
4
Page | 23
Market
share
by
efficiency
Electric motor efficiency is the ratio of mechanical output power to electrical input power. The
weighted average efficiency of the running electric motor stock depends on:
size distribution of the motor stock;
relative shares of energy‐efficiency classes;
mandatory energy performance standards (MEPS) and other policy measures in place
(e.g. voluntary agreements) and their period of introduction/reinforcement.
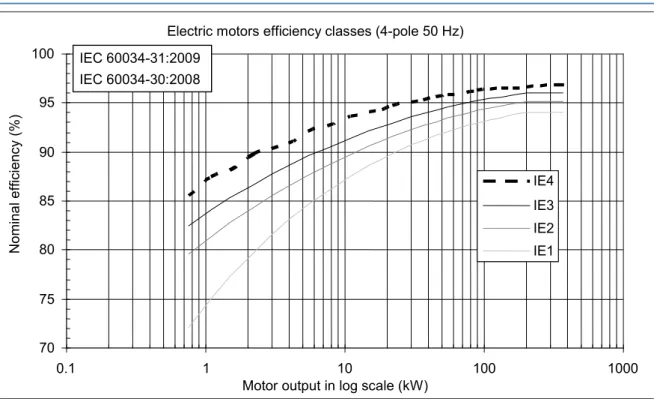
Figure 3: Efficiency classes for four‐pole motors of standard IE3, IE2 and IE1 classes, and the new IE4 class
Electric motors efficiency classes (4-pole 50 Hz)
70 75 80 85 90 95 100 0.1 1 10 100 1000
Motor output in log scale (kW)
Nomina l ef fici en cy (%) IE3 IE2 IE1 IEC 60034-31:2009 IEC 60034-30:2008 IE3 IE2 IE1 IE4
Source: IEC 60034‐30 and IEC 60034‐31, draft 2009.
The efficiency of motors depends both on their size and their efficiency quality, which can be
characterised by efficiency classes. For small motors, size is the most important factor in
determining efficiency; for large motors, efficiency classes are relatively more important. In 2008,
in IEC 60034‐30, the International Electrotechnical Commission introduced the precisely defined
and open‐ended international efficiency‐classification scheme using IE1, IE2, IE3 and IE45 as the
classification system (Figure 3).
In recent years, market share of more efficient motors has been increasing in many regions and
countries (Borg and Brunner, 2009). This was particularly the case for the United States, China and
other countries, and, to a certain extent, for Europe. To understand this diffusion pattern, it is
useful to relate different efficiency‐classification systems to each other, and to relate diffusion to
MEPS and other policy measures. Four standardised efficiency classes are currently recognised,
although definitions and classification schemes vary slightly from country to country (Table 8).
5
Page | 24
Table 8: Motor efficiency classes in different countries and the corresponding international standard
Motor efficiency class
International United States
European Union (old system 19981) European Union (new system 2009) China Australia
Premium IE3 Premium NEMA – IE3 – –
High IE2 EPAct Eff1 IE2 Grade 1 (under consideration) AU2006 MEPS
Standard IE1 – Eff2 IE1 Grade 2 AU2002 MEPS
Below standard
IE0 (used only
in this paper) – Eff3 –
Grade 3 (current
minimum) –
Abbreviations: EPAct – US Energy Policy Act, 1992; MEPS – minimum energy performance standard; NEMA – US National Electrical Manufacturers Association.
Source: A+B International, 2009.
Note: 1. With the backing of the European Commission, manufacturers representing 80% of the European production of standard motors, agreed to establish three efficiency bands or classes designated EFF1, EFF2, and EFF3, with EFF1 being the highest band.
When a new and higher motor‐efficiency class is introduced, it diffuses slowly into the national
market. The rate of diffusion depends on national motor producers, additional price, electricity
cost, financial incentives, MEPS, etc.
Table 9: Timeline for electric‐motor efficiency classes, testing standards and minimum energy performance
standards
Efficiency levels Efficiency classes Testing standard Performance standard
IEC 60034-30 IEC 60034-2-1 Mandatory MEPS
Global definition of motor
efficiency classes, IEC, 2008 Including stray load losses 2007 Policy goal
Premium efficiency* IE3 Low uncertainty United States 2001
Europe 2011
High efficiency IE2
United States Canada Mexico Australia New Zealand Korea Brazil China 2011 Switzerland 2011 Europe 2011 with VSD
Standard efficiency IE1
Medium uncertainty China
Brazil Costa Rica Israel Taiwan Switzerland 2010 Below standard
Source: A+B International, 2009.
The United States and Canada are international leaders in terms of setting motor energy‐
efficiency standards, as they introduced regulations for motors in the late 1990s. As early as
Page | 25
replace the previous industrial voluntary agreement. Australia, Korea, Brazil, Mexico, Taiwan and
some other countries with large electricity consumption from motors have already adopted
MEPS, as have some smaller economies such as Costa Rica, Israel and New Zealand (Table 9).
However, some large motor‐using economies, such as India, Japan and Russia, have not yet
adopted MEPS (such measures are understood to be under consideration).
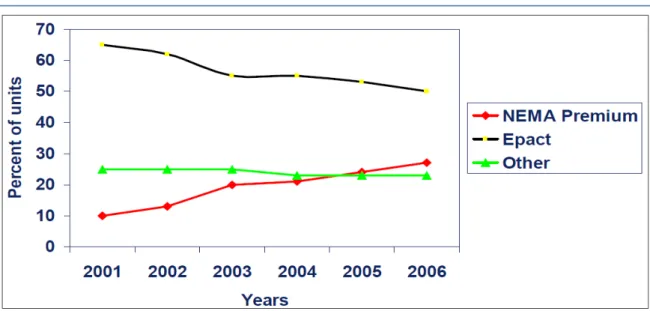
In the United States, market penetration of energy‐efficient motors has been increasing since the
late 1990s – particularly since 1998 when MEPS were enforced. In 2001, EPAct motors
(equivalent to IE2) reached a market share of about two‐thirds; this figure has since steadily
declined, as the US National Electrical Manufacturers Association (NEMA) Premium motors
started gaining market share (Figure 4).
Figure 4: Market share of efficiency classes in the United States (2001‐06)
Source: Boteler, 2007.
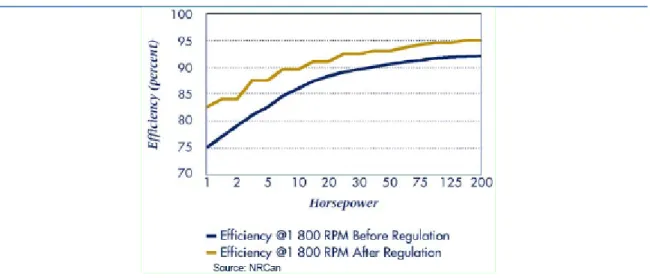
In Canada, the energy efficiency of motors is the responsibility of the ministry of Natural
Resources Canada (NRCan). In 1994, the Energy Efficiency Act was implemented and in 1997
Canada’s Energy‐Efficiency Regulations for General Purpose Industrial Motors came into effect
(Figure 5). In 1999, explosion‐proof and integral‐gear motors (which are not covered in the United
States) were also included. For motors in the range of 0.75 kW to 150 kW (1 hp to 200 hp),
regulation in Canada corresponds in principle to the MEPS of EPAct of the United States. However,
Canada also has some specific regulations, such as allowing the use of 75% load to pass MEPS.
In the United States, market introduction of the most efficient class IE3 (NEMA Premium) started
in 2002 and market share has grown steadily (Table 10). It was introduced as a voluntary product
but has been supported since 2006 by a federal procurement decision (the Federal Energy
Management Program [FEMP]).
Market penetration of different efficiency classes varies considerably between countries. The
share of the most efficient class (IE3) has reached 20% in the United States, but it is virtually zero
in the European Union. In the United States, the share of efficiency classes generally increases
with motor size (Table 11). The share of the most efficient class (IE3) reached 75% of sales for the
largest motor class; it was only about 10% for smaller motors. The diffusion of motors with higher
efficiency starts earlier for larger motors than for smaller ones, since more engineering time and
money is usually spent in the search for the best‐matching motor when a large motor has to