The shareholder approval requirement has encouraged the evolution of more balanced repricing approaches
Shareholder-Approved Underwater Option
Exchange Programs – A Study of Mutual
Fund Voting Patterns
By Brett Harsen, Vice President
January 2009
American corporations are awash in underwater employee stock options. According to the research firm Equilar, 72 percent of Fortune 500 companies are dealing with this contentious problem1. The last time the US experienced such an onslaught of underwater options was in 2001 after the high-technology sector bubble finally burst, following nearly a decade of exceptional growth. Faced with widespread employee morale and retention challenges, a significant number of companies executed underwater option exchange programs to address the problem. But this is not 2001. Once again companies are grappling with underwater options, except this time the business, shareholder and regulatory environment is radically different. Today companies operate under much greater scrutiny of compensation practices from
shareholders, the press and the public in general. Stock option repricing often elicits a negative reaction from all three constituencies due to past abuses, including aggressive programs meant to benefit only the employee option holder to the detriment of shareholders. The most significant result of blowback from aggressive repricings was the implementation of shareholder approval requirements by the NYSE and NASDAQ exchanges in 2003. Previously, companies enjoyed the ability to reprice options unilaterally unless the underlying equity plan expressly prohibited this action. Most plans were simply mute on the subject of repricings and therefore gave companies default permission to reprice on their own. But today a company’s plan must expressly permit
The upcoming 2009 proxy season will bring an
unprecedented number of underwater
exchange proposals
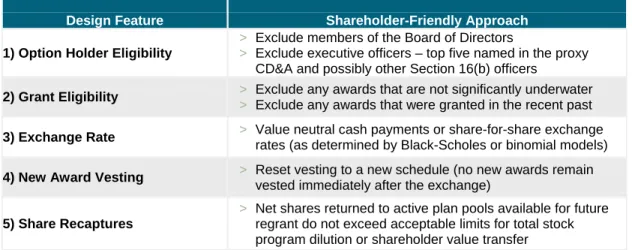
Figure 1 – Shareholder-Friendly Exchange Terms
Design Feature Shareholder-Friendly Approach
1) Option Holder Eligibility
> Exclude members of the Board of Directors
> Exclude executive officers – top five named in the proxy
CD&A and possibly other Section 16(b) officers
2) Grant Eligibility > Exclude any awards that are not significantly underwater
> Exclude any awards that were granted in the recent past
3) Exchange Rate > Value neutral cash payments or share-for-share exchange rates (as determined by Black-Scholes or binomial models) 4) New Award Vesting > Reset vesting to a new schedule (no new awards remain
vested immediately after the exchange) 5) Share Recaptures
> Net shares returned to active plan pools available for future
regrant do not exceed acceptable limits for total stock program dilution or shareholder value transfer
The shareholders’ required involvement in addressing widespread underwater options means the upcoming 2009 proxy season will bring an unprecedented number of underwater exchange proposals. Indeed, Radford has been fielding a record number of client inquiries and consulting engagements to assess underwater option alternatives leading up to annual shareholder meetings. In an effort to quantify the probability of a successful shareholder proposal, we have developed a research database of actual shareholder voting patterns. This Radford Review summarizes our research methodology and high-level findings to assist clients in determining the viability of completing a shareholder-approved underwater exchange program.
Methodology
In 2004, rules were implemented requiring mutual funds to disclose their proxy voting once a year via an N-PX filing with the US Securities and Exchange Commission (SEC). Mutual fund voting data for this research was provided by RiskMetrics Group’s Voting Analytics® database. Radford has combined these voting results with our proprietary database of underwater exchange design features gleaned from SEC tender offer filings. The result is a comprehensive analysis of correlations between exchange program design parameters and ultimate shareholder judgment. Additional statistics on the scope of Radford’s master database include:
> Records from 172 investment firms voting on 29 underwater exchange proposals > 2,410 actual votes analyzed (multiple mutual funds from one institution may have voted) > Shareholder meetings that took place between April 2006 and June 2008
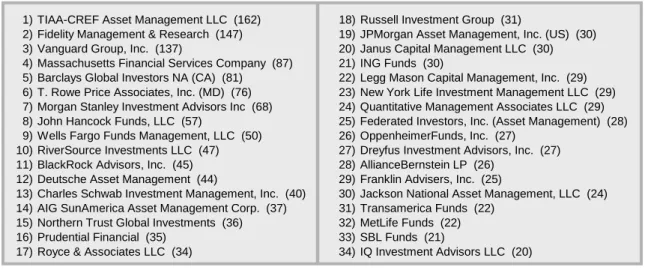
The results summarized in this Radford Review will focus on only those investment firms that have voted on at least 20 underwater exchange proposals. Defining this subset provides greater confidence that analysis conclusions are based on the voting patterns of investors with
considerable experience addressing underwater employee options. Figure 2 details the list of 34 investors fitting these criteria, sorted high-to-low based on number of votes cast among all funds.
This research is most valuable to companies that are largely held by institutional investors and mutual funds
Figure 2 – Top 34 Most Active Underwater Exchange Voters (number of votes among all funds in parentheses)
When reviewing our findings, it is important to keep in mind that we are only reporting the approval rates of these 34 investment firms. In other words, the approval rate refers to the percent of “for” votes cast each time an individual fund had an opportunity to weigh in on an underwater exchange proposal. Further, each investment firm may have had multiple funds voting on the same company’s exchange proposal (see Footnote 3 for the list of companies that submitted underwater option exchange proposals to shareholders in this analysis).
We are not referring to the proposals’ overall approval rates because the vast majority of
exchange proposals – 93 percent in this study – were approved by a majority of all shareholders voting. Analyzing such overall program approval rates would be meaningless as nearly every exchange proposal passed regardless of its design features.
In light of such overwhelming majority shareholder approval rates, one might question the purpose of our analysis – why scrutinize select institutional investors when the programs overall seem to pass without much resistance? Our response is the conclusion that underwater exchanges nearly always pass is erroneous due to sampling error. Examining only those companies that have taken such proposals to shareholders represents a fundamental sampling bias that ignores organizations that considered such a program but did not take it to shareholders because of a low probability it would pass. Companies that do put an underwater proposal in their proxy are likely only those confident it would be approved based on knowledge of their own shareholders and investigations performed prior to submitting the proposal. Unfortunately, we are limited to information publicly filed with the SEC, requiring us to work with this sampling bias. Those that only considered but backed down from an underwater exchange proposal are not identifiable.
There are many reasons why a company might be confident that its exchange program would pass prior to filing the proposal publicly. In most cases, the company is closely held by relatively few investors. Lines of communication may be more open to such a relatively small group of
1) TIAA-CREF Asset Management LLC (162) 18) Russell Investment Group (31)
2) Fidelity Management & Research (147) 19) JPMorgan Asset Management, Inc. (US) (30) 3) Vanguard Group, Inc. (137) 20) Janus Capital Management LLC (30) 4) Massachusetts Financial Services Company (87) 21) ING Funds (30)
5) Barclays Global Investors NA (CA) (81) 22) Legg Mason Capital Management, Inc. (29) 6) T. Rowe Price Associates, Inc. (MD) (76) 23) New York Life Investment Management LLC (29) 7) Morgan Stanley Investment Advisors Inc (68) 24) Quantitative Management Associates LLC (29) 8) John Hancock Funds, LLC (57) 25) Federated Investors, Inc. (Asset Management) (28) 9) Wells Fargo Funds Management, LLC (50) 26) OppenheimerFunds, Inc. (27)
10) RiverSource Investments LLC (47) 27) Dreyfus Investment Advisors, Inc. (27) 11) BlackRock Advisors, Inc. (45) 28) AllianceBernstein LP (26)
12) Deutsche Asset Management (44) 29) Franklin Advisers, Inc. (25)
13) Charles Schwab Investment Management, Inc. (40) 30) Jackson National Asset Management, LLC (24) 14) AIG SunAmerica Asset Management Corp. (37) 31) Transamerica Funds (22)
15) Northern Trust Global Investments (36) 32) MetLife Funds (22) 16) Prudential Financial (35) 33) SBL Funds (21)
It appears some investors vote against any form of underwater
exchange on principal
Summary Findings
Figure 3a illustrates the five investment firms with the highest approval rates for underwater exchange proposals while Figure 3b provides those with the lowest approval rates. From the data in Figure 3b, it appears that some investors vote against any form of underwater exchange, regardless of how shareholder-friendly the terms may be. Conversely, Figure 3a demonstrates that some investors seem very receptive to such programs.
Figure 3a – Top 5 Investors for Underwater Exchange Approval
Investment Firm
Number of Proposals Voted
(all funds) Approval Rate
RiverSource Investments LLC 47 91%
Russell Investment Group 31 87%
Wells Fargo Funds Management LLC 50 86%
Prudential Financial 35 83%
Jackson National Asset Management LLC 24 75%
Figure 3b – Bottom 5 Investors for Underwater Exchange Approval
Investment Firm
Number of Proposals Voted
(all funds) Approval Rate
Deutsche Asset Management 44 2%
BlackRock Advisors 45 2%
ING Funds 30 0%
Quantitative Management Associates LLC 29 0%
IQ Investment Advisors 20 0%
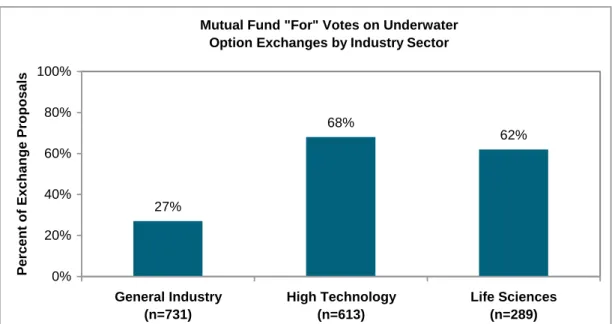
When looking at approval rates among the studied investment firms, we find a marked difference between general industry and high technology or life sciences [Figure 4]. The likeliest
explanation is that shareholders are more amenable to addressing broad-based employee stock options than they are executive stock options. While some general industry companies have strong equity cultures that extend options to lower-level employees, broad-based programs are much more prevalent in high technology and life sciences.
We find a marked difference between general industry and high technology or life sciences in shareholder approval rates Shareholders may be less willing to approve repricings when the market is down overall
Figure 4 – Underwater Exchange Approval by Industry Sector
Mutual Fund "For" Votes on Underwater Option Exchanges by Industry Sector
27% 68% 62% 0% 20% 40% 60% 80% 100% General Industry (n=731) High Technology (n=613) Life Sciences (n=289) Per cent of Exchange Pr oposals
In examining approval rates for underwater exchange proposals by year, we find a significant drop off from 2007 to 2008 [Figure 5]. For those companies looking to include such a proposal for upcoming shareholder meetings, this trend is worrisome as it implies a decreasing tolerance for repricings. Lower tolerance may correspond to stock market performance in general – shareholders may be less willing to approve repricings when the market is down overall and their portfolios are feeling greater pain.
Figure 5 – Underwater Exchange Approval by Year
Mutual Fund "For" Votes on Underwater Option Exchanges by Year
47% 69% 31% 0% 20% 40% 60% 80% 100% Per cent of Exchange Pr oposals
Companies seeking to improve their chances of program approval would be prudent to seek their shareholders’ view on exchange approach
Further, when we posed the question to other experts, none were aware of any formal policies from investment firms stating a preference for restricted stock over options for use in underwater exchanges. In general, we advise our clients that the vehicle used in an underwater option exchange should be consistent with the company’s ongoing equity program philosophy. For example, if a company has already moved from options to restricted stock for its annual employee awards, using restricted stock to swap out underwater options is explainable and defensible to shareholders. Conversely, if the first time the company uses restricted stock is for an underwater exchange, it may appear inconsistent – or worse, as a way to guarantee downside protection for a company that otherwise touts growth alignment as an objective of its stock program.
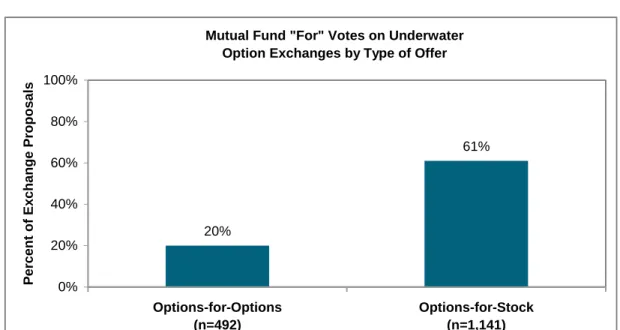
There are a multitude of other factors influencing shareholder voting including who is eligible for the exchange, what options may be tendered, exchange ratios and other design features discussed in detail later in this review. Still, companies seeking to improve their chances of program approval would be prudent to seek their shareholders’ view on using options versus stock in the exchange prior to finalizing any proposal.
Figure 6 – Underwater Exchange Approval by Approach Used
Mutual Fund "For" Votes on Underwater Option Exchanges by Type of Offer
20% 61% 0% 20% 40% 60% 80% 100% Options-for-Options (n=492) Options-for-Stock (n=1,141) Per cent of Exchange Pr oposals
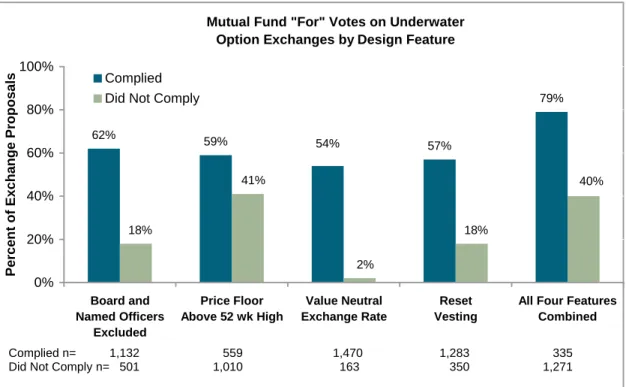
Our final analysis attempts to test the materiality of the first four shareholder-friendly design features outlined in Figure 1 (note the fifth feature discussed lacks a clear bright line test for our study, but is discussed later in this Radford Review). For each of these features, we calculated the approval rates for proposals that complied to the shareholder-friendly approach and those that did not comply [Figure 7].
The highest approval rates (79 percent of
proposals) came when all four design features followed the shareholder-friendly approach
Figure 7 – Shareholder Approval Rates for Underwater Option Exchanges by Design Feature
Mutual Fund "For" Votes on Underwater Option Exchanges by Design Feature
62% 59% 57% 79% 54% 18% 41% 2% 18% 40% 0% 20% 40% 60% 80% 100% Board and Named Officers Excluded Price Floor Above 52 wk High Value Neutral Exchange Rate Reset Vesting
All Four Features Combined Per cen t of Exchange Pr oposals Complied Did Not Comply
Overall, we can confirm that approval rates were higher when any of the four design features complied with the shareholder-friendly approach vs. non-compliance. Further, we find that the highest approval rates (79 percent of proposals) came when all four design features followed the shareholder-friendly approach.
Feature #1 – Exclusion of Board and Named Executive Officers
Not surprising, eligibility of members of the Board of Directors and the Named Executive Officers (NEOs), those listed in the proxy’s summary compensation table, proved pivotal to shareholder approval. Sixty-two percent of programs excluding these company leaders gained approval compared to only 18 percent including them. In fact, 60 percent of the mutual funds studied voted against any program brought to them that included the Board and NEOs.
Not all investors seem to have had a hard and fast rule against the eligibility of these groups, however. For a select few, historic voting seems to indicate the opposite – evidence of a preference for the inclusion of Board members or NEOs:
> Massachusetts Financial Services approved 100 percent of the programs including Board or
NEOs (16 votes cast), but only 35 percent of programs excluding them (71 votes cast)
> Franklin Advisors approved 89 percent of the programs including Board or NEOs (nine votes
cast), but only 25 percent of programs excluding them (16 votes cast)
Complied n= 1,132 559 1,470 1,283 335 Did Not Comply n= 501 1,010 163 350 1,271
Returning an equal or lesser fair value to option holders as a result of the exchange is clearly a “make or break” requirement to the shareholders in our study
Feature #2 – Price Floor Above the 52-Week High Stock Price
Shareholders have long held the view that only significantly underwater options should be included in an exchange program. Stock options are long-term incentive vehicles and repricing those that have a reasonable probability of coming back in the money in the foreseeable future is inappropriate, in many investors’ view. At what price to establish this floor for award eligibility, however, has been a subjective judgment call until RiskMetrics recently weighed in on the issue. Starting in 2008, RiskMetrics added to their published voting guidelines a requirement that no options priced under the company’s 52-week stock price high should be eligible for exchange. Initially, RiskMetrics’ spokespeople assured us this was a guideline and not a hard and fast rule. However, recent experience reviewing client proposals intended for upcoming proxies with RiskMetrics has convinced us that in 2009 this is indeed a deal-breaking design parameter for this particular institutional investor advisor. This is disheartening for many companies where RiskMetrics has significant influence over the investor base, since the market plunge we experienced this past fall means the majority of underwater options are often below the current 52-week high. In such cases, these organizations may be forced to wait until the fall of 2009 before the 52-week high will drop to a level such that they are able to address most of their underwater options.
While this hurdle looks to be truly bearing its teeth for the first time in 2009, we still analyzed historic voting patterns against the 52-week test in our analysis. Historically speaking, it appears to be the least sensitive predictor of approval rates with 59 percent approval when programs comply and still 41 percent approval when they do not.
Feature #3 – Value Neutral Exchange Rate
Returning an equal or lesser fair value to option holders as a result of the exchange is clearly a “make or break” requirement to the shareholders in our study. While 54 percent of programs using approximately value-neutral exchange rates gained approval, very few (two percent) were approved using a ratio (or ratios) that added value to the employee’s holdings as a result of the exchange.
A program was deemed value neutral for purposes of this analysis if the average ratio offered was greater than 1:1 for option-for-option programs, or greater than 2:1 for an options-for-stock program. Calculating the actual value exchange of each program analyzed was not feasible for a research project of this scale. In our experience assisting many clients with assessing the neutrality of exchange ratios using valuation methodologies typically employed by shareholders, we feel this is a reasonable approach for purposes of this study. For more information on typical exchange rates used, please refer to other research and white papers provided on our free underwater exchange website.2
Feature #4 – Reset Vesting
The fourth design feature analyzed is whether or not the new shares granted in the exchange have vesting reset with a new schedule applied. Shareholders generally wish to see this
additional employee retention in lieu of “mapping” vesting credit from the old award directly to the new awards. Such mapping results in some or all of the new awards being fully vested at the time of grant, providing little or no retention and potentially rewarding employees for only short-term swings in company stock value. Our research finds that vesting treatment is a feature with similar shareholder approval sensitivity to Board or NEO inclusion. Programs that reset vesting enjoyed an approval rate of 57 percent while those that mapped vesting saw only 18 percent approval.
The dynamic business and shareholder environment demands we continually measure the pulse of our investor base through frequent and open dialogue
Treatment of Net Share Recaptures
As previously mentioned, there is a fifth feature outlined in Figure 1 that has not yet been
addressed: treatment of net shares recaptured through the exchange. In most cases, underlying equity plans allow for the net difference in shares tendered vs. new shares granted to return to plan pools and be available for future awards. In general, shareholders would prefer to see those net shares permanently retired, thus decreasing the total potential dilutive impact of the
company’s equity program overall.
Alternatively, RiskMetrics’ current practice in assessing these programs for their constituents is to apply a more sophisticated analysis to assess the acceptability of returning net recaptures to plan pools. They measure the potential value of all shares used for employee equity programs via a Shareholder Value Transfer (SVT) calculation and compare it to a maximum allowable cap based on industry and market capitalization. Those companies concerned with RiskMetrics’ influence over their shareholder base will have this SVT cost assessed before the shareholder meeting, and if the cap is exceeded, will commit to retiring some or all net recaptures in order to gain a favorable vote recommendation. This SVT analysis is a proprietary calculation that we won’t attempt to replicate in this study. Further, not all shareholders use RiskMetrics’ advisory services and have their own guidelines with respect to how net shares should be handled.
We can, however, provide data on whether programs committed to retiring the net shares. We found that 67 percent of companies in our study returned some or all of the net shares to plan pools and 33 percent permanently retired the net shares so they could not be regranted in the future.
Conclusion
Our research has found that when underwater exchange programs are designed with shareholder-friendly features, institutional investors have been more supportive of approving these plans. But in the end, we have still seen the vast majority– more than 90 percent – of these proposals ultimately are approved by a majority of all shareholders.
The most important takeaway may be that while such studies of historic patterns are important due diligence for those considering an underwater exchange, they are not guaranteed predictors of future shareholder voting decisions. Indeed, the dynamic business and shareholder
environment demands that companies continually measure the pulse of their investor base through frequent and open dialogue. Although Radford intends to keep this research updated, mutual funds are only required to file their voting histories once a year. Much can change between such infrequent disclosures. To underscore this, we need only point to the upcoming proxy season that promises to present investors with more underwater exchange proposals than at any previous period.
Come June 2009, we may have to revise many of the findings highlighted in this study. If we were to make a prediction based on our real-time experience with a multitude of these engagements we are involved with today, we believe the importance of complying with the shareholder-friendly design features discussed in this study will only increase in the coming months.
For more information, contact Brett Harsen at +1 312.381.3685 Footnotes 1
For more information on Equilar, contact Alexander Cwirko-Godycki, Research Manager at +1 (650) 286-4567.
2
See Radford’s white paper “Addressing Underwater Options – Measured Responses to a Contentious Problem” available for download at www.UnderwaterExchange.com.
3
List of 29 companies with underwater option exchange proposals to shareholders in this analysis:
Applied Micro Circuits iCAD Photon Dynamics
Boston Scientific Internap Network Services Pixelworks
Builders Firstsource IXIA R.H. Donnelley
CBS Kintera Strayer Education
Cell Genesys K-Swiss Symyx Technologies
Credence Systems LeapFrog Enterprises Tapestry Pharmaceuticals
Electronic Arts M.D.C. Holdings Toll Brothers
Entercom Communications Mercury Computer Systems UTStarcom Genesis Microchip North American Scientific Williams-Sonoma Harris Interactive Occulogix
About the Author
Brett Harsen, Vice President
Brett is a Vice President at Radford and has more than 10 years of experience in executive and broad-based equity compensation consulting. In his current role, Brett leads Radford Analytic Services, providing customized market analyses and compensation program support. He is a frequent writer and speaker on equity-related topics, and has been quoted on the subject of underwater options in The Wall Street Journal,
Financial Week and many other publications. Brett co-leads Radford’s underwater option consulting practice and has assisted many organizations in the successful implementation of underwater option exchange programs including: Adobe, Advanced Micro Devices, Agere, Agilent Technologies, Apple, BMC Software, LSI Logic, Lucent, Novell, Rackable Systems, Radisys, Skyworks Solutions, Strayer Education and others.
Research supporting this Radford Review was contributed by Dan Kapinos, Analyst with Radford Valuation Services.
About Radford
For more than 30 years, Radford has provided compensation market intelligence to the high-technology and life sciences industries. Global survey databases, which include nearly 3.5 million incumbents, offer current, reliable data to 2,000+ clients. Leveraging Radford survey data, our thought-leading Radford Consulting team creates tailored solutions for the toughest global business and compensation challenges facing companies at all stages of development. In addition to our consulting team, we also offer SFAS123(R) equity valuation assistance via Radford Valuation Services, and market-leading analyses and survey services with Radford Analytic Services. For more information on Radford, please visit www.radford.com.
About Aon Consulting
Aon Consulting Worldwide (http://www.aon.com/hcc) is among the top global human capital consulting firms, with 2007 revenues of $1.352 billion and 6,335 professionals in 117 offices worldwide. Aon Consulting is shaping the workplace of the future through benefits, talent management and rewards strategies and solutions. Aon Consulting was named the best employee benefit consulting firm by the readers of Business Insurance magazine in 2006 and 2007.
About RiskMetric’s Voting Analytics®Database
RiskMetrics’ Voting Analytics ® provides access to the proxy voting policies and records of the largest institutional investors in the US, with four years of vote records for over 12,000 funds in more than 100 of the top US mutual fund complexes matched to five years of voting results for Russell 3000 companies'
meetings. In addition, Voting Analytics includes votes as disclosed in 24 other countries including the United Kingdom. For more information, visit: http://www.riskmetrics.com/voting_analytics/benefits.