(will be inserted by the editor)
The original publication is available at www.springerlink.com
Flow rate limitation of steady convective dominated open
capillary channel flows through a groove
Dennis Haake · Joerg Klatte · Aleksander Grah · Michael E. Dreyer
Received: date / Accepted: date
Abstract An open capillary channel is a structure that establishes a liquid flow path when the capillary pres-sure caused by surface tension forces dominates in com-parison to the hydrostatic pressure induced by gravita-tional or residual accelerations. To maintain a steady flow through the channel the capillary pressure of the free surface has to balance the pressure difference be-tween the liquid and the surrounding constant pressure gas phase. Due to convective and viscous momentum transport the pressure along the flow path of the liquid decreases and causes the free surface to bend inwards. The maximum flow rate through the channel is reached when the free surface collapses and gas ingestion occurs near the outlet. This stability limit depends on the ge-ometry of the channel and the properties of the liquid. In this paper we present an experimental setup which is used in the low-gravity environment of the Bremen Drop Tower. Experiments with convective dominated systems have been performed where the flow rate was increased up to the maximum value. In comparison to this we present a one-dimensional theoretical model to determine important characteristics of the flow, such as the free surface shape and the limiting flow rate. Fur-thermore we present an explanation for the mechanism of flow rate limitation for these flow conditions which is similar to the choking problem for compressible gas flows.
Keywords Free Surface Flow· Capillary Channel· Critical·Convective Dominated·Microgravity
D. Haake·J. Klatte·A. Grah·M. E. Dreyer Center of Applied Space Technology and Microgravity Am Fallturm, 28359 Bremen, Germany
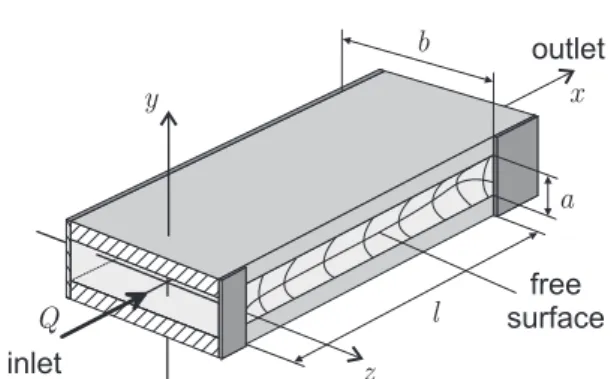
Tel.: +49-421-218-4038 Fax: +49-421-218-2521 E-mail: [email protected] free surface inlet outlet Q a b l x y z
Fig. 1 Schematic drawing of the flow with a constant flow rate
Qthrough a groove of widtha, depthband lengthl.
1 Introduction
Open capillary channels are used in a number of ap-plications related to space liquid management, i.e. heat pipes in the thermal systems and propellant manage-ment devices (PMD) in surface tension tanks of satel-lites. Concerning the latter, open channels are often used for transport and positioning of liquid propellants (see e.g. in [1] or [2]).
Rosendahl et al. (2004) [3] found a flow limitation in open capillary channels which is similar to choking in compressible duct flows and open channel flows under gravity. In this work we want to expand this theory to other channel geometries.
In our investigation the capillary channel consists of two parallel glass plates with a free surface at one side and a closed plate at the other side (see Fig. 1), hereinafter referred to as groove. The liquid flows along thex-axis from the inlet to the outlet and forms a free surface at the open side between the plates. The flow is maintained by an external pump while the free surface deforms corresponding to the pressure along the flow path.
For an internal pressurep lower than the ambient pressure pa, the free liquid surface is concave at any
cross section, as shown in Fig. 1. The pressure decreases in flow direction due to convective and viscous momen-tum transport so that the curvature of the surface in-creases and the flow path constricts. A steady flow is obtained only for a flow rate Q below a critical value Qcrit. ForQ > Qcritthe liquid surface collapses at the
channel outlet and the flow changes from steady single-phase flow to unsteady two-single-phase flow.
To minimize the influence of the hydrostatic pres-sure on the capillary channel the experiments have been performed in the microgravity environment of the Bre-men Drop Tower.
2 Theoretical model
For the theoretical model the flow is considered as in-compressible and laminar with a Newtonian, perfectly wetting liquid. The gap distance, the width of the par-allel plates and the length of the open channel are de-noted bya,bandl, respectively. The model is restricted to steady single-phase flow conditions with subcritical flow rates (Q < Qcrit). The flow along the channel axis
xis assumed to be one-dimensional and is characterized by the mean velocityvand the liquid pressure p.
2.1 Scaling and characteristic numbers
Here and in the following all variables are considered non-dimensional. In our model all lengths are scaled with a quarter of the hydraulic diameter of the open channel, except the x-direction, which is scaled with the channel lengthl. The hydraulic diameterdhof the
groove is defined as [4] dh=
4ab
2b+a. (1)
The curvature of the free surfacehis scaled by 4/dhand
the pressurepby 4σ/dh, whereσis the surface tension
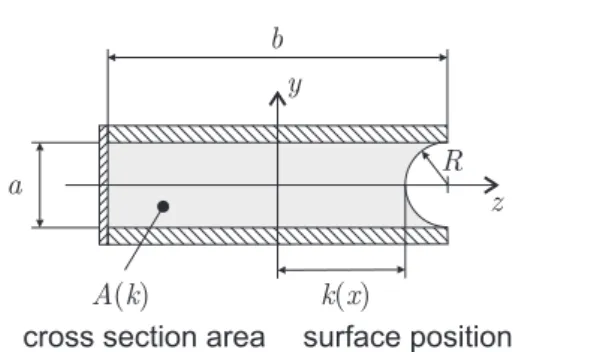
of the fluid. The cross section area of the groove A, which is shown in Fig. 2, is scaled by the inlet cross section area A0=ab and velocities are scaled with the
characteristic velocity (see Dreyer (2007) [5]) vc =
r
4σ ρdh
, (2)
whereasρdenotes the fluid density. The flow rateQis scaled withA0vc.
The describing characteristic numbers are the Ohne-sorge number Oh = s ρν2 σdh , (3) y z R k x( ) cross section area
A k( )
surface position
a
b
Fig. 2 Cross section of the capillary channel in the (y, z)-plane at constantx.
the dimensionless channel length ˜
l=Ohl 2dh
, (4)
and the aspect ratio Λ= b
a. (5)
The Ohnesorge number can be expressed as a Reynolds number, based on the characteristic velocityvc, thus
Oh = 2 Rec
with Rec=
dhvc
ν , (6)
whereasν denotes the kinematic viscosity.
2.2 Governing equations
The first equation is the dimensionless Bernoulli equa-tion [6] including a fricequa-tion term wf, differentiated in
flow directionx dp dx+v dv dx+ dwf dx = 0. (7)
The first term is the pressure gradient in x-direction, the second term specifies the convective acceleration due to area changes, and the third term is the irre-versible pressure loss due to viscous forces which is for a fully developed flow
dwf dx = Kpf 2 ˜ lv. (8)
Therein,Kpf is the laminar friction factor for
rectan-gular ducts, which is a function of the channel gap ratio Λ[6].
The second equation is the dimensionless conserva-tion of mass for an incompressible fluid
dQ dx =A dv dx+v dA dx = 0. (9)
To calculate the cross-sectional area A in the (y, z)-plane a constant radius R is assumed at each cross-section (Fig. 2). Therefore the cross-cross-section area is a function of the minimal contour valuek, one of the main variables of the following differential equation system.
The detailed derviation of the goverining equation for A(k) can be found in Haake et al.(2006) [7].
The convective term of the Bernoulli equation [Eq. (7)] can be rewritten as vdv dx =− Q2 A3 dA dx, (10)
applying the conservation of mass [Eq. (9)].
Assuming zero normal and tangential stresses at the free surface and a passive overlaying gas, the capillary pressure p−pa =−h=− 1 R1 + 1 R2 (11) is related to the curvature of the free surface by the Gauss-Laplace equation [8], whereh/2 is the mean cur-vature of the liquid surface. Here, R1 and R2 are the
principal radii of the free surface curvature.R1is the
ra-dius of curvature in a plane perpendicular to the (x, z)-plane containing the normal of the free surface aty= 0. R2 is the radius of curvature in the (x, z)-plane [3].
Since the ambient pressurepa is constant, the pressure
gradient reads dp
dx =− dh
dx. (12)
To solve the differential equation, the mean curva-ture h must be defined as a function of the surface position k and its derivatives in x-direction. The as-sumption of symmetry with respect to the (x, z)-plane reduces the general form of the mean surface [9] to h(x, y= 0) = 1 R1 + Γ 2d2k/dx2 h 1 +Γ2(dk/dx)2i3/2 (13)
with the coefficient Γ =dh
4l. (14)
Again, if a constant radius at the mean curvature plane for R1 is assumed, the principal radius of surface
cur-vature R1 is a function of k only [7]. This assumption
disagrees with the earlier assumption of a constant ra-dius in the (y, z)-plane, but reduces the complexities of this problem from 3-D to 1-D. Anyway, in this context the accuracy has been proved by 3-D solutions of the mean surface curvature equations (Klatte et al.[10]).
Substituting the capillary pressure (Eq. (12)), the convective term (Eq. (10)) and the pressure loss (Eq. (8)) into the Bernoulli equation (Eq. (7)), and applying Eq. (13) yields the final equations
dh dx+ Q2 A3 dA dk dk dx− Kpf 2 ˜ lQ A = 0 (15) and Γ2d 2k dx2 + 1 R1 −h " 1 +Γ2 dk dx 2#3/2 = 0. (16)
Together with the equations forA(k) and R1(k), this
differential equation system can evaluate the contour functionk(x) and the mean curvature pressureh(x).
2.3 Boundary conditions
The boundary conditions are given by the pinned sur-face at the edges of the channel inlet and outlet k(x= 0) =k(x= 1) = 2Λ+ 1
2 (17)
and the surface curvature at the channel inlet
h(x= 0) =h0. (18)
The exact determination of the channel inlet curvature h0 is described in Sec. 3.1.
2.4 Numerical procedure
For the numerical solution of the coupled nonlinear system (Eq. (15) and Eq. (16)) we treat h and k as variables and use second order central differences. The steady flow solution is solved with a damped Newton method and yields the liquid surface position k(x) = f(Oh, Λ,˜l, Q) as well as the velocity v(x), the cross-sectionA(x), and the curvatureh(x) with the same de-pendence. As the numerical critical flow rateQnum
crit , we
define the maximum flow rateQleading to the conver-gence of the numerical algorithm with a relative error of 10−8 [see also Grahet al. (2008)] [11].
3 Experimental setup
The experimental setup has been developed to operate with the new catapult system within a drop capsule at the Bremen Drop Tower which is presented in Fig. 3. With the catapult system the free fall time can be dou-bled and provides a microgravity time of about 9.35 s with a residual acceleration less than 10−5g.
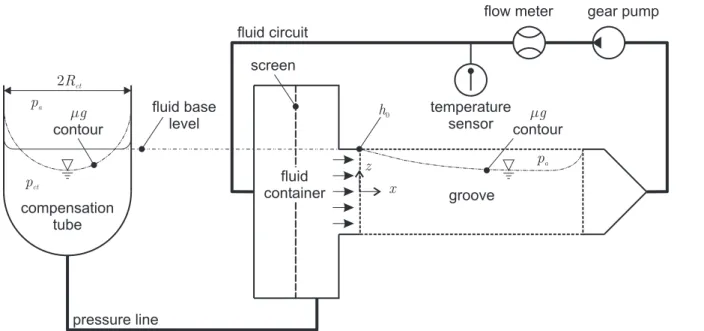
Fig. 4 shows a schematic drawing of the experimen-tal setup. The experimenexperimen-tal setup consists of a fluid container filled with test liquid and the groove which is fixed upright on the reservoir. A pump enables a closed fluid circuit. The pump withdraws the liquid at the out-let of the groove and feeds it into the fluid container. Before entering the groove, the flow is accelerated and rectified by a nozzle. Differences in volume after gas ingestion are balanced by the compensation tube.
To guarantee gas-free liquid supply to the groove a screen is installed in the fluid container for the case that the setup is running at supercritical conditions with gas ingestion.
compensation tube fluid container screen gear pump flow meter groove pa pa temperature sensor fluid base level mg contour mg contour fluid circuit pressure line pct 2Rct h0 x z
Fig. 4 Schematic drawing of the experimental setup with the test channel (dashed), the compensation tube, and the fluid circuit.
Fig. 3 Drop capsule with integrated experimental setup.
In the fluid container the pressure is predetermined by the curvature of the free surface in the compensation tube and the ambient pressure pa. The boundary
con-dition of the inlet curvature of the groove h0 depends
on the pressure in the fluid container, the convective and the frictional flow losses in the nozzle.
3.1 Channel inlet boundary condition
Due to the complex geometry, no analytical data for the determination of the boundary conditionh0 are
avail-able in sufficient accuracy and a direct measurement was not possible. For this reason, we performed three-dimensional model computations using the volume of fluid code FLOW-3D (TM) (Version 8.1.1, Flow Sci-ence Inc.).
The curvature at the channel inlet h0 is defined by
the capillary pressure of the meniscus in the compen-sation tubepctincluding convective and frictional flow
losses inside the liquid reservoir and the nozzle. The pressure loss is linear versus the Reynolds number [6] and the regression of the numerical data yields the re-lation h0= K1 2 Q 2+K2Oh 4 Q+K3 (19) with K3= 2 Rct . (20)
Therein Rct is the dimensionless radius of the
com-pensation tube. The values of K1,2,3 are K1 = 1.49,
K2= 383 and K3= 0.159.
In order to obtain the best approximation to the one-dimensional model assumption, the flow path from the fluid container to inlet of the open capillary chan-nel was optimized. The three-dimensional model com-putations led to a nozzle with a rectangular inlet cross
glass plate x z pneumatic slide nozzle suction head b l Q
Fig. 5 Schematic drawing of the groove channel with the pneu-matic slide.
section (30×50 mm2) that converges to the channel
cross section. The nozzle has an elliptical shape in the (x, y)-plane but no constriction in the (x, z)-plane and a length of 40 mm. With this shape, the lateral veloc-ity components in the channel entrance cross section are minimized to less than 2% of the longitudinal com-ponent.
3.2 Experiment procedure
In Fig. 5 a detailed sketch of the capillary groove chan-nel is presented. The three closed sides of the groove consist of three quarz glass plates which are glued to-gether. Beyond the free surface area the open side is covered by a thin wettable tape of the company 3M (TM). This tape provides a well-defined open length l and sharp pinning edges for the free surface at the in-and outlet (Fig. 7b)). The pneumatic slide is mounted above the tape and is able to open and close the free surface area by a fast lateral motion.
In the initial configuration the channel is closed by the pneumatic slide and the flow is established through the closed channel with the desired constant volumet-ric flow rateQ. The channel is closed to minimize the perturbation on the fluid flow due to the initial acceler-ation of the drop capsule with the catapult system. At the beginning of the free fall period of the capsule the pneumatic slide moves away. Within the 9 s of free fall time the reorientation of the free surface and the fluid flow in microgravity conditions can be observed.
To determine the experimental critical flow rateQexpcrit, several experiments at different flow rates must be per-formed. The experimental critical flow rateQexpcrit is de-fined by
Qexpcrit=12 Qstmax+Qunstmin
, (21)
where Qst
max is the highest flow rate with steady flow
and Qunst
min the lowest flow rate leading to the collapse
of the free surface.
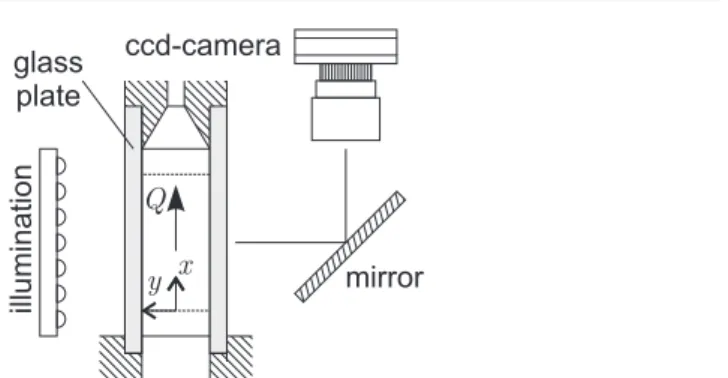
Q x y ccd-camera mirror illumination glass plate
Fig. 6 Schematic drawing of the groove channel and optics.
Table 1 Experiment parameters with channel widtha, channel depthb, aspect ratioΛ, dimensionless channel length ˜land Ohne-sorge number Oh. The laminar friction factor for both channels readsKpf= 78.81 [6].
No. a[mm] b[mm] l[mm] Λ[-] ˜l[-] Oh [-] 1 5 30 47.5 6.0 4.17×10⁻³ 1.62×10⁻³
2 5 30 28.9 6.0 2.54×10⁻³ 1.62×10⁻³
Table 2 Properties of test liquid FC-72 at 25◦C [13]. The static
contact angle isγstat= 0 on glass.
Liquid ρ[kg m−3] ν[m2s−1] σ[N m−1]
FC-72 1680.0 0.380×10⁻⁶ 0.010
3.3 Flow observation and image processing
For flow observation a high speed CCD camera with 250 frames per second and a resolution of 512×480 pixel is used. The optical axis of the camera is aligned normal to the glass plates (see Fig. 6). For comparison with the numerical data, the surface profilesk(x) were detected with a 5×5 Sobel technique [12] using the maximal gradient.
3.4 Parameters and experiments
Table 1 shows the parameters for the experiment cam-paigns. The properties of the test liquid FC-72 is pro-vided in Table 2.
The low Ohnesorge numbers are typical for short length convection-dominated flows. For the shorter di-mensionless channel length ˜l, viscous effects are negli-gible. The longer channel is affected by viscous effects but remains convective dominated (see also Sec. 4.2).
To determine the critical flow rateQcrit12 drop
ex-periments with different flow rates have been performed for each channel geometry.
(a) pneumatic slide flow direction b suction device (b) free surface (c) surface instability
Fig. 7 (a) Detailed view of the groove at initial condition with closed pneumatic slide and developed flow. The flow direction is from left to right. (b) Experimental result of a subcritical flow rate in microgravity with a stable free surface. (c) In contrary a supercritical flow rate with an unstable free surface.
4 Results and discussion
In the following video images of the experimental ob-servation with different flow conditions in the capillary channel are presented. Later the experimental data and the theoretical model are compared. Finally, the princi-ple mechanism of flow rate limitation will be explained. Fig. 7a shows a video image of the initial config-uration. The suction device at the lower side is placed outside the channel to remove surplus liquid. The chan-nel is closed by the pneumatic slide but the flow is al-ready established. At the beginning of the microgravity condition the slide opens the channel and the free sur-face is established as shown in Fig. 7b. The experiment
Fig. 8 Surface profile of the shorter channel at flow rateQ= 0.827 which is 90% of the numerical critical flow rate for this channel geometry.
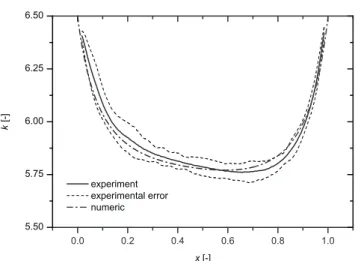
Fig. 9 Surface profile of the longer channel at flow rate Q= 0.814 which is 93% of the numerical critical flow rate for this channel geometry.
with a subcritical flow rate has a stable free surface and no gas ingestion at the channel outlet. In contrast Fig. 7c shows a supercritical system with an unstable free surface draining a gas bubble into the channel.
4.1 Comparison of experiment and theory
Fig. 8 shows the comparison for the short channel (l= 28.9 mm). For this case the wall shear stress is almost negligible (Sec. 4.2). The surface contour is plotted ver-sus the flow direction xfrom the channel inlet x = 0 to the channel outletx = 1. The contour plots corre-spond to a high flow rate (Q= 0.827) which is about 90% of the numerical critical flow rate for this channel geometry. Due to pressure pertubations from the gear pump small fluctuations can be observed at the free surface. To eliminate this dynamic effect the time aver-aged value over 250 video images (1 s) has been taken
0.5 0.6 0.7 0.8 0.9 5.0 5.2 5.4 5.6 5.8 6.0 6.2 6.4 Qst max Qnum crit k* [ -] Q [-] numeric experiment Qunst min
Fig. 10 Comparison of the experimental and numerical mini-mum contour positionk∗for the shorter channel.
to get a steady surface contour. The experimental er-ror shows the limits of the free surface within these 250 images. Fig. 8 shows a good agreement of the experi-mental and the numerical surface profile. The numeri-cal surface contour is always bounded between the error lines of the experimental data. The maximum relative difference ∆krel = max kexp aver(x)−knum(x) knum(x) (22) between the average experimental contourkexp
aver(x) and
the numerical solutionknum(x) is smaller than 1%. For this short length l the convective term dominates and the contour is nearly symmetric to the middle of the channel.
For the longer channel (l = 47.5 mm), again at a high flow rate (Q= 0.814) which is about 93% of the numerical critical flow rate for this channel geometry, a good agreement of the experimental and numerical surface contour (Fig. 9) can be observed. According to the longer channel, the influence of friction increases (see Sec. 4.2). Therefore the innermost points are lower and the contours are not as symmetric as for the short channel. The deviation near the innermost point of the free surface is induced by the two radii-approximation. For high curvature deformation the assumption of the constant first principle radius R1 is not exact.
How-ever, the accuracy is still good. The maximum relative difference Eq. (22) is smaller than 1.5%.
In Fig. 10 and 11 we compare the minimum contour pointk∗versus the established flow rateQ. For increas-ing flow rates the surface bends inwards and collapses at the critical flow rate.
In Fig. 10, the results of the shorter channel are shown. The numerical and the experimental minimum contour points are in good agreement. Again, the er-ror bars are influenced by the fluctuation of the free
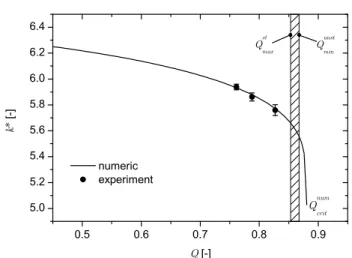
0.5 0.6 0.7 0.8 0.9 5.0 5.2 5.4 5.6 5.8 6.0 6.2 6.4 Qst max Qnum crit k* [ -] Q [-] numeric experiment Qunst min
Fig. 11 Comparison of the experimental and numerical mini-mum contour positionk∗for the longer channel.
surface. The experimental critical flow rate is shown as a single point. Here we get a critical flow rate area which is between the maximum stable Qst
max = 0.853
and the minimum unstable case Qunstmin = 0.866. This yields an experimental critical flow rate according to Eq. (21) as Qexpcrit = 0.86. The numerical critical flow rate for this case is Qnumcrit = 0.88. The lower exper-imental critical flow rate is linked to the determina-tion of this value. The experimental microgravity time is limited and the initial reorientation of the free sur-face cannot be avoided. Close to the critical flow rate a collapse of the free surface can occur during the dy-namic reorientation. This is not captured by the nu-merical steady-state analysis. Anyway, the nunu-merical value is in good agreement to the experimental flow rate. Also the results for the longer channel (Fig. 11) show good agreement for the minimum contour point versus the established flow rate and for the critical flow rate (Qexpcrit = 0.826 and Qnumcrit = 0.84). The influence of friction increases for the long channel and the initial dynamic of the reorientation is damped faster. There-fore the numerical and experimental flow rates are in better agreement.
4.2 Classification of flow regime
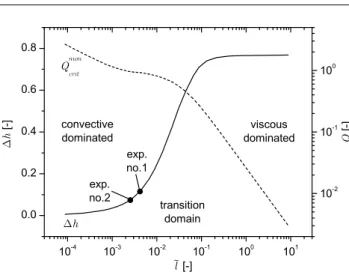
To study the influence of the channel lengthl a para-metric study of ˜l for Oh = 1.62×10⁻³, Λ = 6.0 and fixed boundary conditions according to Eq. (19) has been done numerically. For each ˜l the maximum flow rateQnumcrit and the corresponding mean curvature dif-ference between the channel inlet and outlet
∆h=h(x= 1)−h(x= 1) (23)
were determined. The result is plotted in Fig. 12. Since the convective momentum transport in the channel is
10 -4 10 -3 10 -2 10 -1 10 0 10 1 0.0 0.2 0.4 0.6 0.8 10 -2 10 -1 10 0 exp. no.1 h [ -] l [-] convective dominated viscous dominated ~ h Qnumcrit transition domain exp. no.2 Q [ -]
Fig. 12 Parametric study of the influence of the dimensionless channel length ˜lon the irreversible pressure loss∆h(solid line) at the critical flow rateQnum
crit (dashed line). The solutions for the
channel geometry (Tab. 1) are denoted asexp.no.1andexp.no.2. The Ohnesorge number is constant (Oh = 1.62×10⁻³) as well as the aspect ratio (Λ= 6.0).
reversible, it does not affect the pressure difference be-tween the channel inlet and outlet, so ∆h is a direct indicator for the influence of the irreversible, viscous pressure loss. For small channel lengths (˜l <10−3) the flow is dominated by convective momentum transport so the irreversible pressure loss ∆h is small and the maximum flow rate isQnumcrit is high. For long channels (˜l >10−1) the flow is dominated by viscous momentum transport. The reversible pressure loss due to convective momentum transport becomes negligible and the maxi-mum flow rateQnum
crit decreases to small values. Between
these regimes the flow is controlled by both convective and viscous pressure losses.
As mentioned before both investigated channel types (see Tab. 1) are near the convective dominated domain. For this regime we present in the following the deter-mining effect for the collapse of the free surface.
4.3 Mechanism of flow rate limitation
To describe the mechanism of flow rate limitation the numerical solutions of the capillary pressure and the lo-cal pressure at the smallest cross section (characterized with an asterisk) are compared. The capillary pressure is defined in Eq. (11) h∗= 1 R1 + 1 R2 (24)
Fig. 13 Comparison of the numerical minimum solution for the capillary pressureh∗ and local pressurep∗ =p∗conv+∆pirr of
the shorter channel in dependence onk∗.
Substituting Eq. (12) and Eq. (8) in Eq. (7) and in-tegration from the channel inlet to the smallest cross section yields 1 R1 + 1 R2 | {z } h∗ = 12 v∗2−v02 | {z } p∗conv +h0+ Kpf 2 ˜ l x∗ Z 0 vdx | {z } ∆pirr , (25)
with the average velocity v0 at the channel inlet. The
capillary pressure h∗ on the left hand side of Eq. (25) stabilizes the free surface. The convective pressurep∗conv and the irreversible pressure loss∆pirrwith initial
pres-sureh0 on the right hand side destabilize the system.
In dependence on the minimum contour pointk∗the capillaryh∗and local pressurep∗=p∗conv+∆pirrcan be
plotted for each channel geometry. In Fig. 13 the values for the shorter channel are applied. The local pressure p∗ is dependent on the flow rate Q and is plotted for different established flow rates.
When the local pressure p∗ and the capillary pres-sures h∗ are equal a stationary solution is found. For flow rates lower than Qcrit subcritical and
supercriti-cal solutions exist. In the experiment only the subcrit-ical solution can be reached because the supercritsubcrit-ical solution is instable, but the numerical algorithm can calculate these points.
At the critical flow rate Qcrit we obtain only one
solution. At this point the derivatives of the capillary and the convective pressure with respect tok∗are equal
dh∗
dk∗ =
dp∗
dk∗. (26)
Due to the small frictional pressure loss for these chan-nel types, the irreversible pressure loss∆pirris assumed
0.0 0.2 0.4 0.6 0.8 1.0 0 1 2 3 4 5 6 7 v , v ca [ -] Q [-]
capillary wave speed vca
average velocity v
Fig. 14 Numerical solution of the capillary wave speed and the mean average flow velocity at the smallest cross section of channel no. 2 versus the flow rate.
as independent ofk∗and the derivative with respect to k∗ is equal to zero. Withv∗=Q/A∗it follows
dh∗
dk∗ =
d1
2(Qcrit/A∗)2
dk∗ . (27)
OnlyA∗andh∗are functions ofk∗and the gradient of the convective pressure yields
dh∗ dk∗ =− Q2 crit A∗3 dA∗ dk∗. (28)
Re-substitution of the mean velocity in the smallest cross section at the critical pointv∗crit reaches
Q2 crit A∗2 =v ∗2 crit=−A∗ dh∗ dA∗. (29)
The term on the right hand side of Eq. (29), formerly known as the small amplitude longitudinal wave speed vca defined by Rosendahlet al.[3], is
vcrit∗2 =vca2 =−A∗dh
∗
dA∗. (30)
This means that the limiting value of the flow through an open capillary groove is the average flow velocity at the smallest cross section. If the value reaches the small amplitude longitudinal wave speed the free sur-face collapses and the system becomes unstable. This phenomenon is similar to the choking problem for com-pressible gas flows, where the maximum mass flow is reached when the average flow velocity reaches the speed of sound [6].
Fig. 14 shows the numerical solution for the mean flow velocity and the calculated wave speed which is dependent on the flow rate. At the critical flow rate both velocities are equal and the flow is choked.
4.4 Comparison to other open channels
As mentioned before Rosendahlet al.[3] examined open channel flows between parallel plates. There two oppo-site aligned free surfaces constrict the cross-sectional area A∗ and the local mean velocity at the smallest cross-section is higher than in a similar groove chan-nel with only one free surface. For convective domi-nated flows the critical flow rate is therefore signifi-cantly lower. In contrary for friction dominated flows the local pressure is not dominated by inertia effects and friction losses are greater in groove channels. There-fore the critical flow rate for a parallel plate channel is higher than for a similar groove channel.
5 Summary
In this work we investigated experimentally and numer-ically forced liquid flows through open capillary grooves under microgravity conditions. The experimental inves-tigations focused on the profile lines of the free surface contour and the maximum flow rate through the chan-nel without a collapse of the free surface which is de-fined as the critical flow rate.
An one-dimensional flow model is presented in which the liquid pressure is related to the capillary pressure at the free surface including both principal radii of curva-ture. The flow model considers also the convective and viscous pressure losses. In the comparison of experimen-tal and numerical data we focused our investigations on convective dominated capillary channel flows. For this regime we obtain a good agreement of our experimental and numerical data. So we are able to simulate these types of flow with our theoretical model numerically.
Furthermore we presented a derivation of the mech-anism of flow rate limitation for these flow conditions which is similar to the Mach-Number problem for com-pressible gas flows. If the average flow velocity through the channel reaches the capillary wave speed the flow is choked and it is not possible to increase the volume flow through the channel. If this occurs, the free sur-face of the liquid collapses and gas is ingested into the channel.
Acknowledgements The funding of the research project by the German Federal Ministry of Education and Research (BMBF) through the German Aerospace Center (DLR) under grant num-ber 50 WM 0241 and 50 WM 0535 is gratefully acknowledged.
Furthermore we acknowledge the fundamental help of Mr. H. Faust and Mr. R. Mairose for mechanical and electronic support.
References
1. D. E. Jaekle, J.: Propellant management device conceptual design and analysis: Vanes. In: AIAA/SAE/ASME/ASEE 27th Joint Propulsion Conference, AIAA 91-2172, pp. 1–13. AIAA, Sacramento, CA (1991)
2. D. E. Jaekle, J.: Propellant management device conceptual design and analysis: Sponges. In: AIAA/SAE/ASME/ASEE 29th Joint Propulsion Conference and Exhibit, AIAA-93-1970, pp. 1–13. AIAA, Monterey, California (1993)
3. Rosendahl, U., Ohlhoff, A., Dreyer, M.E.: Choked flows in open capillary channels: theory, experiment and computa-tions. J. Fluid Mech.518, 187–214 (2004)
4. Gersten, K.: Einfuehrung in die Stroemungsmechanik. Vieweg Verlag, Braunschweig (1991)
5. Dreyer, M.: Free Surface Flows under Compensated Grav-ity Conditions,Springer Tracts in Modern Physics, vol. 221. Springer-Verlag (2007)
6. White, F.M.: Fluid Mechanics. McGraw Hill, New York (1986)
7. Haake, D., Rosendahl, U., Ohlhoff, A., Dreyer, M.E.: Flow rate limitation in open capillary channel flows. Ann. NY Acad. Sci.1077, 443–458 (2006)
8. Landau, L.D., Lifschitz, E.M.: Lehrbuch der Theoretischen Physik, Band VI, Hydrodynamik. Akademie Verlag, Berlin (1991)
9. Bronstein, I.N., Semendjajew, K.A.: Taschenbuch der Math-ematik. Teubner (1985)
10. Klatte, J., Haake, D., Weislogel, M.M., Dreyer, M.: A fast nu-merical procedure for steady capillary flow in open channels. Acta Mech.201, 269–276 (2008)
11. Grah, A., Haake, D., Rosendahl, U., Klatte, J., Dreyer, M.E.: Stability limits of unsteady open capillary channel flow. J. Fluid Mech.600, 271–289 (2008)
12. Baessmann, H., Besslich, P.W.: Bildverarbeitung ad oculos. Springer Verlag, Berlin (1991)