ISSN: 2089-3272, DOI: 10.11591/ijeei.v7i2.867 303
Feature and muscle selection for an effective hand motion
classifier based on electromyography
Triwiyanto Triwiyanto1, Triana Rahmawati2, I Putu Alit Pawana31,2Department of Electromedical Engineering, Politeknik Kesehatan Kementerian Kesehatan Surabaya, Indonesia 3Department Physical Medicine and Rehabilitation, Dr. Soetomo Hospital, Indonesia
Article Info ABSTRACT
Article historys: Received Nov 28, 2018 Revised Apr 1, 2019 Accepted Apr 18, 2019
An issue that arises in the hand motion classification based on the electromyography (EMG) system is the failure of choosing the right features and number of muscles. These parameters are fundamental in determining the accuracy and effectiveness of the classifier system. Therefore, the objective of this study is to develop and evaluate an effective hand motion classifier based on the EMG signal. The three-channel of EMG was collected by placing three pairs of electrodes on the surface of the skin. Six statistic features (mean, variance, standard deviation, kurtosis, skewness, and entropy) were selected to extract the EMG signal using a window length of 100 samples. A muscle and features selection is applied to the classifier machine (linear discriminant analysis (LDA), support vector machine (SVM) and K nearest neighborhood (KNN)) to retrieve the most useful feature and muscle. In this study, we found that there was no significant difference in accuracy among a number of muscles (p-value>0.05). LDA and SVM showed the best accuracy and no significant difference in accuracy between both were found. This study concluded that EMG signal from a single muscle can classify the hand motion (hand close, open, wrist flexion, and extension) effectively.
Keywords: Electromyography KNN LDA Pattern recognition Statistic features SVM
Copyright © 2019 Institute of Advanced Engineering and Science. All rights reserved.
Corresponding Author: Triwiyanto Triwiyanto,
Department of Electromedical Engineering,
Politeknik Kesehatan Kementerian Kesehatan Surabaya, Pucang Jajar Timur No 10, Surabaya, Indonesia. Email: [email protected]
1. INTRODUCTION
A human hand consists of a complex structure of muscles. The activities of the EMG signal, generated by the muscle, represent the human hand motion. This is however, still a challenging study [1]. Some have explored the relationship between the EMG signal and hand motion in conjunction with the development of a prosthetics hand for a trans-radial amputee [2, 3]. To identify the hand motion using the EMG signal, a feature extraction has to be performed, on the basis of time [4], frequency [5], and time-frequency (wavelet) [6, 7]. These features have been used to discriminate a motion of upper and lower limbs of the human body, however the feature extraction based on the time domain is usually more preferred than the others. The reason is that the time domain feature takes less time in computation than the others and a transformation stage is not needed. In accordance with the literature, the time domain features are classified based on energy, complexities, frequency, and statistics [5]. Due to the characteristics of the EMG signal, which is random and stochastic in nature [8], the time domain feature based on statistics is more preferred over the others. To recognize the hand motion using the EMG signal, some studies explored four to twelve groups of muscles, however the evaluation for each muscle, of which contributes to the classification system, has not yet studied. The finding of the muscle in the discrimination process is important because it determines the practical method in using the minimum number of electrodes in the classifier system.
Previous studies have developed a hand motion classifier system in order to discriminate the hand motion using the EMG signal. The hand motion classifier system consists of data acquisition, segmentation, feature extraction, and machine learning. Some literature revealed various machine learning for pattern recognition in the hand motion based on the EMG signal. Oleinikov et al. [9] developed a hand motion classifier using the time domain feature extraction and an artificial neural network as the classifier. For six hand motions, the accuracy is 91%. Gandola et al. [10] proposed a hand motion classifier to group the three hand motions using ten bipolar EMG electrodes. In their study, a cascade artificial neural network was developed to improve the accuracy of the classifier. Young et. al [11] studied a hand motion classifier (based on eight pairs of electrodes) from a trans-radial amputee using linear discriminant analysis (LDA) to identify four hand motions. They found that the EMG signal could be used to recognize two or three degrees of freedom simultaneously. In accordance to the previous literature, the maximum number of muscles, which were used to distinguish the motion, presented a clear picture of the behavior of the activity of EMG signal. However, a large number of muscles will be directly connected to the computation time and the cost in the usage of the electrodes.
To the author’s best knowledge, there is a scarcity regarding studies that explore the number of features and muscles for the machine learning (ML) accuracy. Therefore, this study evaluates the minimal number of features and muscles due to its relation to the cost and effectiveness of the hand motion recognition system. Furthermore, the accuracy of the ML for different features and muscle selection were assessed. The differences in accuracy among the selection was examined to prove that there was no significant difference between the number of muscles and features. In this study, the ML used to evaluate the effective feature and number of muscles was linear discriminant analysis (LDA), support vector machine (SVM), and K-nearest neighborhood (KNN). The rest of this paper is organized as follows: Section 2 provides the materials and method used to perform the research, which consists of data acquisition, feature extraction, and machine learning. Section 3 presents the results of this study such as the EMG signal, feature extraction, and the accuracy of the machine learning. Section 4 discusses the result of the study in comparison to other studies. Finally, Section 5 concludes the result of the research and talks about future work and recommendation.
2. MATERIAL AND METHOD
This section presents the material and method that we used for hand motion recognition as shown in Figure 1 based on the EMG signal. Generally, this section consists of the experimental protocol that we used for data acquisition and the diagram block of the proposed method to perform the pattern recognition.
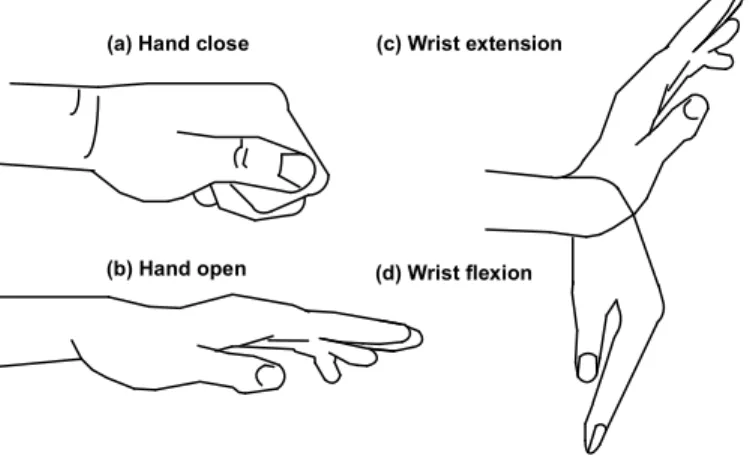
(a) Hand close
(b) Hand open
(c) Wrist extension
(d) Wrist flexion
Figure 1. Hand motion to be recognized by the classifier 2.1. Experimental protocol
In this experiment, the EMG signal was collected using three pairs of electrodes (Ag/AgCl, disposable) from five participants with able body (healthy). This study was conducted at the Polytechnic of Health Ministry of Health Surabaya, Indonesia, and the experiment protocols have followed the Ethics Committee of Polytechnic of Health Ministry of Health Surabaya, Indonesia. In the collection of the EMG signal, the electrodes were placed on extensor carpi radialis longus (CH0), flexor carpi radialis longus (CH1), and flexor carpi ulnaris (CH2) and one ground electrode was placed at a bony part of the elbow (Figure 2(a))
[12, 13]. The placement of the electrodes was following SENIAM regulations [14], and the function of each muscle is related to the hand motion [15]. In this study, the activities of muscles CH0, CH1 and CH2 which related to hand open (HO), hand close (HC), wrist extension (WE) and wrist flexion (WF) motions were learnt. These motions are a standard minimum studied in previous works for developing a prosthetic hand. The EMG signal was recorded using a homemade EMG amplifier (Figure 2 [b]) which consists of pre-amplifier (AD620), a bandpass filter (20-500 Hz), a notch filter (50 Hz) and summing amplifier. The analog output of the EMG amplifier was connected to the analog to digital converter (ADC) of the microcontroller (ARM STM32F29). From the microcontroller, the EMG signal was sent to the computer (serially) for recording and analysis. The dominant frequency of the EMG signal was 80 to 150 Hz [16] before it was sampled with a frequency of 2000 Hz. Generally, motion artifact, where the frequency ranges between 0 and 20 Hz [17, 8], can reduce the quality of the EMG signal. Therefore, a bandpass filter (20-500 Hz) was built to eliminate the noise, and a pre-gelled electrode (Figure 2[a]) was used to maintain the stability of the contact between electrode and skin.
In the recording of the EMG signal, the subjects performed a sequential motion: HO, HC, WE and WF. Each movement, including the transition from rest (6 seconds) to action (2 seconds), required 8 seconds to complete. Therefore, the time total of the recording for four motion is 32 seconds. This data set was repeated ten times for every subject. In the EMG data acquisition, to avoid the effect of muscle fatigue on the EMG signal (amplitude and frequency) [18], subjects took time to rest.
(a) (b)
Figure 2. (a) The placement of disposable electrodes (Ag/AgCl) at extensor carpi radialis longus (CH0), flexor carpi radialis longus (CH1), and flexor carpi ulnaris (CH2), (b) The manufacture of the EMG amplifier
and the interface of the discovery board ARMSTM32F429 that used in this study. 2.2. Proposed method
The recording of the EMG signal from CH0, CH1, and CH2 was segmented for every 100 samples as an adequate length for feature extraction [18]. Furthermore, each segmented signal was extracted using the statistics features, categorized as a time domain. Mean, variance, standard deviation, kurtosis, skewness, and entropy were chosen. These features were commonly used by the previous study to extract the EMG signal, especially in the pattern recognition [13, 19]. Because the number of EMG channel was 3 and the number of features was 6, the combination of the feature therefore resulted in 18 features, as exemplified in Table 1. where xi indicates the EMG signal, N indicates the length of window segment and pi indicates the probability within N windows length.
Table 1. EMG feature extraction using statistics features a. 1 1 N i i Mean x N
b. 2 1 1 ( ) 1 N i i Variance x x N
c. 3 1 1 ( ) N i i x x Skewness N Variance
d. SD Variance e. 4 1 1 N ( ) 3 i i x x Kurtosis N Variance
f. 2 0 log ( ) N i i i Entropy p p
The effectiveness of the features and number of muscles that influenced the accuracy of the machine learning was evaluated, performed by selecting the number of features and muscles used as the input for the classifier machines. Before the features were used as input of the machine learning, a preprocessing stage was performed where the rage of the features was converted from 0 to 1. This is expressed as follows:
min( )
max( ) min( )
normx
x
x
x
x
(1)where xnorm indicates the normalized features, x is the original features, min(x) is the minimum value of the
features, and max(x) is the maximum value of the features.
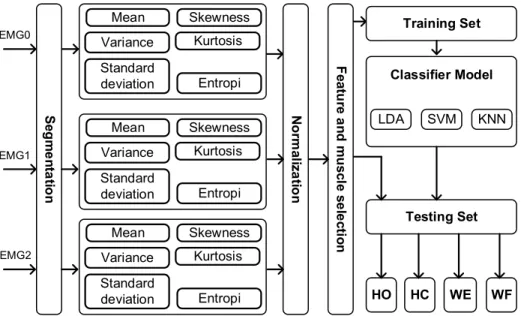
The normalization was intended to make the plotting of the pattern with the same range easier. Before training and testing were conducted, the selection of the feature and the number of muscles were performed. This selection was made to evaluate the most useful feature and muscle in influencing hand motion. In the development of machine learning (ML), a classification learner in the MATLAB program to apply the LDA, SVM, and KNN was used. Previous studies used these MLs for EMG pattern recognition as they have better accuracy [5, 13, 20, 3, 21]. The diagram block of the proposed method is exemplified in Figure 3.
EMG0 Mean Variance Standard deviation Skewness Kurtosis Entropi EMG1 Mean Variance Standard deviation Skewness Kurtosis Entropi Mean Variance Standard deviation Skewness Kurtosis Entropi N o rm aliz a tio n Training Set Classifier Model Testing Set HO HC WE WF LDA SVM KNN Fe at ur e a n d m u sc le s e le ct io n Se g m e n ta ti o n EMG2
Figure 3. The diagram block of pattern recognition for hand motion discrimination, hand open (HO), hand close (HC), wrist flexion (WF), and wrist extension (WE) motion, using three channels of EMG amplifier. 3. RESULT
This section consists of the results of the study which presents the EMG signal from three muscles, the extracted of the EMG signal using six statistics features (mean, variance, standard deviation, kurtosis, skewness, and entropy) and the scatterplot of the EMG feature. The confusion matrix for LDA, SVM, and KNN is also highlighted in this section. Finally, the accuracy resulted from a combination of all the features and the muscles were provided.
3.1. EMG signal for different motions
The EMG signal was recorded from muscles assigned as channel CH0, CH1 and CH2, sequentially, with time sampling of 0.0005 seconds (sampling frequency of 2000 Hz). Figure 4 shows different activities of EMG signal from muscles CH0, CH1 and CH2. The activities of the EMG signal were influenced by the hand motion (HO, HC, WE, and WF) so that each motion represented different activities. However, due to the randomness of the EMG signal, the difference between the motion using the EMG signal can not be discriminated.
4 -4 0 4 -4 0 4 -4 0 EMG (m V ) Time (seconds) HC HO WE WF
Figure 4. The representation of the EMG signal from channel 0 (CH0),
channel 1 (CH1) and channel 2 (CH2) according to the hand motion (HC, HO, WE and WF). The amplitude range of the EMG signal was between -5 to 5 mV.
3.2. EMG features for various EMG channel and features
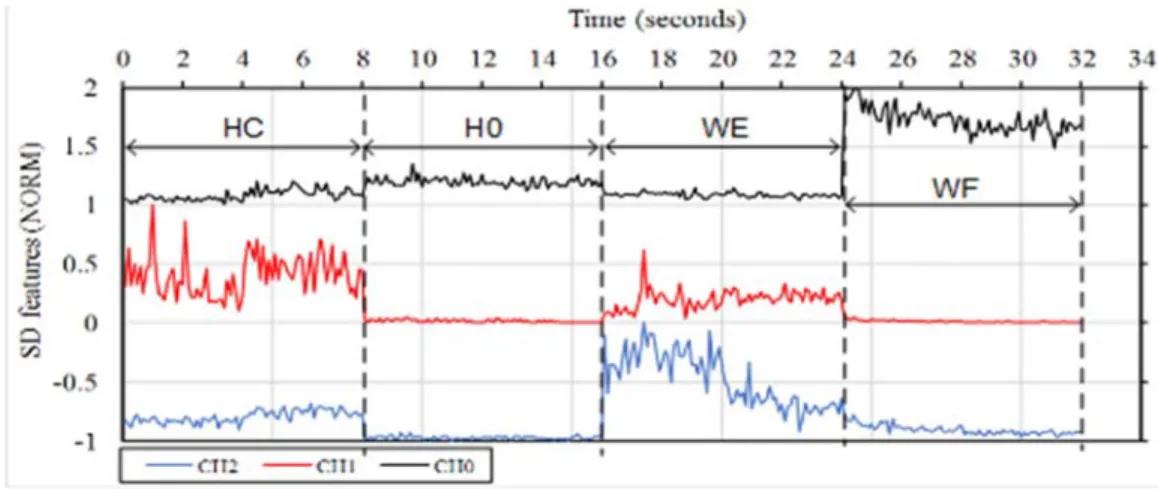
Figure 5 represents the EMG features based on SD which indicated the pattern for four motions (HC, HO, WE and WF), sequentially. Each motion was performed in eight seconds including the transition between the motion. The sequence of motion was repeated for ten times in order to get the average value and for statistical analysis purposes. They were extracted every 100 samples for all channels (CH0, CH1, and CH2), indicated by black, red and blue colors, respectively. In relation to the hand close (HC) motion, the EMG features which came from CH1 showed higher activities than the others. In the hand open (HO) motion, the EMG features from CH0 was higher than the other channels. In the wrist extension (WE) motion, the two EMG features generated from CH1 and CH2 showed higher activities than CH0. In the wrist flexion (WF) motion, channel CH1 tended to show a higher level of activities than others. Generally, the features generated from channel CH0, CH1 and CH2 presented different behaviors when the motion was changed. Therefore, the ML could quickly learn the pattern.
Figure 5. The representation of the EMG feature (standard deviation feature) for hand motion recognition of HC (hand close), HO (hand open), WE (wrist extension), and WF (wrist flexion). The EMG signal is
All the normalized feature extraction was illustrated in Figure 6. The normalization was taken because each feature had a different range in minimum and maximum values. The figures were divided into six subfigures - Figure 6(a), (b), (c), (d), (e), and (f), which explained the results of the statistics features based on mean, variance, standard deviation, entropy, skewness, and kurtosis, respectively. Each subfigure indicated the features from all EMG channels (CH0, CH1, and CH2). The resulted features from CH0, CH1, and CH2 were indicated with black, red, and blue colors, respectively. From Figure 6, the statistics features of mean, variance, and standard deviation had a different pattern in distinguishing the hand motion (HO, HC, WE and WF). The randomness of the features (entropy, skewness, and kurtosis) as shown in Figure 6(d), (e) and (f) was difficult to be discriminated among the four, except if ML was used. In accordance to the aim of this study, the statistics features (mean, variance, standard deviation, entropy, kurtosis and skewness) and the EMG channels (CH0, CH1, and CH2) were explored in order to get the picture of the resulted features related to the hand motion before the pattern recognition process.
(a) (b)
(c) (d)
(e) (f)
Figure 6. The EMG features of EMG signal for four sequence motions (HC, HO, WE, and WF) from three channels of EMG signal (CH0, CH1, and CH2). These features are (a) mean, (b) variance, (c) standard deviation, (d) entropy, (e) skewness, and (f) kurtosis. All of the features have been normalized (0 to 1).
From the exploration of the EMG feature using six statistic features and three muscles, we can conclude that the feature of mean, standard deviation and variance had different patterns to be recognized as HO, HC, WE, and WF motion. From the figure (Figure 6), CH0, CH1, and CH2 have a significant potential to be used in only one channel for motion classification.
Clustering of the feature was illustrated using a two-dimension scatterplot. Figure 7. shows a representation of the scatterplot from the features between mean-variance and mean-standard deviation for all channels. The mean, standard deviation, and variance as the variable of the scatterplot were chosen because those features had a different response in discrimination of the hand motion. All figures, Figure 7(a) to (f), show that the features able to cluster according to each. This scatterplot showed that each motion had a different pattern, influenced by the selected channel and combination between the features. Figure 7 shows that the pattern of the HO motion (indicated with orange color) tended to have a consistent pattern (move closer) for all channels (CH0, CH1, and CH2) than the others, but the HC, WE and WF motions were inconsistent. As shown in Figure 7(b), (c), (e), and (f), at the position of HO and WE, the scatterplot of mean-variance and mean-SD had a wider distribution than the others represented by CH1 and CH2. Even though the scatterplot of HC, HO and WE were clustered, Figure 7(a) and (d), the WF showed a wide range of distribution. To conclude, based on the representation of the scatterplot, the EMG channel generated from CH0 could discriminate four hand motions (hand close, hand open, wrist flexion, and wrist extension).
Figure 7. The representation of scatterplot for HC, HO, WE and WF motion from the different channels (CH0, CH1, and CH2). This scatterplot was plotted between (a) mean and variance for CH0, (b) mean and variance for CH1, (c) mean and variance for CH2, (d) mean and standard deviation for CH0, (e) mean and
standard deviation for CH1 and (f) mean and standard deviation for CH2. 3.3.The accuracy of the machine learning
In this study, the EMG signal generated from CH0, CH1, and CH2 was extracted using statistic features (mean, variance, standard deviation, kurtosis, skewness, and entropy). Whenever each channel was extracted, 3 channels times 6 features resulted in 18. Furthermore, these 18 features were used as the inputs of the classifier machine. In this study, an evaluation on three MLs were made: linear discriminant analysis (LDA), support vector machine (SVM), and K nearest neighborhood (KNN). These machine learnings were often used by previous studies to learn about pattern recognition. In this experiment, we used an application learner from a MATLAB program to study the EMG pattern related to hand motion. In this study, the configuration of the ML system was as follows: the number of predictors was one to eighteen (a combination
0 0.25 0.5 0.75 1 0 0.25 0.5 0.75 1 Mean Variance (a) CH0 HC HO WE WF 0 0.25 0.5 0.75 1 0 0.25 0.5 0.75 1 Mean Variance (b) CH1 HC HO WE WF 0 0.25 0.5 0.75 1 0 0.25 0.5 0.75 1 Mean Variance (c) CH2 HC HO WE WF 0 0.25 0.5 0.75 1 0 0.25 0.5 0.75 1 Mean SD (d) CH0 HC HO WE WF 0 0.25 0.5 0.75 1 0 0.25 0.5 0.75 1 Mean SD (e) CH1 HC HO WE WF 0 0.2 0.4 0.6 0.8 1 0 0.5 1 Me an SD (f) CH2 HC HO WE WF
the number of features and channels), some observations were 320 (8 seconds/motion x 4 motion (HC, HO, WF, WE) x 10 repetitions), the number of classes was four (HC, HO, WF, and WE). In the validation, a holdout validation with 25% testing and 75% training was chosen. In order to get the accuracy matrix between the classes then the confusion matrix was needed to help understand how the machine recognizes each pattern.
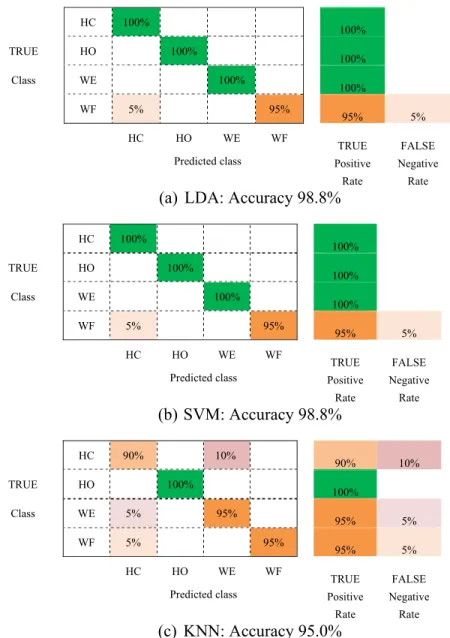
Figure 8(a), (b) and (c). showed the confusion matrix for LDA, SVM, and KNN, respectively. In the first configuration, the machine learning received eighteen EMG features to recognize four motions (four classes). The training and testing for the machine learning were conducted sequentially for LDA, SVM, and KNN. After the training, each of the machine learning was tested and the accuracy was 98.8%, 98.8% and 95% for LDA, SVM, and KNN, respectively.
In this study, LDA and SVM, shown in Figure 8(a) and (b), achieved the same accuracy. All motion can 100% be recognized, however, there is 5% misclassification (false negative rate) between HC and WF. In the KNN, Figure 7(c), HC motion can be recognized 90% as true positive rate and 10% false negative rate. WE and WF motion can be discriminated 95% as true positive and 5% as false negative rate.
HC 100% 100% TRUE HO 100% 100% Class WE 100% 100% WF 5% 95% 95% 5% HC HO WE WF TRUE FALSE Predicted class Positive Negative
Rate Rate
(a)
LDA: Accuracy 98.8%
HC 100% 100% TRUE HO 100% 100% Class WE 100% 100% WF 5% 95% 95% 5% HC HO WE WF TRUE FALSE Predicted class Positive Negative
Rate Rate
(b)
SVM: Accuracy 98.8%
HC 90% 10% 90% 10% TRUE HO 100% 100% Class WE 5% 95% 95% 5% WF 5% 95% 95% 5% HC HO WE WF TRUE FALSE Predicted class Positive NegativeRate Rate
(c)
KNN: Accuracy 95.0%
Figure 8. The confusion matrix of the motion recognition (hand close, hand open, wrist extension, and wrist flexion) using the three channels of EMG signal based on eighteen features (3 channel x 6 features). The
confusion matrix was created using classification learner from MATLAB. The confusion matrix was developed from machine learning of (a) LDA, (b) SVM, and (c) KNN.
Figure 9. The accuracy of the machine learning (LDA, SVM, and KNN) for hand motion classification (hand close, hand open, wrist extension, and wrist flexion) with various combination of the number of channels and features. Group 1 consists of 1 channel (number of feature: 1 to 6), Group 2 consists of 2 channels (number
of feature: 2 to 12) and Group 3 consists of 3 channels (number of feature: 3 to 18).
Each EMG signal generated from the muscles (CH0, CH1, and CH2) were extracted with six statistics features. To explore which muscle and feature influenced the accuracy of the machine learning the most, the proposed method was evaluated based on the number of features (scheme I) and number of channels (scheme II). In scheme I, we clustered the method to classify the pattern into three groups, which were Group 1, Group 2, and Group 3 (Figure 9). Group 1, Group 2, and Group 3 consist of one, two and three muscles, respectively. According to the number of muscles and the EMG signal, each muscle was extracted using six features. Therefore, in Group 1, the minimum and maximum features were 1 and 6, respectively. In Group 2, the minimum and maximum features were 2 and 12 features, and in Group 3, the number of features vary from 3 to 18 features. As shown in Figure 9 in the first group, a number of features influenced the accuracy of machine learning. However, even though the classifier received only one feature from a single muscle, the classifier could result in an accuracy of 97.5%, 97.5% and 98% for LDA, SVM, and KNN, respectively. Furthermore, in Group one for features 3 to 6, it was shown that the accuracy of the classifiers (LDA and SVM) were the same. In group two and three, even though the number of features was minimum (two and three features), they had better accuracy.
Figure 10. The effect of the number of channels and features selection on the accuracy of the machine learning (LDA, SVM, and KNN).
In scheme II, to find the best feature and adequate number of channels in classifying the motion, the accuracy of the machine learning was calculated for each feature (mean, variance, standard deviation, skewness, kurtosis, and entropy) with various combinations (of CH0-CH1-CH2, CH0-CH1, CH0, CH1, and CH2) as shown in Figure 10. The mean produced a higher accuracy than the other features for all machine learning and channel combinations (CH0-CH1-CH2, CH0-CH1, CH0, CH1, and CH2). The entropy and kurtosis features had the worst accuracy for machine learning (LDA, SVM, and KNN).
4. DISCUSSION
In this study, the effectiveness of using a single muscle to recognize the hand motion using the EMG signal was investigated. A statistical test, single factor ANOVA (α=0.05), was performed to examine the effect of the number of muscles to the accuracy for each different ML. The statistical test indicated that there was no difference in accuracy in the LDA, SVM, and KNN when the number of muscle (channels) was reduced (p-value>0.05). This indicated that a single muscle can be used to classify four classes of motion (hand close, hand open, wrist flexion, and wrist extension). However, when the accuracy calculated from the ML (LDA, SVM, and KNN) and any combination of channel was pooled, we found that there was a significant difference in accuracy (p-value=0.00659, F=5.55). Even though the mean of accuracy for all ML was almost equal, statistics showed that the machines had a different performance to classify the motion. Based on the descriptive statistics, the mean value of the LDA (99.19%±0.82%) and SVM (99.33%±0.73%) had the highest accuracy among the others, whereas the KNN had the lowest accuracy (97.86%±2.19%). Two independent samples T-test (α=0.05) was performed to examine the significant difference of accuracy between LDA and SVM groups. The results showed no significance difference of accuracy between the LDA and SVM in classifying the motions (p-value>0.05). Based on Figure 10, the mean feature showed the highest accuracy (LDA=99.5%±1.0%, SVM=99.5%±1.0%, and 99.76%±0.48%) whereas entropy showed the lowest (LDA=42.76%±12.17%, SVM=42.9%±12.14%, and 41.82%±12.06%). The results were pooled and calculated based on the combination of all the channels (CH0-CH1-CH2, CH0-CH1, CH0, CH1, and CH2).
Similar result found by the previous study show that the LDA also had better accuracy (97.75%) than other classifiers in the hand motion classification based on EMG signal [5]. In these cases, the Phinyomark used four muscles to discriminate eleven motions. Another study used multilayer perceptron (MLP), SVM and frequency domain to extract the hand motion (HC, HO, WF, and WE). Through the evaluation, the recognition rate (accuracy) was found to be 98% [22], implying that a hybrid combination between physiological parameters and mechanical sensors could improve the performance in pattern recognition. A previous study used a flex sensor for a robotics exoskeleton based on the EMG signal [23]. This study had been performed with an assumption that the subjects were not in fatigue condition, the fatigue parameter was later outlined as a factor in affecting the EMG signal [18]. This study has evaluated the effectiveness of the selected feature, muscle and ML to discriminate the hand motion using a single muscle. In future studies, these findings could be applied for EMG signals generated from amputees for developing a prosthetics hand.
5. CONCLUSION
In summary, the choice of the feature and muscle is critical as it determines the accuracy of machine learning. The statistical feature of mean shows the best accuracy for all machine learning across the combination of channels. Choosing the correct feature and number of muscles could minimize the time consumption in the digital signal processing. Based on the statistical analysis, there is no significant difference in accuracy for the number of muscle (using one, two, or three muscles) (p-value>0.05). It is proved that the usage of a single muscle (whether collected from extensor carpi radialis longus (CH0), flexor carpi
radialis longus (CH1), or flexor carpi ulnaris (CH2)), to classify the motion, is adequate to recognize the
hand motion (hand close, hand open, wrist extension, and wrist flexion). To conclude, LDA and SVM have a higher accuracy than other machine learning in discriminating hand motions.
REFERENCE
[1] M. Hakonen, H. Piitulainen, and A. Visala, “Current state of digital signal processing in myoelectric interfaces and related applications,” Biomed. Signal Process. Control, vol. 18, pp. 334–359, 2015.
[2] D. Brunellli, S. Member, E. Farella, D. Giovanelli, B. Milosevic, and I. Minakov, “Design Considerations for Wireless Acquisition of Multichannel sEMG Signals in Prosthetic Hand Control,” IEEE Sens. J., pp. 1–10, 2016.
[3] R. N. Khushaba, A. Al-timemy, S. Kodagoda, and K. Nazarpour, “Combined influence of forearm orientation and muscular contraction on EMG pattern recognition,” Expert Syst. Appl., vol. 61, pp. 154–161, 2016.
[4] Triwiyanto, O. Wahyunggoro, H. A. Nugroho, and Herianto, “An investigation into time domain features of surface electromyography to estimate the elbow joint angle,” Adv. Electr. Electron. Eng., vol. 15, no. 3, pp. 448–458, 2017. [5] A. Phinyomark, F. Quaine, S. Charbonnier, C. Serviere, F. Tarpin-bernard, and Y. Laurillau, “Expert Systems with
Applic ations EMG feature evaluation for improving myoelectric pattern recognition robustness,” Expert Syst. Appl., vol. 40, no. 12, pp. 4832–4840, 2013.
[6] E. F. Shair, S. A. Ahmad, A. R. Abdullah, M. H. Marhaban, and S. B. Mohd Tamrin, “Determining best window size for an improved gabor transform in EMG signal analysis,” Telkomnika (Telecommunication Computing Electronics and Control), vol. 16, no. 4, pp. 1650–1658, 2018.
[7] J. Too, A. R. Abdullah, N. M. Saad, N. M. Ali, and H. Musa, “A Detail Study of Wavelet Families for EMG Pattern Recognition,” International Journal of Electrical and Computer Engineering (IJECE), vol. 8(6), pp. 4221-4229, 2018.
[8] C. J. De Luca, “The use of surface electromyography in biomechanics,” J. Appl. Biomech., vol. 13, no. 2, pp. 135–163, 1997.
[9] A. Oleinikov, B. Abibullaev, A. Shintemirov, and M. Folgheraiter, “Feature extraction and real-time recognition of hand motion intentions from EMGs via artificial neural networks,” 2018 6th Int. Conf. Brain-Computer Interface, BCI 2018, vol. 2018, pp. 1–5, 2018.
[10] M. Gandolla et al., “Artificial neural network EMG classifier for functional hand grasp movements prediction,” J. Int. Med. Res., 2016.
[11] a Young, L. Smith, E. Rouse, and L. Hargrove, “Classification of Simultaneous Movements using Surface EMG Pattern Recognition,” IEEE Trans. Biomed. Eng., vol. 60, no. 5, pp. 250–258, 2013.
[12] A. Phinyomark, C. Limsakul, and P. Phukpattaranont, “A Novel Feature Extraction for Robust EMG Pattern Recognition,” J. Comput., vol. 1, no. 1, pp. 71–80, 2009.
[13] R. N. Khushaba, A. Al-Ani, and A. Al-Jumaily, “Orthogonal fuzzy neighborhood discriminant analysis for multifunction myoelectric hand control,” IEEE Trans. Biomed. Eng., vol. 57, no. 6, pp. 1410–1419, 2010.
[14] D. Stegeman and H. Hermens, “Standards for surface electromyography: The European project Surface EMG for non-invasive assessment of muscles (SENIAM),” Línea). Dispon. en http//www. med. …, pp. 108–112, 2007.
[15] Martini, Fundamental of Anatomy and Physiology, 9th ed. Boston: Pearson Education, 2012.
[16] C. J. De Luca, “Surface Electromyography Detection and Recording,” DelSys Incorporated, vol. 10, no. 2, pp. 1–10, 2002.
[17] P. McCool, G. D. Fraser, A. D. C. Chan, L. Petropoulakis, and J. J. Soraghan, “Identification of contaminant type in surface electromyography (EMG) signals,” IEEE Trans. Neural Syst. Rehabil. Eng., vol. 22, no. 4, pp. 774–783, 2014. [18] T. Triwiyanto, O. Wahyunggoro, H. A. Nugroho, and H. Herianto, “Muscle fatigue compensation of the electromyography signal for elbow joint angle estimation using adaptive feature,” Comput. Electr. Eng., vol. 71, no. July, pp. 284–293, 2018.
[19] K. Nazarpour, A. H. Al-timemy, G. Bugmann, and A. Jackson, “A note on the probability distribution function of the surface electromyogram signal,” Brain Res. Bull., vol. 90, pp. 88–91, 2013.
[20] A. Phinyomark, F. Quaine, S. Charbonnier, and C. Serviere, “EMG Feature Evaluation for Improving Myoelectric Pattern Recognition Robustness,” vol. 33, no. 0.
[21] M. Atzori et al., “Electromyography data for non-invasive naturally-controlled robotic hand prostheses,” Sci. Data, vol. 1, pp. 1–13, 2014.
[22] D. A. Reyes López, H. Loaiza Correa, M. Arias López, and J. E. Duarte Sánchez, “Expert committee classifier for hand motions recognition from EMG signals,” Rev. Chil. Ing., vol. 26, no. 1, pp. 62–71, 2018.
[23] M. I. Rusydi, M. I. Opera, A. Rusydi, and M. Sasaki, “Combination of Flex Sensor and Electromyography for Hybrid Control Robot,” Telkomnika (Telecommunication Computing Electronics and Control), vol. 16, no. 5, 2018.