Access this article online Quick Response Code: Website:
www.noiseandhealth.org
DOI:
10.4103/1463-1741.102961
PubMed ID:
***
Effects of industrial wind turbine noise on sleep and health
Michael A. Nissenbaum, Jeffery J. Aramini
1, Christopher D. Hanning
2Northern Maine Medical Center, Fort Kent, Maine, USA, 1Intelligent Health Solutions, Guelph, Ontario, Canada, 2University Hospitals of Leicester NHS Trust, Leicester, UK
Abstract
Industrial wind turbines (IWTs) are a new source of noise in previously quiet rural environments. Environmental noise is a public health concern, of which sleep disruption is a major factor. To compare sleep and general health outcomes between participants living close to IWTs and those living further away from them, participants living between 375 and 1400 m (n = 38) and 3.3 and 6.6 km (n = 41) from IWTs were enrolled in a stratified cross-sectional study involving two rural sites. Validated questionnaires were used to collect information on sleep quality (Pittsburgh Sleep Quality Index — PSQI), daytime sleepiness (Epworth Sleepiness Score — ESS), and general health (SF36v2), together with psychiatric disorders, attitude, and demographics. Descriptive and multivariate analyses were performed to investigate the effect of the main exposure variable of interest (distance to the nearest IWT) on various health outcome measures. Participants living within 1.4 km of an IWT had worse sleep, were sleepier during the day, and had worse SF36 Mental Component Scores compared to those living further than 1.4 km away. Significant dose-response relationships between PSQI, ESS, SF36 Mental Component Score, and log-distance to the nearest IWT were identified after controlling for gender, age, and household clustering. The adverse event reports of sleep disturbance and ill health by those living close to IWTs are supported.
Keywords: Health, industrial wind turbines, noise, sleep
Introduction
Environmental noise is emerging as one of the major public health concerns of the twenty-first century.[1] The drive to ‘renewable’, low-carbon energy sources, has resulted in Industrial Wind Turbines (IWTs) being sited closer to homes in traditionally quiet rural areas to reduce transmission losses and costs. Increasing numbers of complaints about sleep disturbance and adverse health effects have been documented,[2-4] while industry and government reviews have argued that the effects are trivial and that current guidance is adequate to protect the residents.[5,6] We undertook an epidemiological study to investigate the relationship between the reported adverse health effects and IWTs among residents of two rural communities. Methods
General study design
This investigation is a stratified cross-sectional study involving two sites: Mars Hill and Vinalhaven, Maine,
USA. A questionnaire was offered to all residents meeting the participant-inclusion criteria and living within 1.5 km of an industrial wind turbine (IWT) and to a random sample of residents, meeting participant inclusion criteria, living 3 to 7 km from an IWT between March and July of 2010. The protocol was reviewed and approved by Institutional Review Board Services, of Aurora, Ontario, Canada.
Questionnaire development
Adverse event reports were reviewed, together with the results of a smaller pilot survey of Mars Hill residents. A questionnaire was developed, which comprised of validated instruments relating to mental and physical health (SF- 36v2)[7] and sleep disturbance ((Pittsburgh Sleep Quality Index (PSQI)[8] and the Epworth Sleepiness Scale (ESS)[9]). In addition, participants were asked before-and-after IWT questions about sleep quality and insomnia, attitude toward IWTs, and psychiatric disorders. A PSQI score > 5 was taken to indicate poor sleep and an ESS score > 10 was taken to indicate clinically relevant daytime sleepiness.[1-4] Responses to functional and attitudinal questions were graded on a five-point Likert scale with 1 representing the least effect and 5 the greatest. The questionnaire is available on request.
Study sites and participant selection
The Mars Hill site is a linear arrangement of 28 General Electric 1.5 megawatt turbines, sited on a ridgeline. The Vinalhaven site is a cluster of three similar turbines sited on
a low-lying, tree-covered island. All residents living within 1.5 km of an IWT, at each site, were identified via tax maps, and approached either door-to-door or via telephone and asked to participate in the study (near group). Homes were visited thrice or until contact was made. Those below the age of 18 or with a diagnosed cognitive disorder were excluded. A random sample of households in similar socioeconomic areas, 3 to 7 km away from IWTs at each site, were chosen to participate in the study to allow for comparison (far group). The households were approached sequentially until a similar number of participants were enrolled. A nurse practitioner supervised the distribution and ensured completion of the questionnaires.
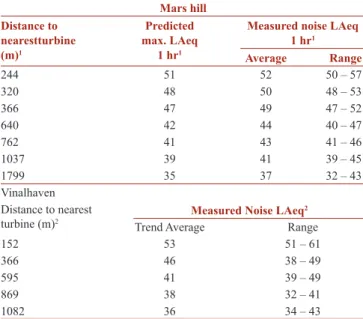
Simultaneous collection of sound levels during data collection at the participants’ residences was not possible, but measured IWT sound levels at various distances, at both sites, were obtained from publically available sources. At the Mars Hill
site, a four quarter study was conducted and data from all four seasons were reported by power outputs at several key measurement points. The measurement points were located on or near residential parcels. The predicted and measured levels at full power were derived from figures in the Sound Level Study, Compilation of Ambient and Quarterly Operations Sound Testing, and the Maine Department of Environmental Protection Order No. L-21635-26-A-N. Measured noise levels versus distance at Vinalhaven were taken over a single day in February 2010, with the turbines operating at less than full power in moderate-to-variable northwest winds aloft (R and R, personal communication, 2011). Table 1 shows the estimated and measured noise levels at locations of varying distances and directions from the turbines at Mars Hill and Vinalhaven.
Data handling and validation
The Principal Investigator (Michael Nissenbaum, MD) did not handle data at any point in the collection or analysis phase. Questionnaire results were coded and entered into a spreadsheet (Microsoft Excel 2007). Each questionnaire generated over 200 data elements. The distance from each participant’s residence to the nearest IWT was measured using satellite maps. The SF36-V2 responses were processed using Quality Metric Health Outcomes™ Scoring Software 3.0to generate Mental (MCS) and Physical (PCS) Component Scores.
Data quality of the SF36-V2 responses was determined using QualityMetric Health Outcomes™ Scoring Software 3.0. All SF36-V2 data quality indicators (completeness, response range, consistency, estimable scale scores, internal consistency, discriminant validity, and reliable scales) exceeded the parameter norms. SF 36-V2 missing values were automatically accommodated by the scoring systems (99.9% questions were completed). No missing values were present for other parameters (ESS, PSQI, psychiatric and attitudinal observations, and demographics).
Statistical analysis
All analyses were performed using SAS 9.22.[10] Descriptive and multivariate analyses were performed to investigate the effect of the main exposure variable of interest (distance to the nearest IWT) on the various outcome measures. Independent variables assessed included the following: Site (Mars Hill, Vinalhaven); Distance to IWT (both as a categorical and continuous variable); Age (continuous variable); Gender (categorical variable). The dependent variables assessed included the following: Summary variables — Epworth Sleepiness Scale (ESS), Pittsburgh Sleep Quality Index (PSQI), SF36-V2 Mental Component Score (MCS), SF36-V2 Physical Component Score (PCS); Before and after parameters — sleep, psychiatric disorders (both self-assessed and diagnosed by a physician), attitude toward IWTs; and Medication use (both over-the-counter and prescription drugs). A P value of < 0.05 was regarded as being statistically significant.
Results
Study participants
Thirty-three and 32 adults were identified as living within 1500 m of the nearest IWT at the Mars Hill (mean 805 m, range 390 – 1400) and Vinalhaven sites (mean 771 m range 375 – 1000), respectively. Twenty-three and 15 adults at the Mars Hill and Vinalhaven sites respectively, completed the questionnaires. Recruitment of participants into the far group continued until there were similar numbers as in the near group, 25 and 16 for Mars Hill and Vinalhaven, respectively [Table 2].
Table 1: Measured and predicted noise levels at Mars Hill and Vinalhaven Mars hill Distance to nearestturbine (m)1 Predicted max. LAeq 1 hr1
Measured noise LAeq 1 hr1 Average Range 244 51 52 50 – 57 320 48 50 48 – 53 366 47 49 47 – 52 640 42 44 40 – 47 762 41 43 41 – 46 1037 39 41 39 – 45 1799 35 37 32 – 43 Vinalhaven Distance to nearest
turbine (m)2 Measured Noise LAeq 2
Trend Average Range
152 53 51 – 61
366 46 38 – 49
595 41 39 – 49
869 38 32 – 41
1082 36 34 – 43
1 Values read or derived from report figures; accuracy + /- 50 m and + /- 1 Db 2 Values obtained with wind turbine noise dominating the acoustical environment, two-minute measurements during moderate-to-variable northwest winds aloft (less than full power)
evidenced by significantly greater mean PSQI and ESS scores [Table 3]. More participants in the near group had PSQI > 5 (P = 0.0745) and ESS scores > 10 (P = 0.1313), but the differences did not reach statistical significance. Participants living near IWTs were significantly more likely to report an improvement in sleep quality when sleeping away from home.
The near group had worse mental health as evidenced by significantly higher mean SF36 MCS (P = 0.0021) [Table 3]. There was no statistically significant difference in PCS (P = 0.9881). Nine participants in the near group reported that they had been diagnosed with either depression or anxiety since the start of turbine operations, compared to none in the far group. Nine of the 38 participants in the near group reported that they had been prescribed new psychotropic medications since the start of turbine operations compared with three of 41 in the far group (P = 0.06).
The ESS, PSQI, and SF36 scores were modeled against distance from the nearest IWT (Score = ln (distance) + gender + age + site [controlled for household clustering]), and the results are shown in Figures 1–3. In all cases, there were clear and significant dose-response relationships (P < 0.05), with the effect diminishing with increasing log-distance from IWTs. Log-distance fit the health outcomes better than distance. This was expected given that noise drops off as the log of distance. Measured sound levels were plotted against distance at the two sites on Figures 1-3.
Statistical results
The binomial outcomes were assessed using either the GENMOD procedure with binomial distribution and a logit link; or when cell frequencies were small (< 5), Fisher’s Exact Test. When assessing the significance between variables with a simple score outcome (e.g., 1 – 5), the exact Wilcoxon Score (Rank Sums) test was employed using the NPAR1WAY procedure. Continuous outcome variables were assessed using the GENMOD procedure with normal distribution. When using the GENMOD procedure, age, gender, and site were forced into the model as fixed effects. The potential effect of household clustering on statistical significance was accommodated by using the REPEATED statement. Effect of site as an effect modifier was assessed by evaluating the interaction term (Site*Distance).
Participants living near IWTs had worse sleep, as
Figure 1: Modeled Pittsburgh Sleep Quality Index (PSQI) versus distance to nearest IWT (mean and 95% confidence limits)Regression equation: PSQI = ln (distance) + sex + age + site [controlled for household clustering]. Ln (distance) p-value = 0.0198
Table 2: Demographic data of Mars Hill and Vinalhaven study participants
Distance (m) from residence to nearest IWT (mean) Parameter 375 – 750 (601) 751 – 1400 (964) 3300 – 5000 (4181) 5300 – 6600 (5800) Sample size 18 20 14 27 Household clusters 11 12 10 23 Mean age 50 57 65 58 Male / Female 10 / 8 12 / 8 7 / 7 11 / 16
Mean time in home1 14 21 30 24
There were no statistically significant differences between the near and far groups with respect to age, gender, or duration of occupation. In addition, Site, and Site*Distance were not significant, indicating that the modeled exposure-outcome relationships were similar across both sites.
Discussion
This study supports the conclusions of previous studies, which demonstrate a relationship between proximity to IWTs and the general adverse effect of 'annoyance',[11-13] but
differs in demonstrating clear dose-response relationships in important clinical indicators of health including sleep quality, daytime sleepiness, and mental health. The levels of sleep disruption and the daytime consequences of increased sleepiness, together with the impairment of mental health and the dose-response relationships observed in this study (distance from IWT vs. effect) strongly suggest that the noise from IWTs results in similar health impacts as other causes of excessive environmental noise1.
The degree of effect on sleep and health from IWT noise seems to be greater than that of other sources of
Table 3: Sleep and mental health outcomes of the study participants grouped by distance from the nearest IWT Distance (m) from residence to nearest IWT (mean)
Parameter 375-750 (601) 751-1400 (964) 375-1400 (792) 3300-5000 (4181) 5300-6600 (5800) 3000-6600 (5248) P-Value1
Mean PSQI2 8.7 7.0 7.8 6.6 5.6 6.0) 0.0461
% PSQI score > 53 77.8 55.0 65.8 57.1 37.0 43.9 0.0745
Mean ESS4 7.2 8.4 7.8 6.4 5.3 5.7 0.0322
% with ESS score > 105 16.7 30.0 23.7 14.3 7.4 9.8 0.1313
Mean worsening sleep score post IWTs6 3.2 3.1 3.1 1.2 1.4 1.3 < .0001
Improved sleep when away from IWTs 9 / 14 5 / 14 14 / 28 1 / 11 1 / 23 2 / 34 < .0001
% New sleep medications post IWTs 11.1 15.0 13.2 7.1 7.4 7.3 0.4711
New diagnoses of insomnia 2 0
Mean SF36 MCS 40.7 43.1 42.0 50.7 54.1 52.9 0.0021
% Wishing to move away post IWTs 77.8 70.0 73.7 0.0 0.0 0.0 < .0001
1 Testing difference of 375 – 1400 m group with 3000 – 6600 m group 2 Pittsburgh Sleep Quality Index 3 PSQI > 5 is considered a ‘poor sleeper’ 4 Epworth Sleepiness Scale 5 About 10 – 20 percent of the general population has ESS scores > 10 6 (New sleep problems + Worsening sleep problem)/2; Strongly Agree (5) - Strongly disagree (1)
Figure 2: Modeled Epworth Sleepiness Scale (ESS) versus Distance to nearest IWT (mean and 95% confidence limits)Regression equation: ESS = ln (distance) + sex + age + site [controlled for household clustering)]. ln (distance) p-value = 0.0331
environmental noise, such as, road, rail, and aircraft noise. Bray and James have argued that the commonly used noise metric of LAeq (averaged noise level adjusted to human hearing) is not appropriate for IWT noise, which contains relatively high levels of low frequency sound (LFN) and infrasound with impulsive characteristics.[14] This has led to an underestimation of the potential for adverse health effects of IWTs.
Potential biases
Reporting and selection biases in this study, if they existed, may have underestimated the strength of the association between distance to IWTs and health outcomes. Both Mars Hill and Vinalhaven residents gain financially from the wind projects, either through reduced electricity costs and / or increased tax revenues. The fear of reducing property values was also cited as a reason for downplaying the adverse health effects. Conversely, the possibility of legal action could result in symptoms being over stated. It was clear to the respondents that the questionnaire was directed at investigating adverse health effects potentially associated with IWT noise and no distractor questions were included. Nevertheless, given the large differences in reported adverse health effects between participants living within 1400 m and those living beyond 3300 m of an IWT, we do not believe that bias alone could have resulted in the differences demonstrated between the groups. In addition, the finding of strong dose-response relationships with log-distance, together with extensive sub-analyses using survey questions more and less likely to be
influenced by bias demonstrating similar results, further support the existence of causative associations.
Visual impact and attitude are known to affect the psychological response to environmental noise.[11,15,16] At both sites, turbines are prominent features of the landscape and were visible to a majority of respondents; at Mars Hill, IWTs are sited along a 200 m high ridge, and Vinalhaven is a flat island. The visual impact on those living closest to turbines was arguably greater than on those living some distance away. Most residents welcomed the installation of IWTs for their proposed financial benefits and their attitudes only changed once they began to operate and the noise and health effects became apparent. Pedersen estimates that, with respect to annoyance, 41% of the observed effects of IWT noise could be attributed to attitude and visual impact.[11] The influence of these factors on other consequences, such as the health effects investigated in this study, remains to be determined. Even as these factors may have contributed to the reported effects, they are clearly not the sole mechanism and health effects are certain.
Mechanisms
A possible mechanism for the observed health effects is an effect on sleep from the noise emitted by IWTs. Industrial wind turbines emit high levels of noise with a major low frequency component. The noise is impulsive in nature and variously described as ‘swooshing’ or ‘thumping’. [12] The character, volume, and frequency of the noise vary
Figure 3: Modeled SF36 Mental Component Score (MCS) versus Distance to nearest IWT (mean and 95% confidence limits)Regression equation: MCS = ln (distance) + sex + age + site [controlled for household clustering]. ln (distance) p-value = 0.0014
with changes in wind speed and direction. Industrial wind turbine noise is more annoying than road, rail, and aircraft noise, for the same sound pressure, presumably due to its impulsive character.[12,15] Pedersen concludes that it is noise that prevents restoration, that those subjected to it are unable to find psychological recovery in their homes because of its intrusive nature.[16] Noise can affect sleep by preventing sleep onset or return to sleep following spontaneous or induced awakening. Clearly, attitude and psychological factors such as noise sensitivity may be important in influencing the ability to fall asleep, but it should be noted that noise sensitivity is, in part, heritable.[17] Noise also affects sleep by inducing arousals, which fragment sleep, reducing its quality and leading to the same consequences as sleep deprivation. [18] There is good evidence that road, rail, and aircraft noise induce arousals and lead to daytime consequences and there is no reason to suppose that IWT noise will not have a similar effect.[19-23] A recent study on the likelihood of different hospital noises that induce an arousal shows a considerable effect of sound character, with impulsive noises being more likely to induce an arousal.[24] It has also been shown that there is individual variability in the likelihood of an arousal in response to noise, which may be predicted from a spindle index, a measure of sleep quality.[25]
ESS assesses daytime sleepiness from the self-assessed propensity to fall asleep in different situations averaged over several weeks.[9] It is widely used in sleep medicine to assess daytime sleepiness, and scores in excess of 10 are deemed to represent clinically relevant excessive daytime sleepiness. If sleep is only disrupted occasionally, the ESS will not be affected, as the sleep deficit can be compensated on other nights. Changes in the ESS score observed in this study imply that sleep has been disrupted to a degree where compensation is not possible in at least some participants. PSQI also examines the sleep quality averaged over a period of weeks, scores in excess of 5 are deemed to represent poor quality sleep.[8] An individual’s score will not be significantly affected by occasional disrupted nights, thus confirming the conclusions drawn from the ESS data. It is noteworthy also that significant changes in ESS and PSQI have been observed, despite the scatter in values indicative of the typical levels of impaired sleep found in the general population.[8,9]
Other mechanisms than sleep disruption cannot be excluded as an explanation for the psychological and other changes observed. Low frequency noise, and in particular, impulsive LFN, has been shown to be contributory to the symptoms of ‘Sick Building Syndrome,’ which has similarities with those reported here.[26,27] Salt has recently proposed a mechanism, whereby, infrasound from IWTs could affect the cochlear and cause many of the symptoms described.[28]
We assessed causality using a well-accepted framework.[29] Although the measured parameters (ESS, PSQI, and SF36)
assess the current status, the evidence of the respondents is that the reported changes have followed the commencement of IWT operation. This is supported by the reported preferences of the residents; the great majority of those living within 1.4 km expressed their desire to move away as a result of the start of turbine operations. However, a study of the same population before and after turbine operation will be necessary to confirm our supposition. We believe that there is good evidence that a time sequence has been established. The association between distance to IWT and health outcome is both statistically significant and clinically relevant for the health outcomes assessed, suggesting a specific association between the factors. Given that this is the first study investigating the association between IWTs and a range of health outcomes, the consistency and replication to prove causation is limited. However, this study includes two different study populations living next to two different IWT projects. Despite these differences, the study site was not a significant effect modifier among any of the measured outcomes. In addition, adverse health effects similar to those identified in this study among those living near IWTs, have been documented in a number of case-series studies and surveys.[2-4,30] Finally, causal association can be judged by its coherence with other known facts about the health outcomes and the causal factor under study. The results of this study are consistent with the known effects of other sources of environmental noise on sleep.
The data on measured and estimated noise levels were not adequate to construct a dose-response curve and to determine an external noise level below which sleep disturbance will not occur. However, it is apparent that this value will be less than an average hourly LAeq of 40 dBA, which is the typical night time value permitted under the current guidance in most jurisdictions.
Conclusions
We conclude that the noise emissions of IWTs disturbed the sleep and caused daytime sleepiness and impaired mental health in residents living within 1.4 km of the two IWT installations studied. Industrial wind turbine noise is a further source of environmental noise, with the potential to harm human health. Current regulations seem to be insufficient to adequately protect the human population living close to IWTs. Our research suggests that adverse effects are observed at distances even beyond 1 km. Further research is needed to determine at what distances risks become negligable, as well as to better estimate the portion of the population suffering from adverse effects at a given distance.
Acknowledgments
We thank Dr. Carl Phillips, Rick James, INCE and Robert Rand, INCE for their review of the manuscript.
How to cite this article: Nissenbaum MA, Aramini JJ, Hanning CD. Effects of industrial wind turbine noise on sleep and health. Noise Health
2012;14:237-43.
Source of Support: Nil, Conflict of Interest: None declared.
“QUICK RESPONSE CODE” LINK FOR FULL TEXT ARTICLES
The journal issue has a unique new feature for reaching to the journal’s website without typing a single letter. Each article on its first page has a “Quick Response Code”. Using any mobile or other hand-held device with camera and GPRS/other internet source, one can reach to the full text of that particular article on the journal’s website. Start a QR-code reading software (see list of free applications from http://tinyurl.com/yzlh2tc) and point the camera to the QR-code printed in the journal. It will automatically take you to the HTML full text of that article. One can also use a desktop or laptop with web camera for similar functionality. See http://tinyurl.com/2bw7fn3 or http://tinyurl.com/3ysr3me for the free applications. Announcement
Address for correspondence:
Michael A. Nissenbaum, MD,
Northern Maine Medical Center, 194 E. Main Street, Fort Kent, Maine 04743, USA
E-mail: mnissenbaum@att.net References
1. World Health Organisation. Night noise guidelines for Europe. Copenhagen. 2009.
2. Frey BJ, Hadden PJ. Noise radiation from wind turbines installed near homes: Effects on health. 2007. [Last cited on 2010 July 18]. Available from: www.windnoisehealthhumanrights.com
3. Pierpont N. Wind Turbine Syndrome: A Report on a Natural Experiment. Santa Fe, (NM): K Selected Publications; 2009.
4. Krogh C, Gillis L, Kouwen N, Aramini J. WindVOiCe, a Self-Reporting Survey: Adverse Health Effects, Industrial Wind Turbines, and the Need for Vigilance Monitoring. Bull Sci Technol Soc 2011;31:334-45. 5. Colby WD, Dobie R, Leventhall G, Lipscomb DM, McCunney RJ, Seilo
MT, et al. Wind Turbine Sound and Health Effects; An Expert Panel
Review. American and Canadian Wind Energy Associations. 2009. [Last cited on 2011 Oct 31]. Available from: www.awea.org/learnabout/ publications/upload/AWEA_and_CanWEA_Sound_White_Paper.pdf 6. National Health and Medical Research Council. Wind Turbines and
Health: A rapid review of the evidence. Australian Government National Health and Medical Research Council. 2010. [Last cited on 2011 Oct 31]. Available from: www.nhmrc.gov.au/_files_nhmrc/ publications/attachments/new0048_evidence_review_wind_turbines_ and_health.pdf.
7. QualityMetric. SF-36v2 Health Survey. [Last cited on 2011 Oct 31]. Available from: www.qualitymetric.com/WhatWeDo/ SFHealthSurveys/ SF36v2HealthSurvey/tabid/185/Default.aspx.
8. Buysse DJ, Reynolds CF 3rd, Monk TH, Berman SR, Kupfer DJ. The Pittsburgh Sleep Quality Index (PSQI): A new instrument for psychiatric research and practice. Psychiatry Res 1989;28:193-213.
9. Johns MW. A new method for measuring daytime sleepiness: the Epworth sleepiness scale. Sleep 1991;14:540-5.
10. SAS/STAT 9.22 User’s guide. SAS Institute Inc. 100 SAS Campus Drive Cary, NC 27513-2414 USA.
11. Pedersen E, van den Berg F, Bakker R, Bouma J. Response to noise from modern wind farms in The Netherlands. J Acoust Soc Am 2009;126:634-43.
12. van den Berg GP, Pedersen E, Bouma J, Bakker R. Project WINDFARMperception. Visual and acoustic impact of wind turbine farms on residents. FP6-2005-Science-and-Society-20. Specific Support Action Project no. 044628. 2008.
13. Shepherd D, McBride D, Welch D, Dirks KN, Hill EM. Evaluating the impact of wind turbine noise on health-related quality of life. Noise Health 2011;13:333-9.
14. Bray W, James R. Dynamic measurements of wind turbine acoustic signals, employing sound quality engineering methods considering the time and frequency sensitivities of human perception. Proceedings of Noise-Con; 2011, July 25-7;Portland, Oregon.
15. Pedersen E, Waye KP. Perception and annoyance due to wind turbine noise--a dose-response relationship. J Acoust Soc Am 2004;116:3460- 70. 16. Pedersen E, Persson Waye K. Wind turbines – low level noise sources
interfering with restoration? Environ Res Lett 2008;3:1-5.
17. Shepherd D. Wind turbine noise and health in the New Zealand context. In: Rapley B, Bakker H, editors. Sound, Noise, Flicker and the Human Perception of Wind Farm Activity. Palmerston North, New Zealand: Atkinson and Rapley Consulting Ltd; 2010. p. 13-63.
18. Meerlo P, Sgoifo A, Suchecki D. Restricted and disrupted sleep: effects on autonomic function, neuroendocrine stress systems and stress responsivity. Sleep Med Rev 2008;12:197-210.
19. de Kluizenaar Y, Janssen SA, van Lenthe FJ, Miedema HM, Mackenbach JP. Long-term road traffic noise exposure is associated with an increase in morning tiredness. J Acoust Soc Am 2009;126:626-33.
20. Basner M, Glatz C, Griefahn B, Penzel T, Samel A. Aircraft noise: Effects on macro- and microstructure of sleep. Sleep Med 2008;9:382-7. 21. Basner M. Nocturnal aircraft noise exposure increases objectively
assessed daytime sleepiness. J Sleep Res 2008;17:Suppl 1;P512. 22. Elmenhorst E, Basner M. Effects of Nocturnal Aircraft Noise (Volume 5):
Performance. Institute of Aerospace Medicine of the German Aerospace Center (DLR), Cologne. DLR-Forschungsbericht 2004-11. 2008. 23. Elmenhorst EM, Elmenhorst D, Wenzel J, Quehl J, Mueller U, Maass H,
et al. Effects of nocturnal aircraft noise on cognitive performance in the following morning: dose-response relationships in laboratory and field. Int Arch Occup Environ Health 2010;83:743-51.
24. Solet JM, Buxton OM, Ellenbogen JM, Wang W, Carballiera A. Evidence-based design meets evidence-based medicine: The sound sleep study. Concord, CA: The Center for Health Design. 2010. [Last cited on 2011 Oct 31]. Available from: http://www.healthdesign.org/ sites/default/files/Validating%20Acoustic%20Guidelines%20for%20 HC%20Facilities_Sound%20Sleep%20Study.pdf.
25. Dang-Vu TT, McKinney SM, Buxton OM, Solet JM, Ellenbogen JM. Spontaneous brain rhythms predict sleep stability in the face of noise. Curr Biol 2010;20:R626-7.
26. Niven RM, Fletcher AM, Pickering CA, Faragher EB, Potter IN, Booth WB, et al. Building sickness syndrome in healthy and unhealthy buildings: An epidemiological and environmental assessment with cluster analysis. Occup Environ Med 2000;57:627-34.
27. Persson Waye K, Rylander R, Benton S, Leventhall HG. Effects on performance and work quality due to low frequency ventilation noise. J Sound Vib 1997;205:467-74.
28. Salt A, Kaltenbach J. Infrasound From Wind Turbines Could Affect Humans. Bull Sci Technol Soc 2011;31:296-302.
29. Susser M. Criteria of Judgment. In: Causal Thinking in the Health Sciences - Concepts and Strategies of Epidemiology. New York: Oxford University Press; 1973.
30. Phillips C. Properly Interpreting the Epidemiologic Evidence About the Health Effects of Industrial Wind Turbines on Nearby Residents. Bull Sci Technol Soc 2011;31:303-15.