A Data Model for Historical GIS: The CHGIS Time Series
Merrick Lex Berman China Historical GIS Harvard Yenching Institute October 2003
Abstract:
The CHGIS project was established to provide a fully documented database of historical
administrative units in China, from the formation of the first Chinese Empire (222 BCE) to the fall of the last Dynasty (1911 CE). Records in the relational database are also linked to geographic objects in GIS. In other words, for each record there are associated spatial objects in GIS layers which can be used to represent the historical places on a digital map.
To accomplish this task, we had to clearly define what constitutes an historical administrative unit, and we had to devise a method of querying the resulting database to answer several fundamental questions about historical places, namely:
can we find all the units that were in existence at a particular date?
can we search for placenames and find the correct record among ambiguous results? can we filter the results by feature type?
can we determine the place in the administrative hierarchy for a particular place? can we show how a particular place changes over time?
The following description of the CHGIS time series database examines the ways in which the current data model satisfies these basic requirements, with illustrated examples of the basic problems encountered when trying to keep track of spatial objects as they--and their attributes!--change over time.
1.1 Rules Regarding Creation of Records in the Database
According to the basic requirements for the CHGIS project, there were three primary types of change to be recorded in the database:
change in placename change in administrative type
change in location, area, or boundary
This proves to be a sound basis for tracking named places, as it has also emerged as the basis for tracking places in large digital gazetteer projects, such as the Alexandria Digital Gazetteer Content Standard. [ADL-Gaz] The ADL standard defines the core elements needed for any digital gazetteer entry as: placename, category, footprint. These are directly comparable with our placename, feature type, and spatial object. For historical records, we need only add a valid date range to complete the minimum required attributes.
Let us briefly clarify our definition of the digital gazetteer core elements with some examples. Our placenames must allow us to know that unique instances of places existed sometime and
somewhere called Constantinople and Istanbul. Similarly, unique records must exist so that we can distinguish between multiple instances of the identical placename, like Paris #1, the capital of France, and Paris #2, the small town in Texas. Our feature types must distinguish for us that Paris #1 was of the type = national capital, while Paris #2 was of the type = town. Finally, the spatial objects have to be defined as unique records in various GIS layers, which are separated thematically and also, for technical reasons, into data types of point, lines, and polygons. Our record for Paris #1 may be represented by a single point of latitude and longitude coordinates,
corresponding to the administrative office location. Paris the point would be placed at the City Hall building, for example. Or, Paris #1 could be represented BOTH by the point just mentioned AND by a polygon, which would be the area of jurisdiction of Paris, ie. the municipal boundary of the city of Paris.
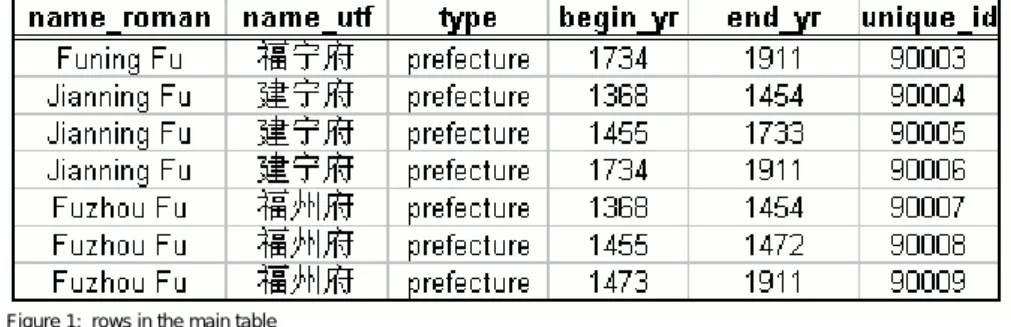
The CHGIS project records the three core elements for each historical place in the main table, to which a new row is added whenever one of the three core elements change. For our purposes each row is called an historical instance and is defined as a record with a valid period of time during which the placename, feature type, and spatial object all remained unchanged, lasting from a specific begin date to a specific end date. Should any of these three attributes change, a new record is added to the database. In Figure 1 we show actual records from the CHGIS database. Each of these records constitute a single historical instance and have their own unique ID number. Notice that Jianning Fu is listed three times. The first instance of Jianning Fu was valid from 1368 to 1454, and the second instance of Jianning was valid from 1455 to 1733.
Figure 1: rows in the main table
Since the placename and feature type are identical for all three instances of Jianning Fu, we need to provide some more information about what constituted the changes. To do this the records in the main table include a begin change type and an end change type for each row in the database. In the Figure 2 the relevant columns are shown:
Figure 2: definition of change types
From these columns we can now see that the first record for Jianning Fu appears in 1368 because its name was changed to Jianning Fu. In 1455, the jurisdiction area increased, which means that the spatial object or boundary used to represent Jianning Fu with ID # 90004, was no longer valid. As a consequence of this change, the new instance with ID # 90005 is created to reflect the new, larger area, which remains valid until the year 1733, when the area is reduced. The final record with ID # 90006 remains valid up to the last year of the database coverage, 1911. By recording the change types we can now distinguish why Jianning Fu, as a prefecture, has three separate instances, even though its name and administrative unit type did not change.
1.1 Areas of Jurisdiction Contrasted with Administrative Seats
In most cases, the geography of administrative units in China are defined in two ways: by the area over which they have jurisdiction, and by the location of the administrative seat. Using GIS technology it is possible to define both a polygon (to represent the area of jurisdiction) and a point (to represent the administrative seat) for a single record. However, in the production of CHGIS datasets, we found that boundary changes and changes of administrative seat locations very
often do not occur at the same time. In addition, there are various special cases, such as an office serving as administrative seat for a particular jurisdictional area but which is not actually located within that area. These and other factors forced us to keep track of the area of jurisdiction and the administrative seat for any particular historical place as separate objects in separate GIS layers. These polygon and point objects each had their own unique ID numbers respectively, even though they had identical placenames and identical feature types, and while their valid time periods overlapped.
After the objects were sorted out separately, they were then joined into the main table, which means that any row in the CHGIS main table representing an administrative area will have two unique spatial objects identified with it: both a polygon (identified by a unique BOUNDARY ID) and a point (identified by a unique POINT ID). Following our previous example, we find the CHGIS main table contains the entries shown in Figure 3.
Figure 3: separate boundary and point id numbers
In Figure 3 we can see that during the span of time from 1368 to 1911 three instances were needed to represent the changing area of jurisdiction of Jianning Fu, but that the location of the administrative seat did not change. Therefore there are three unique boundary ids for the instances, but only one point id was needed.
This method of associating two types of id number with each row in the main table is an
expedient way of tracking both areas of jurisdiction and administrative seats at the same time. It prevents the duplication and overlapping of rows in the database which essentially define
different functions of the same historical place. One consequence of adopting this method should be noted: in the same way that one point id can overlap several instances of boundary ids, the opposite effect will occur whenever the location of an administrative seat moves. In Figure 4 we see a case in which the administrative seat moved while the jurisdiction area, placename and feature type all remain unchanged.
Figure 4: effect of change in administrative seat location – new point id
In this example, Wuxing Jun had the same jurisdictional area from the year 304 to the year 421. Therefore the boundary id = 90078 remains unchanged. But within that span of time, in the year 405, the administrative seat was moved to a different location. As a result, a new row was added to the main table indicating the point id of the new administrative seat.
1.2 Administrative Feature Type and Ad ministrative Hierarchy
One thing that we must further clarify is the definition of “administrative status,” which is composed of two quite different elements. First, we have administrative type, a kind of feature type, which is simply the category of a particular administrative unit that applies to a particular record. With administrative type we are simply defining the type of unit for a record, such as differentiating “national capital” from “town” as mentioned above. The second element of “administrative status” is the part of relationship that is needed to understand the place in the administrative hierarchy. For example, we may know that three points have administrative feature type = “town,” but we don’t know which jurisdiction they are under.
To keep track of the administrative hierarchy, we need to establish relationships between records in a separate table showing “containership,” which is to say that one record is part of another record. A real life example would be that Mengla County is part of Xishuangbanna District, and Xishuangbanna District is part of Yunnan Province. The part-ofrelationship to a parent
jurisdiction will change, while the administrative type of the subordinate unit will remain the same, as shown in Figure 5:
Figure 5: changes in part of relationship
In the first instance, time 1, we see that county A and county B are two different areas and that towns 1, 2, and 3 are part of county A. But in the second instance, time 2, a change has occurred: county A has been abolished and all of its territory transferred to the jurisdiction of county B. So the database must track not only county A’s dissolution, but also the change of relationship for towns 1, 2, 3, which became part of county B. The important thing to keep in mind is that the towns 1, 2, 3 have not changed themselves, only the relationship to the unit they are part of has changed!.
1.3 Tracking the Administrative Hierarchy with PartOf Table
The Part Of Table records the parent jurisdiction for the administrative units in the Main Table, from the county level up to the top level. This works based on a principle of containership, where a given CHILD unit is listed as part of a particular PARENT unit for a specific period of time. In Figure 6 Youxi Xian is shown as being Part Of Guiji Jun, during the years 14-22, while Guiji Jun is shown as being Part Of Xinmang during the years 9-23.
Figure 6: part of table
Based on the records shown above, we can discover that Youxi Xian was part of Guiji Jun and Guiji Jun was part of Xinmang. Note that this is only true because the period of time that Guiji Jun was part of Xinmang begins earlier and ends later than the period of time that Youxi Xian was part of Guiji Jun. This is a case of temporal containership. Temporal relationships between
objects in the database are subject to almost identical types of overlapping behavior as spatial relationships, illustrated in Figure 7.
Figure 7: comparison of spatial and temporal relationships
The right side of the illustration helps us to visualize the ways in which our dated historical instances co-exist on the temporal plane. Records that follow one another in sequence are adjacent. If the end date of one record is later than the begin date of another record, then they must overlap. If the there is a gap between the end date of one record and the begin date of another record, they must be discontinuous. And when the valid span of time for a particular record lies completely within that of another record it is an example of containership.
When dealing with the historical places recorded in CHGIS, we need to keep in mind that Parent Units change asynchronously from their Children. That means that a Parent Unit might expand, contract, change its name, or change location of its capital seat within the span of time for which a Child Unit is valid. From the theoretical perspective, the temporal divisions of Parent and Child records might look something like Figure 8:
Figure 8: temporal overlap of parent and child records
In Figure 8, we can see that it is not possible to simply list one Part Of relationship for the Child Unit that began at time 23 and ended at time 92. Because the Parent Unit itself changed three times during that period, we would need to establish four unique relationships from the Child Unit to all of the temporally overlapping parent records. This can be done as shown in Figure 9.
It is very important to note that the first Part Of record begins at time 23, because we are indicating that the Child Unit, Red, was within the jurisdiction of the Parent, Blue, so the begin date must match the begin date of the Child. However, the subsequent two changes of the Parent, Blue, occurred at times within the valid span of the Child Unit itself, and therefore the begin and end dates match those of the temporally contained Parent instances. Similarly the end date of the Child Unit is used as the final date. As a rule, the dates of relationship rows must match the Begin and End dates of the Child, except in cases where the Parent Unit's dates are temporally
contained within the valid period of the Child Unit.
Let's take the above example and see how it is actually implemented in the CHGIS Part Of Table. The example shown in Figure 10 is for Fu Zhou, which is valid from 758 to 932.
Figure 10: part of table example
As you can see, for the single historical instance of Fu Zhou (758 CE to 932 CE), there were four temporally overlapping Parent Instances. The first relationship row matches the Begin Date of the Child, and the last relationship row matches the End Date of the Child, while the intervening relationships match the dates of the temporally contained Parent instances.
1.4 Tracking Sequence of Changes over Time
Like the administrative hierarchy, which expands as a tree structure from the central government down to the local administrative offices, the sequence of changes for particular historical places is also a network system. The temporal sequence is actually a network of preceding historical instances to subsequent instances. In the temporal network we simply follow the changes recorded in the main table, from one change to the next, regardless of whether they are changes in placename, type, or spatial object. We only seek to establish which instance was preceded by another instance.
Tracking preceding instances is much easier than tracking part of relationships because there is no need to consider begin and end dates. By default all relationships in the temporal sequence table are adjacent or discontinuous, and all we need to be able to do is to explicitly track the sequence of changes from one instance to another. The records in the temporal sequence table corresponding to the earlier example for Jianning Fu are shown in Figure 11.
Figure 11: temporal sequence table
Here we see that the instance of Jianning Fu with ID# 90006 was preceeded by ID # 90005. Because the main table contains the actual valid dates for 90006 (1734 to 1911) and 90005 (1455 to 1733), there is no need to include the dates. Once this table is established we can construct queries to trace the development of any place either forward or backward in time.
It is worth mentioning the case of preceding instances which merge or split into other instances as shown in Figure 12.
Figure 12: areas that merge and split
Here we see an example of areas B and C that merge into area 1, and another example of area A that is split up into three new areas 2, 3, and 4. The important thing to consider is that it doesn’t matter whether only a percentage of a an areal unit was merged or split into its subsequent unit, because all we need to do is to IDENTIFY a preceding or subsequent unit. Once we have accomplished that task we can use GIS overlay procedures to see which portion of any antecedent was absorbed, and to calculate the exact areas involved.
Therefore the main task of the temporal sequence table is limited to creating an explicit temporal chain of events, without which there is no way to automatically determine which units preceded or followed one another.
2.1 Implementation of the Time Series Data Model
The practical implementation of the tables described above was done in MySQL with the main objectives being:
• Normalize data into the minimum number of tables needed to handle query operations • Create queries in standard SQL (structured query language) for maximum portability • Allow for the integration of unrelated datasets, as long as they had the minimum core
elements
Figure 13: chgis mysql implementation
Note the addition of the Alt Name Table, which was not previously mentioned. Since each row in the Main Table has a very specific reason for being added to the database, we must not duplicate rows in the Main Table to provide alternate romanizations or variant placenames. Therefore, in order to extend the list of possible romanized forms to include Pinyin, Wade-Giles, or non-standard variant spellings, we simply dumped all possible spellings into the Alt Name Table. In addition, the feature types, valid dates, and original data source are listed for each record in the Alt Name Table, which then serves as the point of entry for all queries. The resulting indexed Alt Name Table contained some 250,000 records, including the various romanized placenames as well as vernacular placenames in Unicode UTF-8 character set. Because the initial query can be done with a single indexed table requiring no joins, average processing time for queries on the production server was acceptably fast for accessing over the Internet, in the range of 0.02 to 0.04 seconds.
From the initial list of hits returned out of the Alt Name Table, a second query for details about one of the records is then conducted. The second query is no longer based on a search string, but uses the unique ID number for a particular record to collect information from the remaining tables. In this way, various attributes about any particular historical instance in the database are obtained, including the change type, present location, unique ID number, link to source notes, lat – long coordinates, original filename where the GIS spatial object for this record can be found, as well as the romanized placename, vernacular placename, feature type, and valid dates, which were available in the initial query.
Integrating records from other datasets requires formatting the data into the required tables and data types. To test the integration process, the China in Time and Space (CITAS) County Boundary records for 1990 were recompiled into the CHGIS data format. [CITAS] The CITAS data consists of 2,452 records of county level units for the year 1990 in ESRI shapefile format, including placenames in Pinyin, vernacular names in BIG-5 character set encoding, and 1990 Guobiao Code Numbers. [Guobiao] Centroid points were generated for each polygon, and all the attributes were exported to spreadsheets. The vernacular names were converted from BIG-5 encoding to UTF-8, and each record was assigned a feature type from an extended list
developed at the CHGIS Harvard office. The original CITAS data ID numbers--GuoBiao Codes-- were given a prefix [cts_] to distinguish them from the CHGIS ID numbers. Once formatted into the appropriate tables and loaded into the MySQL database, the CITAS data could be queried simultaneously along with the CHGIS data.
With the CITAS proof of concept accomplished, we decided to integrate the largest publicly available dataset of named geographic features in China, which is made available by the
GeoNames Server division of the National Imagery and Mapping Agency (NIMA). [NIMA] The NIMA dataset consists of 148,000 unique names for some 90,000 unique features. Roughly two thirds of the names features are for populated places or administrative units, while the rest are primarily physical features, such as rivers, mountains, coastal rocks, etc. Although the NIMA dataset contains no vernacular names in Chinese, it does contain numerous romanizations for various features, so it provides an excellent test for the efficiency of the Alt Name Table. Once reformatted into the appropriate tables, the NIMA data could be queried along with the rest of the items in the database without any difficulty.
Finally, a dataset of historical geographic features produced by the Russian Academy of Science, Institute of Geography (RAS) was integrated into the CHGIS database. [RAS] The RAS datasets have been digitized from historical maps located in several Russian map archives, and cover the frontier regions of China: South Central Tibet, Kham, Qinghai, Xinjiang, and Mongolia. The vernacular language of the original maps was preserved, resulting in the addition of Russian Cyrillic names into the database. Since the RAS datasets were produced in collaboration with CHGIS, no special reformatting was required, and they were integrated into the existing database after a straightforward conversion of Windows 1251 Russian character set to UTF-8. [UTF-8] The successful integration of three independently produced datasets into the CHGIS database demonstrates the potential for adding more in the future. The opportunity for adding specialized lists of named features such as important Buddhist temples, ceramics kilns, and archaeological sites are currently being explored.
2.2 How to Query Time Series GIS Data
In the previous section we discussed the integration of various datasets into the CHGIS database. It is worth noting that none of the additional datasets being integrated contained records for
historical instances of places. Each record in those independently created datasets had a single valid year, which we define as a “time slice.” Generally speaking, GIS desktop mapping software systems have been developed to display a set of geographic objects which are current for a single date, showing the spatial relationship of objects that existed in the same “time slice”. By contrast when we are working in GIS with a time series of spatial objects each of which have different temporal values, we are using a tool that has been developed to visualize spatial
relationships alone to attempt to visualize both spatial and temporal relationships simultaneously. As a result, all the spatial objects seem to overlap one another resulting in a visually confusing stack.
In the following Figure 14, the spatial objects with unique temporal values are shown on the left as they would appear separately, and on the right as they would appear stacked up in two different sequences. GIS objects will stack up in the order that the record is processed by the software, which is generally the order of the records in the table. This results in visually misleading representations, such as the bottom right stack, where one of the objects has been completely hidden by another.
Figure 14: temporally distinct objects overlap spatially
How can we make sense of the spatially overlapping but temporally distinct objects? The CHGIS datasets include eight layers of time series GIS data, all of which appear as a visually
unintelligible stack when first opened. What we have provided are all of the historical instances of the areas or points for which we have information, so to obtain a subset of objects that make sense visually we need to select out the objects which are valid for a particular year. To do this we use a simple query with the following syntax, where the desired year is called [input year]: Select * where BEG_YR <= [input year] and END_YR >= [input year]
In essence this finds all objects in the GIS layer which had a begin year value less than or equal to the [input year] and an end year value greater than or equal to the [input year]. For a concrete example, let’s see what the results would be when we run the query for the year 188 CE in the layer of Prefectures (for Southeast China) which contains valid records between –222 BCE and 1911 CE. Our query: BEG_YR <= 188 and END_YR >= 188 finds four records, listed in Figure 15. As you can see, each record was valid for the year 188.
Figure 15: selection of objects valid for the year 188
The visual representation of the selected objects is shown highlighted in yellow on the right side of Figure 15. Each of the four selected objects can now be seen without being inadvertently buried in a stack of objects which did not also share the valid date of 188. In this way, users of the time series data may search for unique historical instances as they changed over time in a single layer, and may also select out relevant data for a particular date.
2.3 Web-Based Search Engine
Many potential users of CHGIS data, or for that matter, any other kind of historical geographic data, may be unwilling or unable to acquire and learn how to use GIS software. The many considerations explored in this paper might send them running for the nearest printed atlas, rather than inspire them to experiment with GIS. Indeed, it is quite reasonable to expect the majority of students, scholars, teachers, librarians, travelers, and Internet surfers to have only occasional need of looking up geographic information about China, much less teach themselves the myriad processes of administrative change at various times throughout history. For all of these people we have devised a convenient search engine.
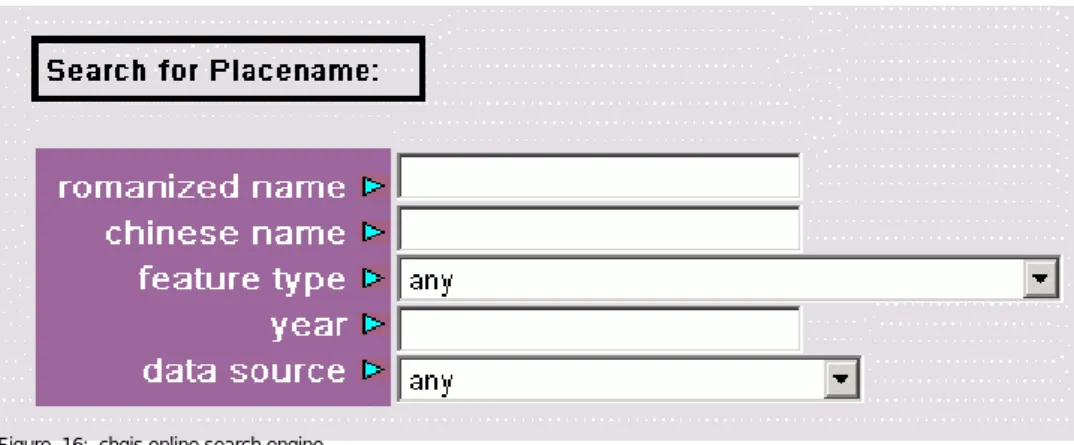
The search engine is written in PHP scripting language, which accesses the MySQL database, and passes requests for maps on the fly to MapServer software. [MapServer] That being said the interface is extremely simple, as shown in Figure 16.
Figure 16: chgis online search engine
Users may input a name, and filter by type, year, and data source. Or they may look for all objects of a particular type, or all objects valid for a particular year, etc. The only input combination that is not allowed is to leave all the input values blank.
The initial search will present a list of possible matches. Each of these matches may be explored in turn to obtain complete details. The complete details include romanized placename,
vernacular placename, valid dates, feature type, ID number, present location, data source, parent jurisdiction, lat – long coordinates, GIS filename containing the spatial object, a link to original source notes, and an simple guide map showing roughly where the object is located.
The user may follow up by accessing the original source notes (in vernacular text, UTF-8 encoding), by viewing the details for the immediate parent jurisdiction, or by launching an interactive webmap. Although the search engine does not offer anything in the way of GIS functionality, it is quite suitable as a reference tool, and gets some 500 to 1,000 hits per day. Since it requires no special software or training, the search engine also serves as an excellent introduction to the materials provided in the CHGIS datasets.
A web-based search engine plays an essential role in delivering the contents of the CHGIS databases to the largest audience of potential users. Despite the complexities inherent in developing a spatio-temporal GIS system, the practical implementation of the data model described in this paper can help to bridge the gap between those seeking to drill down into the contents of a database but who lack the software and training to crack open the tables and write SQL queries themselves. We hope that the ideas presented here will be of some assistance to others working on similar projects.
Notes:
[ADL-Gaz] Alexandria Digital Library Gazetteer Content Standard
http://alexandria.sdc.ucsb.edu/~lhill/adlgaz/
[CITAS] China In Time and Space
http://citas.csde.washington.edu/data/cntybnd/overview.htm
[Guobiao] "Zhonghua renmin gongheguo xingzhengquhua daima"
(Codes for the administrative divisions of the PRC) - GB 2260 - 91 Beijing: Guojia jishu jianduju, 1992.
[MapServer] University of Minnesota http://mapserver.gis.umn.edu/
[NIMA] National Imagery and Mapping Agency, GeoNames Server
http://www.nima.mil/gns/html/cntry_files.html
[RAS] Russian Academy of Science, Institute of Geography
"From Tibet to Altai, Russian Historical Maps of China"
http://www.nima.mil/gns/html/cntry_files.htmlhttp://www.fas.harvard.edu/~chgis/data/rus_geo/
[UTF-8] Conversions to Unicode UTF-8 were done with two freeware tools.
Encoding Converter 2.1 - developed for CHGIS by Miho Nakanishi, converts from various East Asian CJK character sets to UTF-8.
http://cocochino.com/candy/candy.php
UniRed - unicode plain text converter from Russian Cyrillic Win 1251 to UTF-8. http://www.esperanto.mv.ru/UniRed/ENG/index.html