This is a postprint of a paper submitted to and accepted for publication in IEEE Transactions on Smart Grid [http://dx.doi.org/10.1109/TSG.2015.2439512] and is subject to IEEE copyright.
Abstract—A novel technique for loss of mains (LOM) detection, using Phasor Measurement Unit (PMU) data, is described in this paper. The technique, known as the Peak Ratio Analysis Method (PRAM), improves both sensitivity and stability of LOM protection when compared to prevailing techniques. The technique is based on a Rate of Change of Frequency (ROCOF) measurement from M-class PMUs, but the key novelty of the method lies in the fact that it employs a new “peak-ratio” analysis of the measured ROCOF waveform during any frequency disturbance to determine whether the potentially-islanded element of the network is grid connected or not. The proposed technique is described and several examples of its operation are compared with three competing LOM protection methods that have all been widely used by industry and/or reported in the literature: standard ROCOF, Phase Offset Relay (POR) and Phase Angle Difference (PAD) methods. It is shown that the PRAM technique exhibits comparable performance to the others, and in many cases improves upon their abilities, in particular for systems where the inertia of the main power system is reduced, which may arise in future systems with increased penetrations of renewable generation and HVDC infeeds.
Index Terms—Phasor Measurement Unit (PMU), Loss of Mains Protection (LOM), Distribution Networks, Monitoring, Control and Protection.
NOMENCLATURE ADC Analog to Digital (convertor) DFT Discrete Fourier Transform DG Distributed Generator FFT Fast Fourier Transform FIR Finite Impulse Response GPS Global Positioning System LOM Loss of Mains
NDZ Non-detection Zone PAD Phase Angle Difference
PF Power Factor
PMU Phasor Measurement Unit POR Phase Offset Relay
PRAM Peak Ratio Analysis Method
This work was supported by University of Strathclyde, UK.
Feng Ding is with the University of Strathclyde, UK. (Corresponding author; phone: 0044-141-548-4839; E-mail: [email protected]).
Campbell Booth is with the University of Strathclyde, UK. (E-mail: [email protected]).
Andrew Roscoe is with the University of Strathclyde, UK. (E-mail: [email protected]).
PV Power and Voltage (control) RMS Root Mean Square
ROCOF Rate of Change of Frequency VS Vector-Shift
I. INTRODUCTION
OM occurs when part of the utility network containing DG is disconnected from the remainder of the system. In some cases, DG can be capable of supplying loads within an island and the islanded system can remain stable. However, safety issues arise if LOM persists and islanded operation is not permitted in the majority of utility systems throughout the world. Wide area measurements using synchronized phasor measurements, which are beginning to play an increasing role in monitoring and control in transmission networks [1], may offer opportunities to improve the performance of LOM protection in distribution networks, but may require some form of communications. Detecting LOM will become increasingly important in the future as ever-increasing amounts of DG will be connected to increase renewable energy sources, reduce emissions and power transmission and distribution losses [2][3].
Commonly-adopted LOM detection methods include ROCOF and VS, both of which are relatively sensitive to genuine islanding events. However, incorrect operation of LOM protection may arise during major non-LOM disturbances on the system [4]. Alternative techniques for LOM protection have been proposed by other researchers and these include detection based on rate of change of voltage [5], vector surge techniques [6] and harmonic impedance estimation methods [7]. Active techniques have also been proposed, which involve injecting signals to the network and observing responses [8]; however these may adversely affect power quality. The method outlined in this paper is entirely passive and does not require communications.
The proposed method is very fast acting, highly sensitive and stable to non-LOM transients. This paper focuses on analysis of the dynamic behavior of the ROCOF measurement during disturbances to enhance the operation of LOM protection.
PMUs are being increasingly deployed in many parts of the world as they can provide highly accurate voltage and current phasor measurements that can be used for many monitoring, control and protection applications [9][10]. Frequency and ROCOF can be readily calculated by PMU devices. In 2011 the phasor measurement standard IEEE C37.118.1 (measurements)
Feng Ding, Campbell D. Booth, and Andrew J. Roscoe,
Senior Member, IEEE
Peak-ratio analysis method for enhancement of
LOM protection using M class PMUs
This is a postprint of a paper submitted to and accepted for publication in IEEE Transactions on Smart Grid [http://dx.doi.org/10.1109/TSG.2015.2439512] and is subject to IEEE copyright.
and C37.118.2 (data transfer) were published [11][12]. These standards define exacting requirements in terms of measurement performance during dynamic events and harmonic/interharmonic signal content. These standards define upper limits on filter window length, specified by latencies and response times. Measurement of frequency is based on the derivative of the measured phase angle with respect to time, and ROCOF requires a further differentiation of frequency.
These two differentiation stages make the measurement of ROCOF highly susceptible to instrumentation and sampling noise, and to interfering harmonic or inter-harmonic signals [13][14]. It has been identified by the IEEE synchrophasor working group WG-H11 and several other researchers that the measurement of ROCOF is extremely difficult to accomplish during these conditions. Furthermore, there is no standard governing the performance of traditional “ROCOF-based” relays and methods and performance varies widely between manufacturers. Only through careful filter design and use of long enough windows can ROCOF accuracy and noise/ripple be contained within acceptable levels. Therefore, the use of a PMU algorithm to measure ROCOF is justified even without using its synchrophasor, since it gives at least a minimum level of guaranteed and standardized performance. Recently, an amended standard, C37.118.1a [15], has been published which increases the limit of ROCOF accuracy/noise/ripple during nominal conditions to between 0.1 and 0.4 Hz/s, reflecting the difficulty that some PMU devices have in making accurate ROCOF measurements.
Most actual M-class PMU devices can demonstrate lower accuracy/noise/ripple than 0.1 Hz/s during “normal” grid conditions (i.e. without excessive flicker/inter-harmonics, harmonics, or ROCOF events), but the possibility of excessive ROCOF measurement errors under transient conditions must always be considered. Accounting for knowledge of typical PMU behaviour, two M class PMUs with reporting rates (fs) of 50 Hz have been used in simulation to provide an appropriately accurate and timely ROCOF response to islanding events and other disturbances. Such PMUs have window lengths of approximately of 5-6 cycles.
Another challenge associated with the use of PMUs is concerned with calculating phasors during system transients when the measuring window contains segments of waveforms both before and after the initiation of the transient event. Commonly, it is suggested that such data (and calculated phasors) should be discarded and not used by any application [16]. However, this paper analyzes these phasors (referred to as “fake” phasors in [16]) during disturbances to extract information that can be used to execute more effective LOM protection. These “fake” phasors are calculated over a very short time period (dependent on the measuring window of the PMU) after the initiation of the system transient. The operation of DFT/FFT to estimate phasors during transient conditions is explained further in section II of this paper.
The objective of this paper is to present the results of a detailed investigation into the performance of the proposed method in detecting LOM conditions, both in terms of
sensitivity to a wide range of true LOM events and stability against non-LOM transients (short circuit faults, load changes, capacitor switching and transformer inrush). The performance of PRAM is compared against the prevailing ROCOF technique, and also against two other techniques that have been reported in the literature as exhibiting improved performance over ROCOF, namely POR [17] and PAD [18]. It is important to note that the PRAM technique does not require communications or data from several PMUs – it is a local technique; although communications could of course be used to trip multiple generators in an area that is known to be islanded. Of the other techniques against which PRAM is compared, ROCOF and POR do not use communications, while PAD requires communications between a location taking a measurement from the main grid system and the local location that is measuring from the system that may become islanded.
Simulations using SimPowerSystems [19] are used to demonstrate and evaluate the performance of the PRAM method. Different active and reactive power transfers (in both directions) across the circuit breaker that is opened to create islanded conditions have been simulated prior to islanding to investigate sensitivity. Stability is investigated by applying single phase to ground, phase to phase and three phase faults at various locations local to and at several increasingly remote locations from the measurement location. Furthermore, stability is also tested by applying step changes to the load (of varying magnitudes and in both directions – i.e. increasing and decreasing) being supplied by the DG and observing the response of the PRAM technique. Capacitor switching and transformer inrush events are also included to test for stability of the LOM techniques. All tests have been repeated using models of the aforementioned alternative techniques to enable comparative analysis of performance and quantifications of the improvements offered by PRAM over the other techniques to be defined.
The remainder of the paper is structured as follows: section II describes the existing techniques (ROCOF, POR and PAD) and the proposed PRAM algorithms. Section III and IV present the power system used for testing and outlines the test procedures, while results of tests, analysis of the relative performances of all techniques and discussion of the observed results are included in section V. Conclusions and an overview of on-going and future work are presented in section VI.
II. LOM PROTECTION TECHNIQUES A.Overview of ROCOF, POR and PAD Algorithms
A sudden imbalance between generator input mechanical power and load will lead to a frequency change at the generator output. The equation of approximating the initial ROCOF in response to this is as follows:
Hz s H G
f P
dROCOF /
2
(1)
This is a postprint of a paper submitted to and accepted for publication in IEEE Transactions on Smart Grid [http://dx.doi.org/10.1109/TSG.2015.2439512] and is subject to IEEE copyright.
∆P is the change of active power output, f is system frequency, G is the nominal generator rating and H is the inertia constant of the generator.
ROCOF at a specific time k can be estimated as follows:
Hz s
NT f f
ROCOF k kNT / (2)
NT represents the length of measuring window which includes N cycles (usually 2-40 cycles). A trip signal is initiated once a pre-set ROCOF threshold is violated. Current minimum setting recommended by National Grid 0.125 Hz/s in utility systems [20]. A time delay can be applied to enhance the stability of ROCOF, but this may be at the expense of sensitivity.
The POR method operates on a measurement of ROCOF at the DG location and a double integration function is triggered if ROCOF exceeds a predetermined setting (normally 0.2 Hz/s) [17]. Any detected phase offset is then accumulated till a violation of a threshold (normally 20°) is reported and a trip signal is issued. The main reported benefit of POR is that it is immune to any noise in the ROCOF measurement.
PAD, in summary, measures voltage angles from two locations to calculate a difference value [18], and requires communications. A trip signal will be generated when the measured phase angle difference exceeds a threshold value. B.M class PMUs used in simulation
[image:3.612.333.543.104.223.2]There is no uniform structure adopted for commercially available PMUs as several companies provide such offerings. However, the functional blocks of a typical PMU are generic, and can be found in [10].
Fig. 1. Typical Single-phase section of a PMU.
A high-level overview of a three-phase PMU algorithm is shown in [13] and its single-phase section is presented in Fig. 1. [13] shows how a PMU is capable of calculating and reporting frequency and ROCOF.
Since most PMUs use a DFT/FFT to estimate the phasor, the time window applied to this estimation can dramatically affect the measurement of both frequency and ROCOF during system transients. As shown in Fig. 2, the voltage waveform may experience severe amplitude and angle transients during system events. DFT/FFTs tend to estimate phasors based on an assumption that there is significant transients or discontinuities
[image:3.612.48.299.463.580.2]in the originally-sampled waveforms, which are normally measured over a moving window [21]. As already mentioned, the work reported here is based upon analyses of the ROCOF behavior of such “fake” phasors to improve LOM protection.
Fig. 2. Illustration of phasor estimation in samples during a transient. [10]
Two types of M class PMUs, both of which were originally designed to comply with the standard, have been implemented within simulation. These are fixed-filter and adaptive-filter versions of the M class PMU algorithm reported and tested in [22]. The version of PMU software used within this paper is also available publicly at [23]. In both cases, the M-class filters are configured to comply as far as possible with the reporting rate (FS) 50 Hz requirements in C37.118.1. The FIR filter consists of four main boxcar filter stages which are cascaded. The lengths of each of the boxcar sections are 1, 1, 2 and 2 cycles respectively [22]. Additionally, prior to the calculation of frequency, a further fifth boxcar stage of 0.5 cycles in duration is added. This also affects the ROCOF measurement. 1)Fixed-filter PMU:
In this PMU, the boxcar filter lengths are fixed at times corresponding to multiples of the nominal frequency period, and the correlation waveform (quadrature oscillator, Fig. 1) is fixed at nominal frequency.
2)Adaptive filter PMU:
In this PMU, the boxcar filter lengths and correlation waveform are adaptive depending upon the measured fundamental frequency [22]. This type of PMU is “virtually ideal” in terms of its abilities to reject harmonics, cater for unbalance and in performing under off-nominal frequency conditions.
C.Tripping Logic and Peak Ratio Algorithm
This is a postprint of a paper submitted to and accepted for publication in IEEE Transactions on Smart Grid [http://dx.doi.org/10.1109/TSG.2015.2439512] and is subject to IEEE copyright.
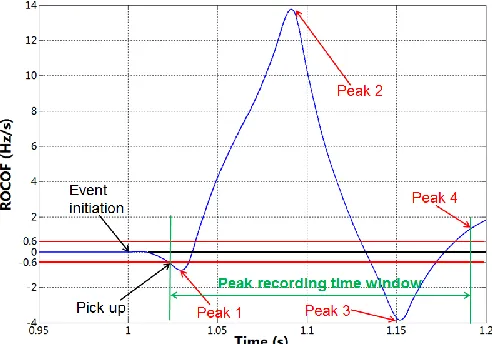
in the UK, assuming inertia reduction to 4 s in future. When the threshold is violated, the Peak-Ratio function is enabled and processes the measured ROCOF value from the PMU for a predetermined time period. Transient events such as switching or distant faults may cause “fake” phasor deviations to be generated for short times, even if the actual network frequency is not disturbed. This occurs when the transient event duration is shorter than the PMU measurement time window, because the time window includes pre-event, event, and post-event data. These “fake” phasors can include positive or negative ROCOF peaks. Following an actual event, in real-time, the event type is clearly unknown. Therefore it is impossible to know, from the initial ROCOF values alone, whether they are indicative of a true network frequency deviation trend, or are the initial values in a series of “fake” phasors due to a transient event. Longer-term ROCOF values (covering the times of the 2nd and 3rd ROCOF peaks for example) can be used to provide a more complete picture of actual network behavior and event type.
[image:4.612.49.295.353.525.2]The 1st peak is captured as illustrated in Fig. 3 and during the subsequent time period, the “peak recording time window” in Fig. 3, a peak will be recorded whenever ROCOF experience a zero crossing, then the highest subsequent peak (in the positive or negative direction) following the zero crossing is recorded, with a final peak being recorded after the final zero crossing at the end of the peak recording time window.
Fig. 3. Illustration of peak ratio calculation for an unknown event with an example pick up threshold of 0.6Hz/s and peak recording time window of
170ms
The peak ratio of the ROCOF waveform is calculated as shown in Equation (3):
PeakRatio
PeaksA
PeaksB (3)and are calculated after the expiration of the analysis time window (e.g. 170 ms after triggering as shown in Fig. 3). As shown in Fig. 3, the largest peak values in each of the polarities ( and ) are recorded. Subsequently,
contains and all other peaks with the same polarity (in this case ). contains and all other peaks with the same polarity (in this case ). If all ROCOF values that are calculated during the processing time
period have the same sign, then ∑ is defined as 0, the peak ratio is infinite, and the algorithm will always trip in such cases. In Equation (3), the largest values of the various peaks reveal the information about the nature of the associated frequency deviation. The 1st main peak of the measured ROCOF value gives an indication of how much the frequency will deviate from nominal and the subsequent peak in the opposite direction after the zero crossing illustrates how much it will tend to return to nominal. The ratio of these elements is indicative to the overall severity of the frequency deviation. Non-LOM (e.g. switching or fault) events usually manifest as a rapid voltage phase-angle change at the point of measurement. This, from a measured ROCOF perspective, usually results in initial positive and negative ROCOF peaks of similar amplitudes, assuming that the overall “aggregate” network frequency does not change substantially due to the event. The opposite-sign ROCOF peaks are due to the finite measurement time window. However, for a genuine load-change, islanding, or loss-of-generation event, the perceived ROCOF will be a combination of the “switching” aspect previously described, combined with a more uni-directional frequency change due to the changed generation/load balance, further compounded by the complex action of generator governor and AVR actions, etc. which can cause (hopefully damped) oscillatory frequency effects. Therefore, during these events which correspond to genuine LOM events, the ratio of 1st to 2nd (or 2nd to 3rd) ROCOF peaks moves away from equilibrium, towards a situation where the ROCOF peak on one side of zero can have a peak value significantly greater than the ROCOF peak of the opposite sign. In the extreme, an islanding event in which no governor action whatsoever takes place will have a very high and potentially “infinite” Peak Ratio. In some cases, only one very large 1st peak may be observed, if the switching effects happen to cause a ROCOF disturbance in the same direction as the real frequency deviation. In other cases there may be a small 1st peak caused by an initial “fake” phasor due to switching, which will then be dwarfed by the 2nd peak as local frequency rapidly diverges from the initial value.
If both ROCOF and peak ratio thresholds are violated, a tripping signal will be sent to isolate the DG (and potentially any other DGs that may be in the island). In all tests reported in this paper, it was found through experimentation that peak ratio thresholds of 2.0 and 2.1 for the fixed-filter and adaptive PMU methods were the optimal to produce the best compromise between sensitivity and stability.
III. TEST SYSTEM
This is a postprint of a paper submitted to and accepted for publication in IEEE Transactions on Smart Grid [http://dx.doi.org/10.1109/TSG.2015.2439512] and is subject to IEEE copyright.
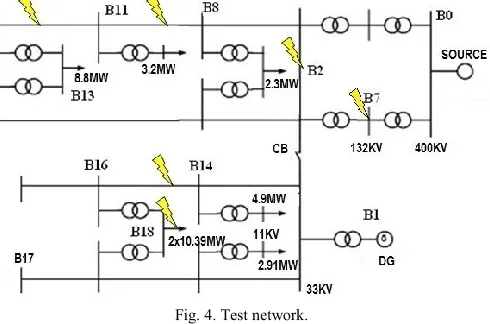
[image:5.612.52.297.333.495.2]connected synchronous generators with either PF (set to per-unit) control or PV control (with three types of frequency and voltage droop combinations), connected to the 33 kV system. It is much easier to protect converter-interfaced DG using ROCOF or other frequency based techniques as these are generally less stable under islanded conditions than synchronous DG [24]. Synchronous machines often present the “worst-case” challenge for detecting LOM conditions: accordingly, this is why they have been used in these studies. To characterize the grid connection (indicated as SOURCE in Fig. 4), synchronous generators with variable capacities and inertia are used to represent different “strengths” of grid connection to test the capability of the method under a variety of grid system conditions. All synchronous machine models use IEEE standard controllers [25]. The sampling rates of each of the two types of PMU used in the study are set to 4 kHz. A model, that has been validated under previous work, of a commercially available ROCOF-based relay is used with typical settings of 0.14 Hz/s and time delay of 0. The model of the POR is configured to pick up at 0.2 Hz/s and has a 20° phase offset setting. The PAD relay is set to operate when the phase angle difference exceeds 10°. ROCOF and POR are set to achieve similar sensitivity.
Fig. 4. Test network.
A range of scenarios have been simulated to investigate and compare the performance of PRAM against the other three methods:
- Grid capacity of 5 GVA with inertia of 8s and DG capacity of 30 MVA connected at B1 with PF control (set to per-unit).
- Grid capacity of 5 GVA with inertia of 8s and DG capacity of 30 MVA connected at B1 with PV control. Three types of droops are applied on DG control system during sensitivity tests. Various tests have been conducted with frequency droops of the DG controller set to 20%, 5%, 2% and voltage droops set to 50%, 10%, 1% respectively to represent a passive, normal and aggressive roles of control.
- Grid capacity of 40 GVA (based on typical summer demand of the UK) with inertia of 8s, 6s, 5s or 4s and DG capacity of 30 MVA connected at B1 with PV control. These types of arrangements are only applied in stability test in terms of very large load (more than 1 GW) switching events remote to distribution network.
Several scenarios, representing a wide range of system conditions, have been created using the test network. In all stability tests, the DG is delivering output power of 90% of its capacity (27 MW). An additional scenario with a DG output of 30% of its capacity has been applied in sensitivity tests:
- Tests of sensitivity to islanding events: islanding events with different active power and reactive power imbalances between the DG generation output and local load demand prior to islanding. The imbalance is illustrated as a percentage difference between the power transferred through the interconnecting breaker (CB in Fig. 4) prior to islanding and the capacity of DG.
- Tests of stability during local non-LOM faults: three different types of faults (single phase to ground, phase to phase, and three phase) at six different locations between B11&B13, B14&B16, B8&B11 and at B2, B7 and B18. It is assumed that faults are cleared 0.25 s after initiation by network protection. As a further test of stability, for single phase faults, reclosing is applied 500 ms after initial clearance, and it is assumed that the fault is transient in nature and no longer on the system. It should be also noticed that, for phase to phase and three phase fault at location B2, the act of clearing the fault by opening the breakers causes a subsequent islanding condition, which should be detected by the LOM protection.
- Tests of stability during local load switching: loads are switched (in and out) at different sites with magnitudes of 2.91 MW, 3.2 MW, 4.9 MW, 8.8 MW, 10.39 MW, 20.78 MW, and 28.59 MW. These values of load changes are identical to those used in [24]. (labels in Fig. 4)
- Tests of stability during large remote system events: this is carried out via remote load switching (at SOURCE in Fig. 4) with magnitudes of 1 GW, 1.3 GW, 1.5 GW and 1.8 GW (the largest credible loss of load in the UK [26]. The grid inertia is also varied during these tests to characterize future systems that may have reduced inertia compared to present systems due to increased use of renewables and HVDC imports.
- Test of stability during capacitor switching events: capacitors are switched out at B2 corresponding to reactive power levels of 8.1 MVar and 11 MVar; these values were chosen based on the prevailing reactive power consumption level of the network.
- Test of stability during transformer inrush: a three-phase fault at B18 was applied and cleared. Subsequently, both transformers connected at B18 were switched in under no load conditions. A further test, using the example “Three-Phase Saturable Transformer” in SimPowerSystems [19], has also been carried out using a 450 MVA transformer energized on a 500 kV network.
IV. TEST RESULTS A.Sensitivity
This is a postprint of a paper submitted to and accepted for publication in IEEE Transactions on Smart Grid [http://dx.doi.org/10.1109/TSG.2015.2439512] and is subject to IEEE copyright.
imbalance. An example of the measured ROCOF curves for different active power imbalances is shown in Fig. 5. Experiments to establish and compare the performance of the methods when a mix of active and reactive power imbalances are encountered will be carried out and reported in the future.
The ROCOF value estimated by the DFT within the PMU is relatively large in the time immediately following the transient. The peak recording time window must be set to be large enough so that the ROCOF trace corresponding to “fake” phasors is recorded – in this case 150 ms (7.5 cycles) is defined, as shown in Table I. The peak ratio threshold is selected as 2 for PRAM I and 2.1 for PRAM II and these are typical settings selected for the tests in this network. The peak ratio settings of 2 and 2.1 also ensure stability when a large constant 0.56 Hz/s is measured when 1.8 GW generation loss occurs at the smallest demand of 20 GVA in the UK, assuming grid inertia reduced to 4 s in future. In this case, only three peaks is recorded (
[image:6.612.315.566.51.95.2]= + , = ) and the 0.56 Hz/s contributes to , and subsequently contributes to peak ratio.
Fig. 5. Measured ROCOF: 2.5% to 10% active power imbalance prior to islanding (2% F Droop; 1% V Droop).
TABLE I
SETTINGS FOR PROPOSED RELAY
Pick Up Peak Ratio Threshold Time Window
PRAM I 0.60 Hz/s 2.0 150 ms
PRAM II 0.60 Hz/s 2.1 150 ms
TABLE II
RESULTS: ISLANDING WITH ACTIVE POWER IMBALANCES (90%DG OUTPUT;X: FAIL TO REACT;TIMES: TRIPPING TIME;F: FREQUENCY;V: VOLTAGE)
Control Imbalance PRAM I PRAM II POR ROCOF PAD
PF (per-unit)
2.5% 191ms 211ms 799ms X 553ms 5% 180ms 191ms 560ms 140ms 384ms 7.5% 176ms 191ms 458ms 140ms 309ms 10% 174ms 191ms 396ms 140ms 264ms 20% F
Droop; 50% V Droop
2.5% 191ms 211ms 872ms X 586ms 5% 180ms 191ms 592ms 140ms 397ms 7.5% 176ms 191ms 474ms 140ms 315ms 10% 174ms 191ms 406ms 136ms 266ms 5% F
Droop; 10% V Droop
2.5% 191ms 211ms X X 728ms
5% 180ms 191ms 752ms 145ms 454ms 7.5% 176ms 191ms 563ms 145ms 345ms 10% 174ms 191ms 464ms 136ms 285ms
2% F Droop;
1% V Droop
2.5% 191ms 191ms X X 1.204s
5% 180ms 191ms X X 634ms
7.5% 176ms 191ms X X 430ms
10% 174ms 191ms X 136ms 333ms
TABLE III
RESULTS: ISLANDING WITH ACTIVE POWER IMBALANCES (30%DG OUTPUT)
Control Imbalance PRAM I PRAM II POR ROCOF PAD
PF (per-unit)
2.5% 188ms 191ms 741ms 530ms 508ms 5% 178ms 191ms 508ms 190ms 339ms 7.5% 174ms 191ms 402ms 140ms 259ms 10% 172ms 191ms 336ms 140ms 209ms 20% F
Droop; 50% V Droop
2.5% 187ms 191ms 798ms X 528ms 5% 178ms 191ms 531ms 220ms 346ms 7.5% 174ms 191ms 414ms 140ms 262ms 10% 172ms 191ms 344ms 140ms 211ms 5% F
Droop; 10% V Droop
2.5% 188ms 191ms 1.110s X 633ms
5% 177ms 191ms 628ms X 372ms
7.5% 174ms 191ms 464ms 195ms 273ms 10% 172ms 191ms 374ms 140ms 216ms 2% F
Droop; 1% V Droop
2.5% 187ms 191ms X X 959ms
5% 178ms 191ms X X 486ms
7.5% 174ms 191ms X X 318ms
10% 172ms 191ms 382ms 140ms 222ms
TABLE IV
RESULTS: ISLANDING WITH REACTIVE POWER IMBALANCES (90%DG OUTPUT) Control Imbalance PRAM I PRAM II POR ROCOF PAD
PF (per-unit)
2.5% X X X 580ms 702ms
5% 195ms 211ms 573ms 155ms 403ms 7.5% 187ms 191ms 491ms 155ms 343ms 10% 182ms 191ms 428ms 150ms 296ms 20% F
Droop; 50% V Droop
2.5% X X X X 596ms
5% 195ms 211ms 624ms 175ms 430ms 7.5% 190ms 191ms 506ms 155ms 346ms 10% 182ms 191ms 446ms 155ms 303ms 5% F
Droop; 10% V Droop
2.5% X X X X 702ms
5% 195ms 211ms 762ms X 471ms
7.5% 190ms 191ms 681ms 155ms 426ms 10% 182ms 191ms 500ms 155ms 318ms 2% F
Droop; 1% V Droop
2.5% X X X X X
5% 197ms 211ms X X 995ms
7.5% 190ms 191ms X X 518ms
10% 182ms 191ms X X 385ms
TABLE V
RESULTS: ISLANDING WITH REACTIVE POWER IMBALANCES (30%DG OUTPUT) Control Imbalance PRAM I PRAM II POR ROCOF PAD
PF (per-unit)
2.5% X X X X 1.069s
5% X X X X 829ms
7.5% X X X X 636ms
10% 199ms 211ms 737ms 425ms 509ms 20% F
Droop; 50% V Droop
2.5% X X X X 1.161s
5% X X X X 829ms
7.5% X X X X 666ms
10% 200ms 211ms 802ms X 536ms
5% F Droop; 10% V Droop
2.5% X X X X 1.463s
5% X X X X 1.055s
7.5% X X X X 798ms
10% 202ms 221ms X X 630ms
2% F Droop;
1% V Droop
2.5% X X X X X
5% X X X X X
7.5% X X X X X
10% 202ms 221ms X X 1.751s
[image:6.612.51.568.132.725.2] [image:6.612.54.295.282.457.2]This is a postprint of a paper submitted to and accepted for publication in IEEE Transactions on Smart Grid [http://dx.doi.org/10.1109/TSG.2015.2439512] and is subject to IEEE copyright.
performance for cases where PF control and PV control are used with a frequency droop of 20% and a voltage droop of 50%, as the frequency within the islanded network continues to drift from nominal for both scenarios during LOM events. For frequency droops of 5% and 2% and voltage droops of 10%, and 1%, frequencies settle quickly at new values (ROCOF returns to 0 rapidly when the frequency settles at its new value); this presents difficulties for angle based ROCOF techniques in terms of being able to detect LOM under these conditions.
B.Stability
It has been observed that the use of alternative controllers in the model makes no appreciable difference to performance of the DG during the stability tests. Accordingly, PV control with a frequency droop of 5% and a voltage droop of 10% is used in all stability tests.
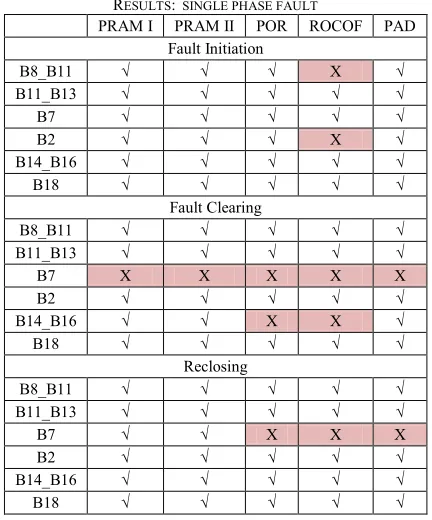
1)Single phase to earth faults:
As shown in Table VI, PRAM and PAD remained stable during fault initiation, fault clearing and single phase reclosing at all locations except for fault clearing and reclosing (PRAM rode through) at B7, which is also the case for POR and ROCOF – this is probably because B7 involves a very large fault current contribution from the grid, and therefore disturbs the grid source (which is modeled as a synchronous machine and not as an ideal source) more so than other faults. POR and ROCOF also trip for fault clearing operations at B14_B16 and ROCOF reacts incorrectly to fault initiation at B2 and at B8_B11.
TABLE VI
RESULTS: SINGLE PHASE FAULT
PRAM I PRAM II POR ROCOF PAD Fault Initiation
B8_B11 √ √ √ X √
B11_B13 √ √ √ √ √
B7 √ √ √ √ √
B2 √ √ √ X √
B14_B16 √ √ √ √ √
B18 √ √ √ √ √
Fault Clearing
B8_B11 √ √ √ √ √
B11_B13 √ √ √ √ √
B7 X X X X X
B2 √ √ √ √ √
B14_B16 √ √ X X √
B18 √ √ √ √ √
Reclosing
B8_B11 √ √ √ √ √
B11_B13 √ √ √ √ √
B7 √ √ X X X
B2 √ √ √ √ √
B14_B16 √ √ √ √ √
B18 √ √ √ √ √
2)Phase to phase fault:
ROCOF is stable for the majority of faults, but trips at fault inception at locations B2 and B7 and at fault clearance at B7, B8_B11 as shown in Table VII. PRAM I trips when the fault at
B7 is cleared, while PRAM II does not. This is due to the fact that the peak ratio estimated is very close to the threshold; furthermore, the reporting rate (50 Hz) of both PRAM I and PRAM II leads to a slightly different value around theoretical ratio. POR and PAD are very stable under this scenario.
TABLE VII
RESULTS: PHASE TO PHASE FAULTS
PRAM I PRAM II POR ROCOF PAD Fault Initiation
B8_B11 √ √ √ √ √
B11_B13 √ √ √ √ √
B7 √ √ √ X √
B2 √ √ √ X √
B14_B16 √ √ √ √ √
B18 √ √ √ √ √
Fault Clearing
B8_B11 √ √ √ X √
B11_B13 √ √ √ √ √
B7 X √ √ X √
B2 √ √ √ √ √
B14_B16 √ √ √ √ √
B18 √ √ √ √ √
3)Three phase to earth fault:
PRAM are stable for all scenarios except for fault initiation at location B7 and clearing at B8_B11 and B7 as shown in Table VIII. Fault clearing at B8_B11 resulted in a ROCOF of 1.38 Hz/s after the “fake” phasor period and the value oscillated slowly. To address this, a processing window of greater than 150 ms could be applied at the expense of a longer tripping time. PAD performs similarly to PRAM, but also suffers for fault inception at B2 and B8_B11. POR trips when faults are initiated at B2, B7 and B14_B16 and for fault clearance at B8_B11, B11_B13, B7 and B14_B16. ROCOF operates incorrectly for all except for fault inception at B14_B16 and clearing at B2 and B18.
TABLE VIII RESULTS: THREE PHASE FAULT
PRAM I PRAM II POR ROCOF PAD Fault Initiation
B8_B11 √ √ √ X X
B11_B13 √ √ √ X √
B7 X X X X X
B2 √ √ X X X
B14_B16 √ √ X √ √
B18 √ √ √ X √
Fault Clearing
B8_B11 X X X X X
B11_B13 √ √ X X √
B7 X X X X X
B2 √ √ √ √ √
B14_B16 √ √ X X √
B18 √ √ √ √ √
4)Local small load change:
[image:7.612.329.546.120.303.2] [image:7.612.65.281.417.677.2]This is a postprint of a paper submitted to and accepted for publication in IEEE Transactions on Smart Grid [http://dx.doi.org/10.1109/TSG.2015.2439512] and is subject to IEEE copyright.
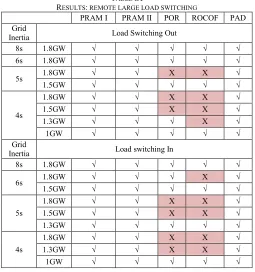
5)Remote large load change:
As shown in Table IX, in this scenario, PRAM and PAD relay remain stable for the “worst” case, which is when grid inertia is 4 s and the largest load of 1.8GW is switched out or in. POR remains stable for a 1.8 GW load change, but only when system inertia is higher than 6 s. ROCOF will trip for 1.8 GW load switching with system inertia of 6 s and suffers more when inertia drops further.
TABLE IX
RESULTS: REMOTE LARGE LOAD SWITCHING
PRAM I PRAM II POR ROCOF PAD Grid
Inertia Load Switching Out
8s 1.8GW √ √ √ √ √
6s 1.8GW √ √ √ √ √
5s 1.8GW √ √ X X √
1.5GW √ √ √ √ √
4s
1.8GW √ √ X X √
1.5GW √ √ X X √
1.3GW √ √ √ X √
1GW √ √ √ √ √
Grid
Inertia Load switching In
8s 1.8GW √ √ √ √ √
6s 1.8GW √ √ √ X √
1.5GW √ √ √ √ √
5s
1.8GW √ √ X X √
1.5GW √ √ X X √
1.3GW √ √ √ √ √
4s
1.8GW √ √ X X √
1.3GW √ √ X X √
1GW √ √ √ √ √
6)Capacitor switching:
All relays can ride through every scenario in this test. 7)Transformer inrush:
All relays can ride through every scenario in this test. V. DISCUSSION
It is clear that PAD seems to be an “ideal” method as it is has a very small NDZ, and is relatively stable to load changes and fault events, except for three phase faults at certain locations. This is to be expected, as it directly monitors the phase angle difference between that measured at the DG and that measured at a grid location. However, this comes at the expense of communications being required, and cost, availability and reliability are all concerns. POR uses a local ROCOF measurement and requires no communications. It exhibits a relatively larger NDZ when the droops of the DG controller are set to be more aggressive (lower) and trips falsely during large load changes when compared to PRAM. As expected, ROCOF is sensitive and fast to trip during genuine islanding events, but suffers from stability problems during faults and load changes – particularly when system inertia is reduced. In the UK, ROCOF settings of 1 Hz/s with a 500 ms time delay have been proposed for future application [20]. However, applying such settings
will mean that the LOM protection will obviously be much less sensitive to real islanding events, and while this could solve the stability problem, it will greatly decrease sensitivity and lead to much larger NDZs for detection of islanding conditions, which could be a potentially dangerous situation.
PRAM possesses a very small NDZ for both active and reactive power imbalances regardless of DG controller configuration. For reactive power imbalances, it is relatively more difficult to detect islanding. The peak ratios are always infinite, but a relatively smaller magnitude (when compared to purely active power) of ROCOF is experienced for reactive power-only imbalances, so sensitivity is reduced; however, this also applies to ROCOF. A large reduction in DG active power output from 90% to 30% makes islanding detection marginally easier for all algorithms under active power imbalance conditions. Theoretically, the ROCOF level remains the same as all the parameters remain unchanged according to Equation (1). The marginal change in behavior of the algorithms may be due to slightly different transient stresses on the DG rotors during the islanding events. The reduction of DG output also makes islanding detection more difficult under reactive power imbalance conditions. The peak ratios remain infinite but an even smaller magnitude of ROCOF is experienced and this affects all algorithms.
The major benefit of PRAM is that it is more stable during large grid disturbances, even when system inertia is reduced. This could be a major benefit in the future.
VI. CONCLUSIONS AND FUTURE WORK
This paper has presented a description of a new anti-islanding technique which analyses the dynamic behavior of the ROCOF measurement produced by PMUs during and following system transients. It exhibits high sensitivity to genuine islanding events and good levels of stability during fault, load change, capacitor switching and transformer inrush including events where the grid system inertia is reduced, as may be the case in the future as the penetration of renewables increases. The operation of PRAM has been tested against three alternative techniques: ROCOF, POR and PAD. PRAM only requires local voltage measurements, so there is no need for communications.
[image:8.612.46.301.153.425.2]This is a postprint of a paper submitted to and accepted for publication in IEEE Transactions on Smart Grid [http://dx.doi.org/10.1109/TSG.2015.2439512] and is subject to IEEE copyright.
where reactive power imbalances are encountered prior to islanding, is also an area of on-going and future activity.
REFERENCES
[1] Terzija, V.; Valverde, G.; Deyu Cai; Regulski, P.; Madani, V.; Fitch, J.; Skok, S.; Begovic, M.M.; Phadke, A., "Wide-Area Monitoring, Protection, and Control of Future Electric Power Networks," Proceedings of the IEEE , vol.99, no.1, pp.80,93, Jan. 2011
[2] Hlatshwayo, M.; Chowdhury, S.; Chowdhury, S.P.; Awodele, K.O.; "Impacts of DG penetration in the reliability of Distribution Systems," Power System Technology (POWERCON), 2010 International
Conference on , vol., no., pp.1-8, 24-28 Oct. 2010
[3] Morren, J.; de Haan, S.W.H.; , "Impact of distributed generation units with power electronic converters on distribution network protection," Developments in Power System Protection, 2008. DPSP 2008. IET 9th
International Conference on, vol., no., pp.664-669, 17-20 March 2008.
[4] Ten, C.F.; Crossley, P.A.; , "Evaluation of Rocof Relay Performances on Networks with Distributed Generation," Developments in Power System
Protection, 2008. DPSP 2008. IET 9th International Conference on, vol.,
no., pp.523-528, 17-20 March 2008.
[5] Mahat, P.; Zhe Chen; Bak-Jensen, B., "A Hybrid Islanding Detection Technique Using Average Rate of Voltage Change and Real Power Shift," Power Delivery, IEEE Transactions on , vol.24, no.2, pp.764,771, April 2009
[6] W. Freitas, Z. Huang, and W. Xu, “A practical method for assessing the effectiveness of vector surge relays for distribute generation applications,”
IEEE Trans. Power Del., vol. 20, pp. 57–63, Jan. 2005.
[7] Bohan Liu; Ke Jia, "Impedance Estimation and the Total Harmonic Distortion Methods for Islanding Detection," Renewable Energy
Research and Applications (ICRERA), 2012 International Conference on ,
vol., no., pp.1,4, 11-14 Nov. 2012
[8] Reigosa, D.D.; Briz, F.; Charro, C.B.; Garcia, P.; Guerrero, J.M., "Active Islanding Detection Using High-Frequency Signal Injection," Industry
Applications, IEEE Transactions on , vol.48, no.5, pp.1588,1597,
Sept.-Oct. 2012
[9] Terzija, V.; Valverde, G.; Deyu Cai; Regulski, P.; Madani, V.; Fitch, J.; Skok, S.; Begovic, M.M.; Phadke, A., "Wide-Area Monitoring, Protection, and Control of Future Electric Power Networks,"Proceedings of the IEEE , vol.99, no.1, pp.80,93, Jan. 2011
[10] A.G. Phadke; J.S. Thorp, 2008: Synchronized Phasor Measurements. Springer Science+Business Media, 247pp.
[11] IEEE Standard for Synchrophasor Measurements for Power
Systems," IEEE Std C37.118.1-2011 (Revision of IEEE Std
C37.118-2005) , vol., no., pp.1,61, Dec. 28 2011
[12] IEEE Standard for Synchrophasor Data Transfer for Power
Systems," IEEE Std C37.118.2-2011 (Revision of IEEE Std
C37.118-2005) , vol., no., pp.1,53, Dec. 28 2011
[13] Roscoe, A.J.; Abdulhadi, I.F.; Burt, G.M., "P-Class Phasor Measurement Unit algorithms using adaptive filtering to enhance accuracy at off-nominal frequencies," Smart Measurements for Future Grids (SMFG),
2011 IEEE International Conference on , vol., no., pp.51,58, 14-16 Nov.
2011
[14] Roscoe, A.J.; Abdulhadi, I.F.; Burt, G.M., "P and M Class Phasor Measurement Unit Algorithms Using Adaptive Cascaded Filters," Power
Delivery, IEEE Transactions on , vol.28, no.3, pp.1447,1459, July 2013
[15] IEEE Standard for Synchrophasor Measurements for Power Systems --
Amendment 1: Modification of Selected Performance
Requirements," IEEE Std C37.118.1a-2014 (Amendment to IEEE Std
C37.118.1-2011) , vol., no., pp.1,25, April 30 2014
[16] Phadke, A.G.; Kasztenny, B., "Synchronized Phasor and Frequency Measurement Under Transient Conditions," Power Delivery, IEEE
Transactions on , vol.24, no.1, pp.89,95, Jan. 2009
[17] Roscoe, Andrew (2009) Measurement, control and protection of microgrids at low frame rates supporting security of supply. PhD thesis, Electronic And Electrical Engineering, University of Strathclyde. [Online]. Available: http://strathprints.strath.ac.uk/39631/
[18] Zhenzhi Lin; Tao Xia; Yanzhu Ye; Ye Zhang; Lang Chen; Yilu Liu; Tomsovic, K.; Bilke, T.; Fushuan Wen, "Application of wide area measurement systems to islanding detection of bulk power systems,"
Power Systems, IEEE Transactions on , vol.28, no.2, pp.2006,2015, May
2013
[19] Matlab (Simpowersystems) [Online]. Available: http://www.mathworks.co.uk/products/simpower/
[20] “Frequency Changes during Large Disturbances and their Impact on the Total System [Online]. Available:
http://www.nationalgrid.com/NR/rdonlyres/D3F18F81-BFE8-4BA1-8B
82-CCD6CD0A0A4F/62018/GC0035IndustryConsultationv10.pdf
[21] Siebert, W., 1985: Fourier Transforms in Discrete-Time Systems. MIT
Press, pp.558-594
[22] Roscoe, A.J., "Exploring the Relative Performance of Frequency-Tracking and Fixed-Filter Phasor Measurement Unit Algorithms Under C37.118 Test Procedures, the Effects of Interharmonics, and Initial Attempts at Merging P-Class Response With M-Class Filtering," Instrumentation and Measurement, IEEE
Transactions on , vol.62, no.8, pp.2140,2153, Aug. 2013
[23] Roscoe, Andrew (2013) P and M class PMUs for use within MATLAB
simulink simulations. IEEE. [Online]. Available:
http://strathprints.strath.ac.uk/44682/
[24] "Engineering Technical Report NO. 139: Recommendations for settings of loss of mains protection relays", Energy Networks Association, 2009. [25] IEEE Sub-synchronous resonance working group, "Second benchmark
model for computer simulation of sub-synchronous resonance," IEEE
Transactions on Power Apparatus and Systems, vol. PAS-104, no. 5,
1985, pp. 1057-1066.
[26] "Operating the Electricity Transmission Network in 2020", National Grid, 2011.
Feng Ding received the B.Eng. degrees in electronic and electrical engineering from Shanghai University of Electrical, Shanghai, China. And he received the MSc degrees in Electronic and Electrical Engineering from the University of Strathclyde, UK. He is currently a Ph.D. student with the Institute for Energy and Environment in the Department of Electronic and Electrical Engineering at the University of Strathclyde.
Campbell D. Booth received the B.Eng. and Ph.D. degrees in electronic and electrical engineering from the University of Strathclyde, Glasgow, UK. He is currently a Reader with the Institute for Energy and Environment in the Department of Electronic and Electrical Engineering at the University of Strathclyde.
![Fig. 2. Illustration of phasor estimation in samples during a transient. [10]](https://thumb-us.123doks.com/thumbv2/123dok_us/1519752.104573/3.612.48.299.463.580/fig-illustration-phasor-estimation-samples-transient.webp)