International Journal of Emerging Technology and Advanced Engineering
Website: www.ijetae.com (ISSN 2250-2459, ISO 9001:2008 Certified Journal, Volume 7, Issue 9, September 2017)
49
An Efficient Method to Get Improved Peak Signal to Noise
Ratio (PSNR), Using Support Vector Machine
Deepti Gupta
1, Musheer Ahmad
21,2Jamia Millia Islamia, New Delhi, India
Abstract— Process of evacuating noise from an image or signal which ensue in the course of imaging due to the ambiguity of measurements or instruments is Image Denoising. It is an essential pre processing expedient for image analysis. The goal of image denoising is removal of noise and preserve the useful information of an image. Conventional denoising methods can sift noise; on the other hand they procreate the image details fuzzy. Image denoising through support vector machine is an excellent approach because it removes unwanted noise, by virtue of possessed the image detail. This paper explores image denoising using Support Vector Machine with the help of coding in MatLab. To understand the procedure, Brain MRI images were introduced with a set of known noises and then denoised. The same procedure was repeated to denoise four brain MRI images with salt and pepper noise. Experimental results displays peak to noise ratio (PSNR) of proposed method is much better than the conventional method ,this method remove noise and preserve the important image detail in order to restore the original image.
Keywords— Image Denoisinig, Peak Signal to Noise Ratio (PSNR), MRI Images, Salt and Pepper Noise, Support Vector Machine.
I. INTRODUCTION
The demand for efficient image reformation manner has grown with the immense production of digital images taken in lousy conditions. Even though good cameras , an image reclamation is always adored to enlarge their range of action Image is largely necessary in the field of medical treatment ,weather prediction, military operations, industrial and agricultural production, cinema, cartoon films and many more. Image acquisition, image sending/receiving, image transmission, image display etc are essential parts of any Image processing system. In the image acquirement task, the transcendence of image is reduced due to the involution of the system. Causes of noise in an image generally occur during storage, transmission and acquisition of the image .Images are usually impressed by some exterior environment throughout image processing and so occur noise.Image denoising is an inescapable image processing function, both as a task itself, and as an integral part in other processes.
There are many ways to denoise an image or a data set[3,5]. The main properties of a good image denoising model are that it will remove noise while preserving edges. Important task of image denoising is removal of noise and excerption the nets message from image[4].
II. TYPES OF IMAGE NOISES
Image is visual through pixels with compatible intensities. If any intensity value rise and fall at some pixel then noise is constituted at that pixel. In simple words, noise is the undesirable signals or sound offered by the sensor and digital cameras. Images can also be corrupted during transference due to intrusion in the channel because of phenomenon like lightening or atmospheric disturbances[6].We have explained some common noises in the next section of this paper.
A. Gaussian Noise
Gaussian noise is statistical noise having a probability density function (PDF) equal to that of the normal distribution, which is also known as the Gaussian distribution. The probability density function p of a Gaussian random variable z is given by:
(2.1)
Where, z represents the grey level, µ the mean value and σ the standard deviation. Principal sources of Gaussian noise in digital images arise during acquisition e.g. sensor noise caused by poor illumination and/or high temperature, and/or transmission e.g. electronic circuit noise[5].
B. Salt-and-Pepper Noise
International Journal of Emerging Technology and Advanced Engineering
Website: www.ijetae.com (ISSN 2250-2459, ISO 9001:2008 Certified Journal, Volume 7, Issue 9, September 2017)
50 (2.2)
(2.3)
(2.4)
Where MAX and MIN are the maximum and minimum image values respectively. For 8 bit images, MIN = 0 and MAX = 255. The idea is that with probability 1-
α
the pixels are unaltered; with probabilityα
the pixels are changed to largest to smallest values. The altered pixels look like black and white dots sprinkled over the image. Impulse noise takes place in situations where high transients occur [14].C. Poisson Noise
Poisson noise, also known as shot noise, is a basic form of uncertainty associated with the measurement of light. It is typically caused by statistical quantum fluctuations, i.e., variation in the number of photons sensed at a given exposure level. It follows Poisson distribution. The number of photons N measured by a given sensor element over a time interval t is described by the following discrete probability distribution:
(2.5)
Where, 𝜆 is the expected number of photons per unit time interval.
D. Speckle Noise
Speckle is a granular ‗noise‘ that inherently exists in and degrades the quality of the active radar and synthetic aperture radar (SAR) images. It is also known as texture. Generalized model of the speckle is represented as,
g(n,m) = f(n,m) *u(n,m) + ϵ(n,m) (2.6)
Where, g(n,m) is the observed image, u(n,m) is the multiplicative component and ϵ (n,m) is the additive component of the speckle noise.
III. IMAGE DENOISING BASED ON SUPPORT VECTOR
MACHINES
Support vector machines are supervised learning models accompanied by learning algorithms that explore data and perceive patterns, used for classification and regression analysis[4].
The method of Support vector machines is based on the principle of statistical learning theory VC theory and structural risk minimization, according to the confined sample information to get the best settlement between the difficulty of the model (that is the study accuracy to the training sample) and the learning ability (Error-free to identify any samples), so as to get the best promotion ability. The key of SVM lies in the choice of the kernel function, normally, the low dimensional space vector sets usually are difficult to be divided, and the solution is to map the low dimensional space to a high dimensional space If we choose the proper kernel function, we will get a high dimensional space classification function. In SVM theory, different kernel functions will lead to different kinds of SVM algorithm [12].
A. The Essential Facts of Support Vector Machines
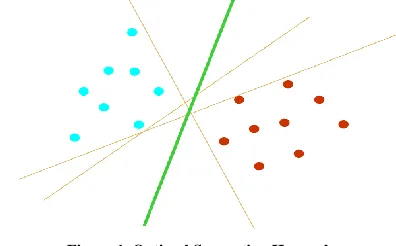
[image:2.612.339.537.444.567.2]The goal of SVM is to produce a classifier that will work well on unseen examples, i.e. it generalises well. Consider the example in Figure 1. Here there are many possible linear classifiers that can separate the data, but there is only one that maximizes the margin (maximises the distance between it and the nearest data point of each class). This linear classifier is termed the optimal separating hyperplane. Intuitively, we would expect this boundary to generalize well as opposed to the other possible boundaries.
Figure 1. Optimal Separating Hyperplane
Optimal Hyperplane for Linearly separable Patterns
Consider the training sample
where xi is the input pattern for the i th
example and di is
the corresponding desired response (+1 or -1).
Equation of hyperplane that does the separation is
International Journal of Emerging Technology and Advanced Engineering
Website: www.ijetae.com (ISSN 2250-2459, ISO 9001:2008 Certified Journal, Volume 7, Issue 9, September 2017)
51
For a given w and b , the separation between the hyperplane defined in Eqn(3.1) and the closest data point is called the margin of separation denoted by
ρ
. The goal of SVM is to find the particular hyperplane for whichρ
is maximum.B. Advantages of Maximize the Margin
To reduce the test error , keep training error low(say 0), and minimize the VC-dimension h
Relative Margin : ρ/D
VC-Dimension
If then dimension (d) does not matter.
Maximizing margin improves generalization.
h can be made independent of the dimensionality (d) Margin ρ = 2R.
C. Formulation Of SVM
Let
We want to maximize k such that
Value of g(x) dependents on
1. or
2.
,
We use approach (2) and formulate the problem as
[Here we take ½ for convenience]
Quadratic objective function with linear inequalities as constraints.
Integrating the constraints into the Lagrangian form , we get ,
Minimize
(3.4)
Converting to the dual form
Objective:
=
+
At the optimum
and
gives
and
(3.5)
Karush-Kuhn-Tucker (KKT) conditions
[ (3.6)
( Kuhn Tucker condition state that at the optimum all the terms corresponding to lagrange multiplier in J function should goes to 0 )
Eqn (3.6) will be zero
should be either +1 or -1 .
[ It means if this should
be touch the margin and these are the only support vectors]
Objective:-
-
By using (a) & (b) in Eqn (3.4) we get
International Journal of Emerging Technology and Advanced Engineering
Website: www.ijetae.com (ISSN 2250-2459, ISO 9001:2008 Certified Journal, Volume 7, Issue 9, September 2017)
52
Now Q(α) is the scalar function of
α
iwhich is quadraticin α . (It is free from w and b) It is the dual function of J.
Solving the dual form
(3.7)
.
The only unknown (variables) is
α
i‘s.
The constraints are also on
α
i ‘s
only. Data vectors appear only as dot product Objective is convex , subject to linear constraints Can be solved using standard convex quadratic
program solver
.
Above problem (3.7) can be solved by Quadratic Programming solver to get the value of α and with the help of α we can find value of w0 [2,11].
IV. PEAK SIGNAL TO NOISE RATIO (PSNR)
The title peak signal-to-noise ratio (PSNR) is a manifestation for the ratio between the maximum possible value (power) of a signal and the power of deform noise that affects the merits of its demonstration. Due to extensive dynamic range of signals, (ratio between the largest and smallest possible values of a changeable quantity) the PSNR is generally expressed in terms of the logarithmic decibel scale. Image enhancement or improving the visual inspection of a digital image may be subjective. To say this, a method gives a better image, it can be depend on the person to person, So it is essential to determine quantitative/empirical standard to compare the effects of image enhancement algorithms on image quality[13].
The mathematical representation of the PSNR is as follows:
Where the MSE (Mean Squared Error) is:
Where:
f: represents the matrix data of our original image.
g: represents the matrix data of our degraded image.
m :represents the numbers of rows of pixels of the images. and i represents the index of that row.
n: represents the number of columns of pixels of the image. and j represents the index of that column.
MAX is the maximum signal value that exists in our original ―known to be good‖ image.
V. IMPLEMENTATION
The proposed method can be implemented by the following steps:
Step 1: We have loaded brain MRI image of size 256 x256.
Step 2: We have taken it as an original image,
Step 3: It is now contaminated by Salt and Pepper noise, to get noisy image,
Step 4: As we have already described in section III the process of image denoising through SVM,So we get the denoised image.
Step 5: PSNR value is evaluated for original image and noisy image.
Step 6: PSNR is calculated for Noisy Image and denoised image.
VI. SIMULATION AND RESULTS
International Journal of Emerging Technology and Advanced Engineering
Website: www.ijetae.com (ISSN 2250-2459, ISO 9001:2008 Certified Journal, Volume 7, Issue 9, September 2017)
53
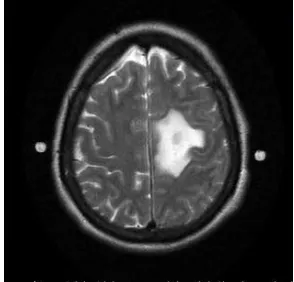
Figure.2(a) Original Brain Tumor MRI Image
Figure. 2(b)Noisy Brain Tumor MRI Image
[image:5.612.98.240.139.286.2]Figure.2(c) Denoised Brain Tumor MRI Image
Table 1
VII.CONCLUSIONS
In pursuance of the experiment and relative PSNR values for noisy and denoised image, we can conclude that the method introduced during this paper can obtain the image which has more clarity with high peak signal to noise ratio.
REFERENCES
[1] Bedi,P., Bansal,R. and Sehgal,P.2013. Using PSO in a spatial domain based image hiding scheme with distortion tolerance , Computers and Electrical Engineering ,Vol 39, 640–654.
[2] Kumar,N.N. and Ramakrishna,S. 2012. An Impressive Method to Get Better Peak Signal Noise Ratio (PSNR), Mean Square Error (MSE) Values Using Stationary Wavelet Transform (SWT),Global Journal of Computer Science and Technology,Vol 12, No.12. [3] Ismail,B. and Khan,A.2012. Image De-noising with a New
Threshold Value Using Wavelets Journal of Data Science Vol. 10, 259-270.
[4] Zhang,G.D., Yang,X.H., Xu,H, Lu,D.Q., Liu,Y.X. 2012. Image Denoising Based On Support Vector Machine ,Shanghai University of electric power, Shanghai, China.
[5] Nasri,M. and Nezamabadi-pour,H. 2009. Image denoising in the wavelet domain using a new adaptive thresholding function. Neurocomputing, Vol. 72, No. 4-6, 1012-1025.
[6] Bovik,A.L.2009.The Essential Guide to Image Processing ISBN: 978-0-12-374457-9 Academic Press is an imprint of Elsevier. [7] Zhao, J.Q. 2009.Research on the algorithm of image denoising based
on wavelet transform.Science and Technology innovation herald, Vol 35 .
[8] Hu,T., Wang,J.L.2008. Eye detection based on SVM . Computer engineering and Applications Journal, Vol 44,No.24.
[9] Cai,N., Hu,W.K., Li,F.Z. and Su,W.F. 2005. The algorithm of image denoising based on wavelet neural network. Acta Biophys Sin.
[10] Chang,S.G., Yu,B. and Vetterli,M.2000. Adaptive wavelet thresholding for image denoising and compression. IEEE Trans. Image Processing, Vol. 9, No. 9, 1532-1546.
[11] Simon,H. 1999.Neural Networks A Comprehensive
Foundation,Second Edition, Published by Pearson Education,Singapore.
[12] Gunn,S.R. 1998. Technical Report on Support Vector Machines for Classification and Regression University Of Southampton . [13] http://www.ni.com/white-paper/13306/en/.
[14] https://howlingpixel.com/wiki/Image_noise.
S.No. PSNR
Noisy Image Denoised Image
1. 24.6821 47.8108
2. 22.0425 33.6263
3. 23.1043 45.2127
[image:5.612.96.239.308.451.2] [image:5.612.94.241.477.618.2]