Int. J. Electrochem. Sci., 14 (2019) 10607 – 10621, doi: 10.20964/2019.11.46
International Journal of
ELECTROCHEMICAL
SCIENCE
www.electrochemsci.org
Voltammetric Determination of Bisphenol A in the Presence of
Uric Acid Using a Zn/Al-LDH-QM Modified MWCNT Paste
Electrode
Nurashikin Abd Azis1, Illyas Md Isa1,2,*, Norhayati Hashim1,2, Mohamad Syahrizal Ahmad1,2, Siti Nur Akmar Mohd Yazid1, Mohamad Idris Saidin1, Suyanta M. Si3, Rahadian Zainul4,
Alizar Ulianas4, Siriboon Mukdasai5
1 Department of Chemistry, Faculty of Science and Mathematics, Universiti Pendidikan Sultan Idris,
35900 Tanjong Malim, Perak, Malaysia
2 Nanotechnology Research Centre, Faculty of Science and Mathematics, Universiti Pendidikan Sultan
Idris, 35900 Tanjong Malim, Perak, Malaysia
3 Deparment of Chemistry Education, Faculty of Mathematics and Natural Science, Yogyakarta State
University, Indonesia
4 Department of Chemistry, Faculty of Mathematics and Natural Science, Universitas Negeri Padang,
West Sumatera 25171, Indonesia
5 Department of Chemistry, Faculty of Science, Khon Kaen University, Khon Kaen 40002, Thailand *E-mail: [email protected]
Received: 5 July 2019 / Accepted: 20 August 2019 / Published: 7 October 2019
A multiwalled carbon nanotube paste electrode (MWCNTPE) modified with zinc aluminium layered double hydroxide-quinmerac (Zn/Al-LDH-QM) was fabricated for simultaneous determination of uric acid and bisphenol A. This modified electrode was characterized by scanning electron microscope (SEM), transmission electron microscope (TEM), and electrochemical methods. Several experimental conditions such as percent of modifier, pH of the solution, and square wave voltammetry parameters were optimized. The effective surface area of the electrode were determined by chronocoulometry. There was several linear range where the sensor performs well which are within the concentration 0.3 – 30.0 µM and 50.0 – 100.0 µM for uric acid, and 0.3 – 50.0 µM and 10.0 – 100.0 µM for bisphenol A. The detection limit for both organics were 0.065 µM and 0.049 µM, respectively. The modified MWCNTPE was also tested for the determination of uric acid and bisphenol A in real samples and achieved high recoveries percentage from 98.0% to 108.3 %.
Keywords: Layered double hydroxide, Modified electrode, Bisphenol A, Uric acid 1. INTRODUCTION
containers. BPA can leaches from these materials and enters into foodstuff [1,2]. It cause harm to human as this chemical belongs to a group of endocrine-disrupting compound, and its toxicity is widely reported in literature [3]. It has been shown that the urine is a suitable marker for monitoring of BPA because almost 100% orally administered BPA is excreted via urine [4,5]. In addition, studies also have shown that BPA is frequently found in waste water, river water, and sea water [6,7]. On the other hand, uric acid (UA) is a final product of purine metabolism, and the oxidation of electroactive UA in an aqueous solution can yield to allantoin as a major product, which is freely eliminated by urine [8]. Abnormal levels of UA are associated with gout disease, whereas the formation of UA crystal which eventually grow into stones causing harm to human organ such as kidney [9,10].
The commonly use methods for BPA and UA determination include colorimetric [11] and fluorometric [12], spectrophotometric [13] and spectrofluorimetric [14], solid phase extraction [15], and high performance-liquid chromatography [16]. However, these method are neither economical nor user-friendly for routine analysis. Therefore, it is desirable to develop analytical methods that are simple, low-cost, user friendly and high sensitivity as well as selectivity. Fortunately, these advantages owned by electrochemical sensor. The utilization of carbon paste electrode (CPE) fabricated with carbon nanotube (CNT) has shown great performance in electrochemical sensor [17,18]. Apart from that, layered double hydroxides (LDHs) (Scheme 1) have gained much attention in CPE fabrication due to their remarkable capability of anion exchange. The raising attention in LDH also comes from their versatile properties in terms of surface area, low toxicity and chemical inertness [19]. Related work in determination of various analytes by using LDH have been reported [20-22].
However, there is still no report on the use of LDH in simultaneous determination of BPA and UA. Therefore, in this work, a multiwalled carbon nanotube paste electrode (MWCNTPE) modified with zinc aluminium layered double hydroxide-quinmerac (Zn/Al-LDH-QM) has been fabricated for simultaneous determination of BPA and UA.
Scheme 1. Illustration of layered double hydroxide. 2. EXPERIMENTAL
2.1. Chemicals
sodium hydroxide, respectively and kept in refrigerator at 4°C. Potassium phosphate buffer solution (PBS) was prepared by mixing the stock solution of 0.1 M K2HPO4 and 0.1 M KH2PO4.
2.2. Apparatus
Electrochemical experiments were conducted using a Potentiostat Ref 3000 and Potentiostat Series-G750. An electrochemical workstation consisting of modified MWCNT paste electrode as a working electrode, Ag/AgCl electrode as a reference electrode and platinum wire as a counter electrode. The surface morphology of Zn/Al-LDH-CP/MWCNT was observed using field emission scanning electron microscopy (FESEM), model SU8020 UHR (Hitachi, Japan) and transmission electron microscope (TEM), model JEOL-2000EX (Japan). The pH measurements were carried out on a Thermo Scientific Orion 2-Star Benchtop pH Meter.
2.3. Synthesis of zinc/aluminium-layered double hydroxide-quinmerac nanocomposites (Zn/Al-LDH-QM)
Zn/Al-LDH were synthesized by a conventional co-precipitation method, where Zn(NO3)2 and
Al(NO3)3 were used as a precursors [23]. Both precursors were dissolved in 250 mL of deionized water
and 50 mL of 0.1 M quinmerac (QM) solution was added. The mixture was stirred until the homogenized solution was produced. A few drops of sodium hydroxide were used to adjust the pH of the solution until reach pH 7.5. The mixture was left in oil bath shaker at 70°C for 24 hours. Then the slurry was centrifuged, washed and dried in oven at 60°C. The dried precipitate of Zn/Al-LDH-QM was finely ground and kept in a bottle at room temperature.
2.4. Electrode preparation
Zn/Al-LDH-QM (0%, 5%, 10%, 15%) and MWCNTs (100%, 95%, 90%, 85%) were mixed using a mortar and pestle with a few drops of paraffin oil. The homogenized paste was then tightly pressed into a Teflon tube, with one of the tube end was connected to a copper wire to produce established electrical contact. The surface was smoothened on a soft paper before each measurements.
3. RESULTS AND DISCUSSION
3.1. Characterization of Zn/Al-LDH-QM/MWCNTs
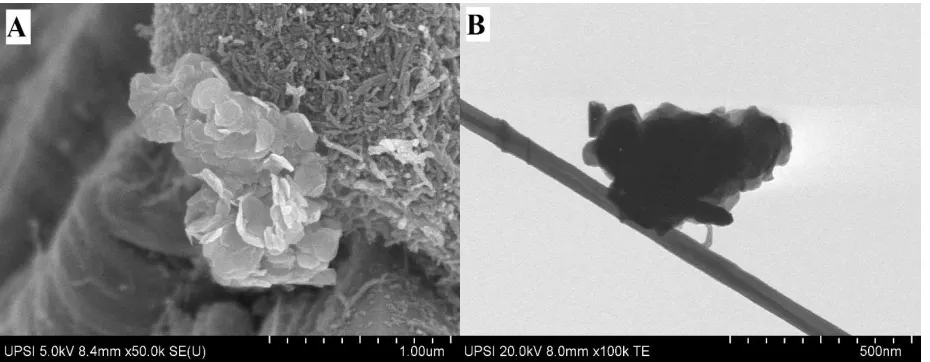
Figure 1. (A) SEM image of Zn/Al-LDH-QM and (B) TEM image of Zn/Al-LDH-QM/MWCNT mixture.
3.2. Characterization of sensor fabrication
Cyclic voltammetry measurement was performed for unmodified and modified multiwalled carbon nanotube paste electrodes (MWCNTPE) in 4.0 × 10⁻³ M K3[Fe(CN)6]. This redox couple has
been a recommended choice as a standard to demonstrate cyclic voltammetry because they exhibit nearly a reversible electrode reaction [24]. Fig. 2 shows the electrochemical response of K3[Fe(CN)6]
at both electrodes. Due to the bare properties, the unmodified MWCNTPE exhibited a low current signal; anodic peak current (Ipa) and cathodic peak current (Ipc) were 6.636 μA and 3.865 μA,
respectively. However, the voltammetric response is apparently improved at modified MWCNTPE with redox peak currents increased to Ipa = 11.44 μA and Ipc = 8.826 μA. Additionally, the
peak-to-peak separation (ΔEp) also declined from 591.8 mV to 367.8 mV, which could be due to the higher
electron transfer rate at the surface of modified electrode compared to unmodified electrode, although both electordes experienced the reversible reaction of K3[Fe(CN)6]. These results suggested that the
implementation of Zn/Al-LDH-QM to the modification of MWCNTPE contributed in an excellent electrochemical response of the electrode.
The CV results were supported by the findings obtained from electrochemical impedance spectroscopy (EIS) studies. In general, the semicircle portion of the EIS represents the electron transfer-limited process, and the linear portion corresponds to the diffusion-limited process. The diameter of semicircle corresponds to the charge transfer resistance (Rct) at the electrode surface. Fig. 3
illustrated Nyquist plots of unmodified and modified MWCNTPE. The unmodified MWCNTPE exhibits a large semicircle, compared to the modified MWCNTPE, which the Rct value of the former
[image:4.596.68.533.69.250.2]
Figure 2. Cyclic voltammograms of unmodified and modified MWCNT paste electrodes in 4.0 × 10⁻³ M K3[Fe(CN)6] containing 0.1 M KCl. Scan rate 100 mVs-1.
Where R, T and F have their usual meanings, A is the estimated surface area of electrode, and C is the concentration of the K3[Fe(CN)6] solution. Due to the relationship between charge transfer
resistance and the electron transfer rate across the interface [25], the kapp values were calculated for
unmodified and modified MWCNTPEs to be 8.95 × 10⁻⁵ cm s-1 and 1.48 × 10⁻⁴ cm s-1, respectively. The modified MWCNT showed high kapp and low Rct values which indicated a faster electron transfer
process. This process has been accelerated by the presence of Zn/Al-LDH-QM.
[image:5.596.179.418.516.708.2]
3.3. Optimization of the experimental conditions
3.3.1. Percentage of modifiers
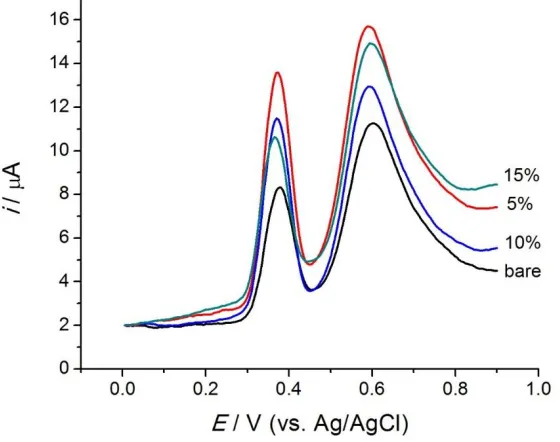
The influence of the percentage of Zn/Al-LDH-QM used as modifier in carbon paste composition towards the electrochemical response of 1.0 × 10⁻⁴ M of BPA and UA solution were investigated using square wave voltammetry. Fig. 4 shows the current response towards the modification of MWCNTPE with different percentage of Zn/Al-LDH-QM. The modification of MWCNTPE with 5:95 (%) ratio of Zn/Al-LDH-QM to MWCNTs exhibited the highest current peak due to increase in the conductive area on the electrode surface [26]. Further increased in the amount of modifier cause the current response to decreased possibly due to the alteration of the physical and physiochemical properties of the electrode surface [27]. Therefore, the modified MWCNTPE with 5% of Zn/Al-LDH-QM was implemented for subsequent experiments.
Figure 4. Graph of different composition ratios (%w/w) of Zn/Al-LDH-QM at modified MWCNT paste electrode.
3.3.2. pH effect
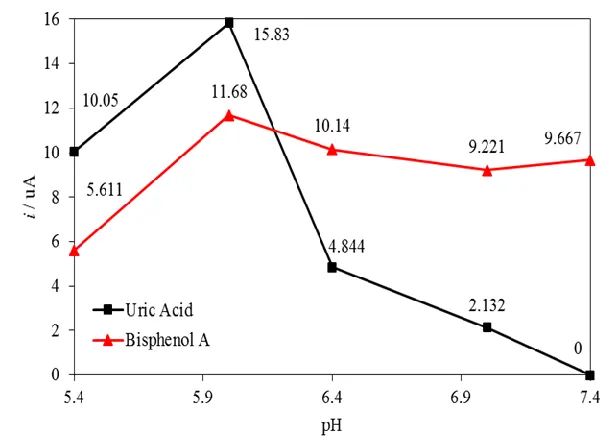
[image:6.596.158.438.301.522.2]
Figure 5. Effects of pH value on the current response of 1 × 10⁻⁴ M UA and BPA mixture.
3.3.3. Square wave voltammetry parameters
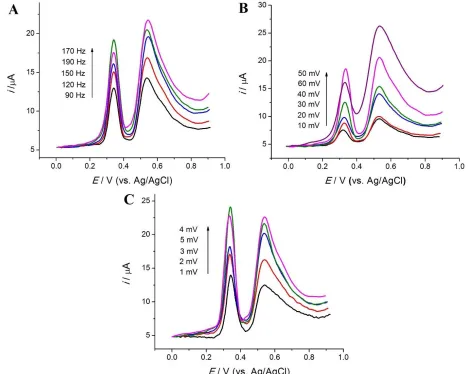
In square wave voltammetry (SWV) measurement, optimization of several parameters are taken into account as they may affect the electrode performance [29]. As shown in Fig. 6A, the effect of frequency was evaluated by increasing the frequency from 90 to 190 Hz. The current peak was increased up to 170 Hz and started to decrease at the frequency over 170 Hz. The measurements were continue by varied the step size from 1 to 5 mV, and resulted the highest current peak at step size 4 mV (Fig. 6B). The pulse size was measured from 10 to 60 mV. As shown in Fig. 6C, the highest current peak has been exhibited by pulse size of 50 mV. Thus, the optimum parameters used for subsequent experiments were at frequency 170 Hz, step size 4 mV and pulse size 50 mV.
3.3.4. Scan rate effect
Fig. 7A and Fig. 7B shows cyclic voltammograms of 1.0 × 10⁻⁴ M UA and BPA with different scan rates. Meanwhile, the inset graphs were plot of peak current versus scan rate (, which was observed to be directly proportional to one another. The equation can be expressed as Ipa (μA) = 0.021v
(mVs-1) + 8.109 (R2 = 0.9938) for UA, and Ipa (μA) = 0.021v (mVs-1) -1.243 (R2 = 0.9956) for BPA. In
[image:7.596.144.446.71.289.2]
Figure 6. Effects of the SWV parameters (A) frequency, (B) pulse size, and (C) step size on current response. Solution: 1 × 10⁻⁴ M UA and BPA mixture.
3.3.5. Chronocoulometry studies
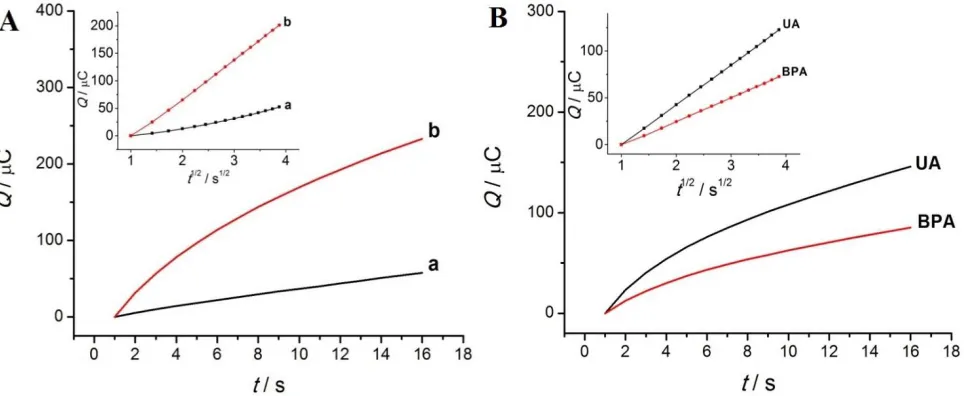
Chronocoulometry studies were performed to determine the effective surface area, A, of both unmodified and modified MWCNTPEs. 4.0 × 10⁻³ M K3[Fe(CN)6] solution was used as a model
complex. The A was calculated based on Anson equation:
Where Q (t) is charge, n in number of electron transfer, F is Faraday constant (96485 Coulombs/mole), c is concentration of substrate, and D is diffusion coefficient of K3[Fe(CN)6].
[image:8.596.63.534.73.447.2]
electrode effective surface area. This phenomenon would increase the adsorption site, and further enhance the electrochemical performance of the sensor [30].
The chronocoulometry experiments were then carried out on the modified MWCNTPE in 1.0 × 10⁻⁴ M UA and BPA solution. A plot of charge (Q) against the square root of time (t1/2) (Fig.8B) was obtained after background subtraction and exhibited a slightly linear relationship. Hence, D for UA and BPA were calculated to be 1.09 × 10⁻³ cm2 s-1 and 1.90 × 10⁻³ cm2 s-1, respectively. Based on Cottrell equation, Qads = nFAΓs, the adsorption capacity, Γs, for UA and BPA can be obtained as 1.72 x
[image:9.596.55.540.228.424.2]10-8 mol cm-2 and 1.95 x 10⁻⁸ mol cm-2, respectively.
Figure 7. Cyclic voltammogram of Zn/Al-LDH-QM/MWCNT paste electrode with the different scan rates in 1 × 10⁻³ M of (A) UA and (B) BPA.
Figure 8. (A) Chronocoulograms of (a) MWCNT paste electrode, and (b) Zn/Al-LDH-QM/MWCNT paste electrode in 4.0 × 10⁻⁴ M K
3[Fe(CN)6], (B) Chronocoulograms of
[image:9.596.59.541.483.681.2]
3.3.6. Calibration plot
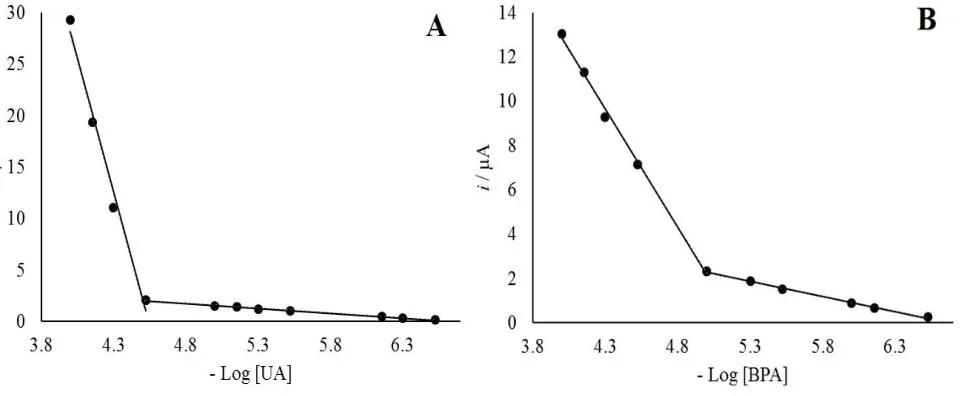
By using SWV, the modified MWCNTPE was applied for the successive determination of UA and BPA. Two working ranges were obtained for UA, i.e. from 0.3 – 30.0 µM and 50.0 – 100.0 µM (Fig. 9A). The linear regression equations of the first and second working range are y = -51.91x + 235.81 (R2 = 0.9875) and y = -0.9289x + 6.207 (R2 = 0.9954), respectively. Two working ranges were also obtained for BPA, i.e. from 0.3 – 50.0 µM and 10.0 – 100.0 µM (Fig. 9B). The linear regression equations of the first and second working range are y = -10.67x + 55.54 (R2 = 0.9969) and y = -1.368x
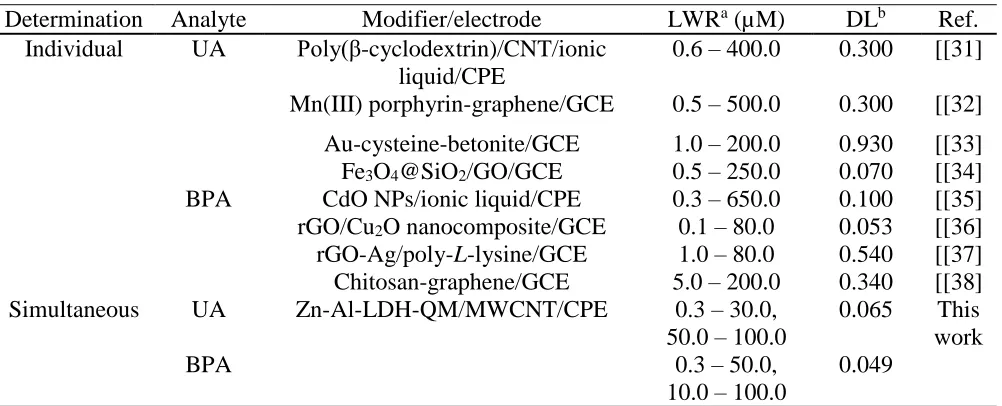
[image:10.596.63.543.295.493.2]+ 9.133 (R2 = 0.9956), respectively. The detection limit of 0.065 µM UA and 0.049 µM BPA were obtained. The performance of the modified MWCNTPE in determination of UA and BPA was compared to those method reported earlier (Table 1). The proposed mechanism of analytes at the surface of the modified MWCNTPE also shown in Scheme 2.
Figure 9. Calibration plot current peak versus –Log analytes concentration of various concentration of (A) UA and (B) BPA.
3.3.7. Repeatability
Table 1. Comparison between the current work and some reported sensors for the individual and simultaneous determination of UA and BPA.
Determination Analyte Modifier/electrode LWRa (µM) DLb Ref. Individual UA Poly(β-cyclodextrin)/CNT/ionic
liquid/CPE
0.6 – 400.0 0.300 [[31] Mn(III) porphyrin-graphene/GCE 0.5 – 500.0 0.300 [[32] Au-cysteine-betonite/GCE 1.0 – 200.0 0.930 [[33] Fe3O4@SiO2/GO/GCE 0.5 – 250.0 0.070 [[34]
BPA CdO NPs/ionic liquid/CPE 0.3 – 650.0 0.100 [[35] rGO/Cu2O nanocomposite/GCE 0.1 – 80.0 0.053 [[36]
rGO-Ag/poly-L-lysine/GCE 1.0 – 80.0 0.540 [[37] Chitosan-graphene/GCE 5.0 – 200.0 0.340 [[38] Simultaneous UA Zn-Al-LDH-QM/MWCNT/CPE 0.3 – 30.0,
50.0 – 100.0
0.065 This work
BPA 0.3 – 50.0,
10.0 – 100.0
0.049
a LWR – Linear working range. b DL – Detection limit.
[image:11.596.48.549.110.313.2]
Figure 10. Repeatability of the modified MWCNT paste electrode.
3.3.8. Interferences studies
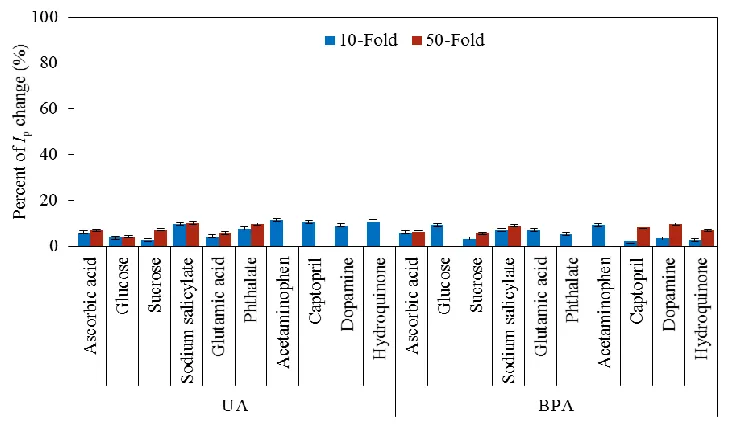
In order to evaluate the selectivity of the modified MWCNTPE, the influence of some potential interferences in 1.0 × 10⁻⁴ M UA and BPA solution was investigated. As shown in Fig. 11, the results indicated that most possible inorganic interferences, such as 10-fold and 50-fold concentration of ascorbic acid, glucose, sucrose, sodium salicylate, glutamic acid, phthalate, acetaminophen, captopril, dopamine, and hydroquinone did not interfere the electrochemical response of UA and BPA with the peak current changes less than ± 10%.
[image:12.596.156.440.74.299.2] [image:12.596.115.481.506.724.2]
3.3.9 Real sample analysis
[image:13.596.42.530.302.389.2]The feasibility of the modified MWCNTPE was tested with urine and water samples. The urine samples were collected from two healthy person and diluted 100 times with PBS buffer (pH 6), then analyzed without other pretreatment [39]. The lake water and sea water were collected from Tasik Embayu and Pantai Teluk Batik, respectively. One milliliter of each sample solution was mixed with 9 mL PBS buffer (pH 6) and then analyzed [40]. No BPA was detected in the water samples. Both urine and water samples were then analyzed by the standard addition method and the recoveries were calculated. The results are shown in Table 2. The high recovery (98.0 - 108.3 %) indicated that the modified MWCNTPE is appropriate for the analysis of real samples.
Table 2. Recoveries of UA and BPA in various samples.
Sample Detected (μM) Added (μM) Found (μM) Recovery (%)
UA BPA UA BPA UA BPA UA BPA
Urine 1 22.3 N.D. a 4.0 12.0 27.3 11.9 103.9 99.7
Urine 2 22.1 N.D. 4.0 12.0 26.4 11.8 100.9 98.0
Lake water N.D. N.D. 10.0 10.0 9.9 10.6 99.5 105.5
Sea water N.D. N.D. 10.0 10.0 10.5 10.8 105.0 108.3
a ND – Not detected.
4. CONCLUSIONS
The role of Zn/Al-LDH-QM as a mediator in the simultaneous determination of UA and BPA was successfully demonstrated. The Zn/Al-LDH-QM/ MWCNTPE shows a good conductivity with high electron transfer rate through CV and EIS studies. The modified electrode also exhibits a large effective electrochemical surface area and high adsorption capacity. The developed sensor was free from interference of ascorbic acid, glucose, sucrose, sodium salicylate, glutamic acid, phthalate, acetaminophen, captopril, dopamine, and hydroquinone. At optimal condition, the electrode shows a wide linear range of UA and BPA concentration with a detection limit of 0.065 µM and 0.049 µM, respectively. The electrode also applicable for UA and BPA analysis in urine and water samples. ACKNOWLEDGEMENTS
The authors would like to thank Ministry of Education Malaysia and Universiti Pendidikan Sultan Idris for providing the respective financial support Grant nos.: FRGS 2017-0075-101-02 for this work.
References
1. J.H. Kang, K. Kito and F. Kondo, J. Food Prot., 66 (2003)1444.
(2007) 139.
4. J.W. Brock, Y. Yoshimura, J.R. Barr, V.L. Maggio, S.R. Graiser, H. Nakazawa and L.L. Needham, J. Expo. Sci. Environ. Epidemiol., 11 (2001) 323.
5. K.A. Thayer, D.R. Doerge, D. Hunt, S.H. Schurman, N.C. Twaddle, M.I. Churhwell, S. Garantziotis, G.E. Kissling, M.R. Easterling, J.R. Bucher and L.S. Birnbaum, Environ. Int., 83 (2018) 107.
6. Y.Q. Huang, C.K.C. Wong, J.S. Zheng, H. Bouwman, B. Wahlstrom, L. Neretin and M.H. Wong, Environ. Int., 42 (2012) 91.
7. A. Careghini, A.F. Mastorgio, S. Saponaro and E. Sezenna, Environ. Sci. Pollut. Res., 22 (2015) 5711.
8. B.A. Lario and J. M.Vicente, Rheumatology, 49 (2010) 2010-5. 9. G. Nuki and P.A. Simkin, Arthritis. Res. Ther., 8 (2006) 1.
10. P.M. Ferraro and G.C. Curhan, Am. J. Kidney. Dis., 70 (2017) 158.
11. Y. Zhang, Y. Wang, W. Zhu, J. Wang, X. Yue, W. Liu, D. Zhang and J. Wang, Microchim. Acta, 184 (2017) 951.
12. Y.Wang, Y. Yang, W. Liu, F. Ding, Q. Zhao, P. Zou, X. Wang and H. Rao, Microchim Acta, 185 (2018) 281.
13. H.H. Hamzah, Z.M. Zain, N.L.W. Musa, Y.C. Lin and E. Trimbee, J. Anal. Bioanal. Tech., S7 (2013).
14. C.F. Nascimento and F.R.P. Rocha, Microchem. J., 137 (2018) 429. 15. S. Chen, J. Chen and X. Zhu, Microchim. Acta, 183 (2016) 1315.
16. D. Li, X. Ma, R. Wang and Y. Yu, Anal. Bioanal. Chem., 409 (2017) 1165. 17. I. Švancara and K. Schachl, Chem. Listy, 93 (1999) 490
18. A.J.S. Ahammad, J.J. Lee and M.A. Rahman, Sensors, (2009) 2289.
19. D. Tonelli, E. Scavetta and M. Giorgetti, Anal. Bioanal. Chem., 405 (2013) 603.
20. I.M. Isa, S. Saruddin, N. Hashim, M. Ahmad and S.A. Ghani, Int. J. Electrochem. Sci., 11 (2016) 4619.
21. M.S. Ahmad, I.M. Isa, N. Hashim, S.M. Si and M.I. Saidin, J. Solid State Electrochem., 22 (2018) 2691.
22. M.S. Ahmad, I.M. Isa, N. Hashim, M.S. Rosmi and S. Mustafar, Int. J. Electrochem. Sci., 13 (2018) 373
23. N. Hashim, S.N.M. Sharif, I.M. Isa, M. Mamat, N.M. Ali, S.A. Bakar, M.Z. Hussein, , N.A. Bakar and W.R.W. Mahamod, Res. J. Chem. Environ., 23 (2019) 36.
24. N. Elgrishi, K.J. Rountree, B.D. McCarthy, E.S. Rountree, T.T. Eisenhart, J.L. Dempsey, J. Chem. Educ., 95 (2018) 197.
25. A. Sharma, J.K. Bhattarai, S.S. Nigudkar, S.G. Pistorio, A.V. Demchenko, K.J. Stine, J Electroanal. Chem., 782 (2016) 174.
26. H.R. Zare, Z. Sobhani, M. Mazloum-Ardakani, Sensor Actuat. B-Chem., 126 (2007) 641. 27. I. Švancara, K. Vytřas, J. Barek, J. Zima, Crit. Rev. Anal. Chem., 31 (2001) 311.
28. M.I Saidin, I.M. Isa, M. Ahmad, N. Hashim, S.A. Ghani, Sensor Actuat. B-Chem., 240 (2017) 848.
29. J.G. Osteryoung and R.A. Osteryoung, Anal. Chem., 57 (1985)101A. 30. X. Dong, X. Qi, N. Liu, Y. Yang and Y. Piao, Sensors, 17 (2017) 836.
31. Y. Li, X. Zhai, H. Wang, X. Liu, L. Guo, X. Ji, L. Wang, H. Qiu and X. Liu, Microchim. Acta, 182 (2015)1877.
32. X,M, Guo, B. Guo, C. Li and Y.L. Wang, J. Electroanal. Chem., 783 (2016) 8.
33. D.K. Yadav, R. Gupta, V. Ganesan and P.K. Sonkar, Microchim. Acta, 184 (2017) 1951 34. K. Movlaee, P. Norouzi, H. Beitollahi, M. Rezapour and B. Larijani, Int. J. Electrochem. Sci.,
12 (2017) 3241.
and M.R. Ganjali, Food Anal. Methods, 9 (2016) 1763.
36. R. Shi, J. Liang, Z. Zhao, A. Liu and Y. Tian, Talanta, 169 (2017) 37.
37. Y. Li, H. Wang, B. Yan and H. Zhang, J. Electroanal. Chem., 805 (2017) 39. 38. Z. Yan, B. Fu, J. Chen, T. Liu and K. Li, Int. J. Electrochem. Sci., 13 (2018) 1556. 39. F. Ye, C. Feng, J. Jiang and S. Han, Electrochim. Acta, 182 (2015) 935.
40. N.B. Messaoud, M.E. Ghica, C. Dridi, M.B. Ali and C.M.A. Brett, Sensor Actuat. B-Chem., 253 (2017) 513.
![Figure 3. Nyquist plot of unmodified and modified MWCNT paste electrodes in 4.0 × 10⁻³ M K3[Fe(CN)6] containing 0.1 M KCl](https://thumb-us.123doks.com/thumbv2/123dok_us/1774558.131462/5.596.169.428.78.283/figure-nyquist-unmodified-modified-mwcnt-paste-electrodes-containing.webp)